Words: 5,616 Time: 30 Minutes
- Only 7 stocks delivered 54% of S&P 500 gains in 2024;
- Why we could see rotation out of tech next year;
- Applying a DCF to NVDA to determine its intrinsic value
2024 will go down as another great year for stocks in the trader’s almanack.
However, what won’t be recorded is just seven stocks comprised ~54% of the S&P 500 total gains (i.e., ~24% YTD with two trading days remaining).
It’s a bit like golf – you only need to record the final score – not how you did it.
However, the how matters (not just the ‘what’).
The “Magnificent 7″ – Apple, Google, Amazon, Meta, Tesla, Nvidia and Microsoft – comprise ~35% of the market’s total weight.
Not since the dot.com bubble of 2000 was the market this concentrated.
Now if you’re buying the Index on this basis of diversification… that’s not what you are getting.
It’s a concentrated bet on seven (expensive) stocks.
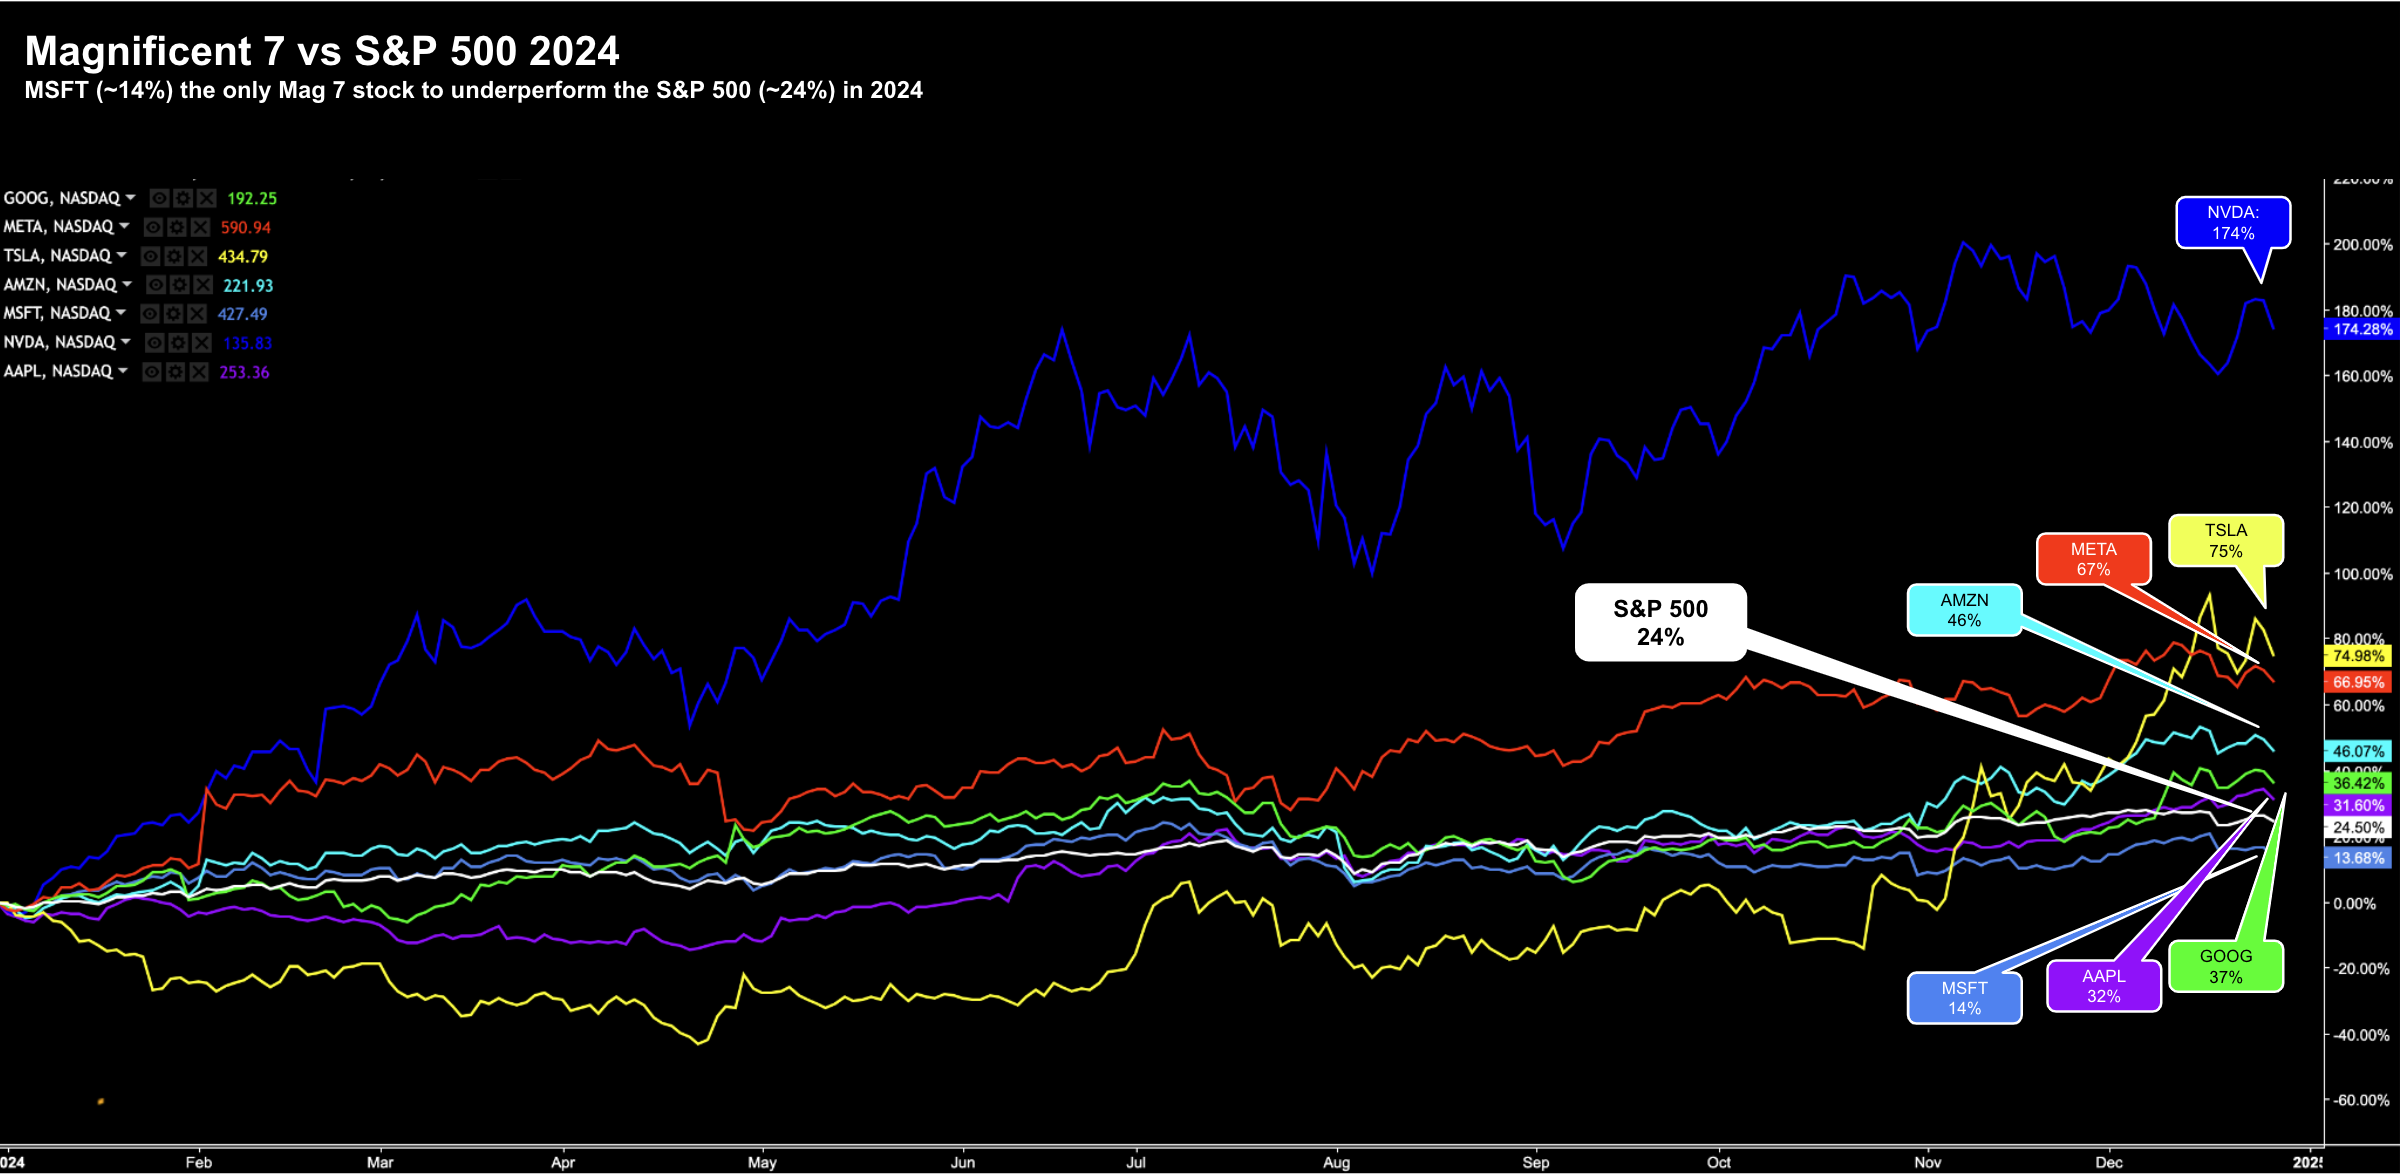
With the Index up ~24% – I put together this chart to show the respective YTD performances of the Mag 7:
December 27 2024
Investors who decided to run the tables (i.e., who punted on high valuations) did very well.
And that happens now and again…
We saw the same thing happen in 2021. However, 2022 didn’t turn out so well.
Could it repeat next year?
That’s very difficult to answer – however I will share a few thoughts.
Will We See Rotation?
- Nvidia – Trailing 55x / Forward 32x
- Apple – Trailing 43x / Forward 34x
- Tesla – Trailing 127x / Forward 142x
- Meta – Trailing 28x / Forward 23x
- Google – Trailing 27x / Forward 22x
- Microsoft – Trailing 36x / Forward 34x
- Amazon – Trailing 48x / Forward 37x
Further to my preface, investors are quite happy paying up for growth. And in some cases – any price. Below are analyst’s expectations for the year ahead:
- Nvidia – 50% earnings increase (down from 120% this year)
- Amazon – 20% earnings increase;
- Meta – 12% earnings increase;
- Google – 12% earnings increase
- Microsoft – 11% earnings increase
- Apple – 11% earnings increase
If we look at just the 4th quarter of 2024 – these seven stocks will likely show a 24% increase in earnings year-over-year.
However, if look ahead to Q4 2025 – earnings are expected to slow to 18% growth.
To be clear, there is nothing wrong with 18% EPS growth year over year. However, it’s a lot slower than 24%.
How will that impact valuations?
But let’s turn to the other 493 stocks which make up the S&P 500. Could they see inflows?
For Q4 2024 they will show a 4% increase in earnings YoY (and hence why investors are chasing large-cap tech)
However, for Q4 2025, they are expected to show 14% growth.
Granted, it’s not the 18% from large cap tech… but it’s accelerating. And that could attract upgrades.
From mine, there are alternatives to tech – however investors will need to wean themselves off what I call ‘tech cocaine’
For example, healthcare is expected to grow earnings 20% next year.
What’s more, these stocks have been taken to the woodshed and some now look attractive. For example, ELV (Elevance) and United Health (UNH) are now looking like a good long term risk / reward bet.
In addition, industrials are set to grow 19%; and materials 18%
For example, one name I added to recently was OXY – Occidental Petroleum. I think it represents value between $45 and $48 per share.
Warren Buffett might agree?
I’m also looking at Aussie miner BHP closely. The iron-ore juggernaut boasts:
- a weighted average cost of capital below 9%;
- has delivered a 5-year average return on invested capital (ROIC) of 26% (will be lower this year);
- delivers a very impressive free cash flow yield of 9%
Here I am looking at what I call their strong “economic profit margin” – the difference between their average ROIC (26%) and WACC (9%).
With the stock ~30% off its highs (given the declining state of Chinese demand) – it’s now trading ~2.9x its book value.
That’s now coming into what I could deem ‘value range’.
And there are other stocks like in sectors which the market is mostly ignoring (in favour of hyped tech names)
Now before we dive into valuing NVDA – at some point tech will revert to the mean.
But will investors wean themselves off tech?
Hard to say – as it’s all some (younger) investors know. The trade has worked for so long (over 10+ years) – they may not know anything else?
I know some people that only have tech in their portfolios – nothing else.
For what it’s worth – I see mean reversion as an immutable law of the market (e.g., not unlike the laws of physics such as thermodynamics, inertia and gravity).
And if that’s true – then buying tech at the current multiples could come at a cost.
Valuing the “AI Darling” NVIDIA
With NVDA trading around 32x forward earnings at the time of writing (or $137 per share) – the question investors should be asking themselves is whether that is good value.
For clarity – not just value – but good value.
To be clear, it’s a very difficult question to answer.
Some will immediately say “yes” and simply point to their astonishing growth rates (more on that in a moment)
Others might say there are risks….
Before I describe why I think the intrinsic value of the stock is in the realm of $75 to $85 (and why I sold $75 strike puts a few months ago for a ~15% return) – I do believe it’s a company worth owning for the long-term at the right price.
And that’s the thing…. at the right price.
Price is what we pay. Value is what we get.
For example, it’s not terribly difficult to find great quality if you do the work (and NVDA is exceptional quality) – but it’s another to pick it up at a price which will pay handsome (long-term) rewards at low risk.
That latter is far more important (i.e., managing our risk)
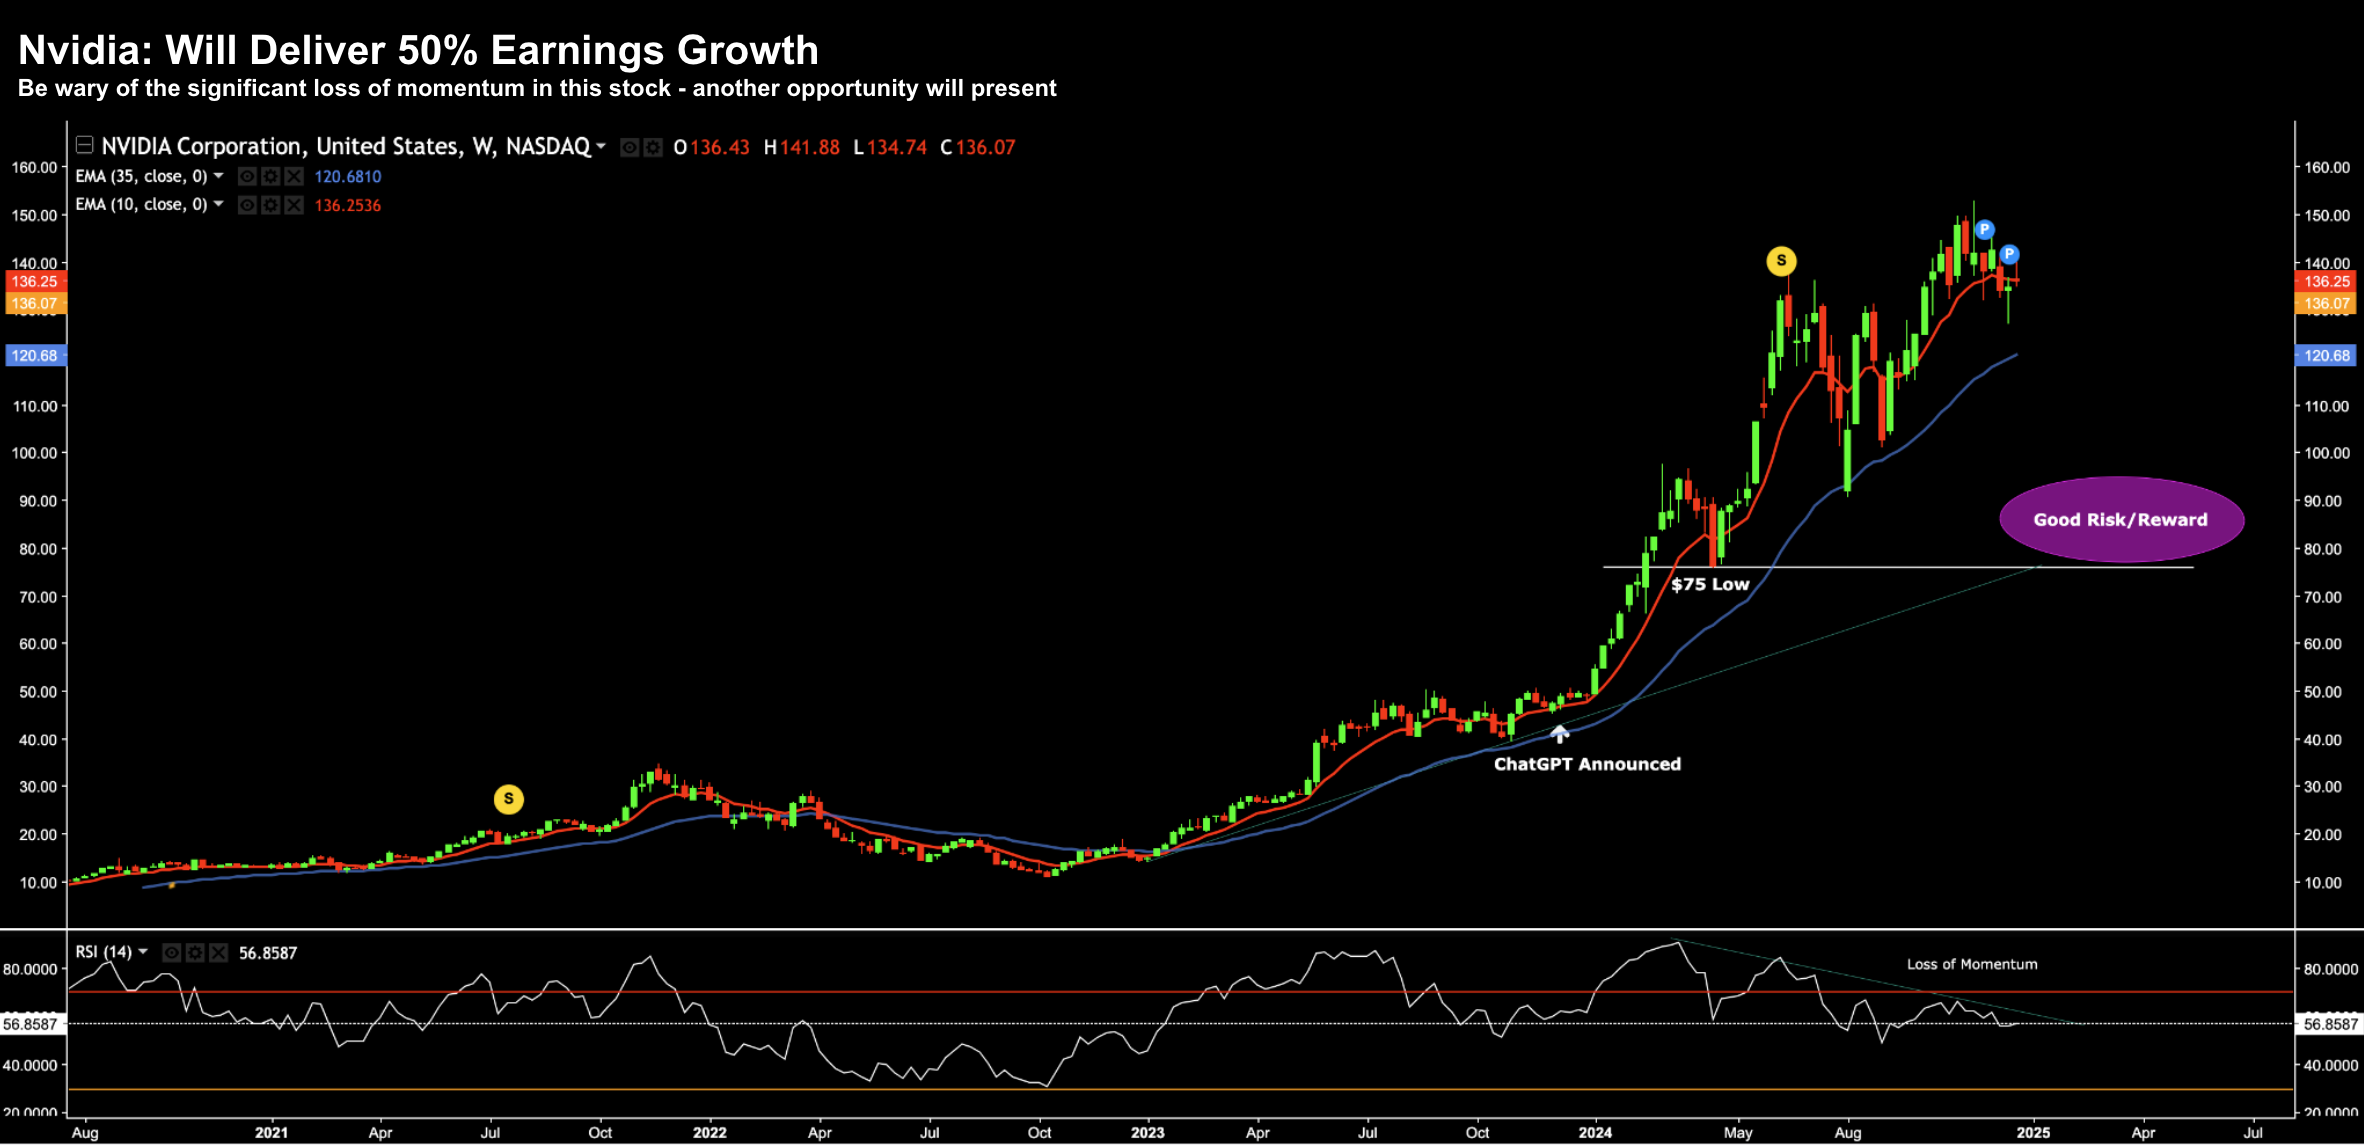
But let’s start with a look at the four year chart – if nothing else to show the meteoric rise over the past 12 months.
December 27 2024
I will come back to the purple ellipse (“good risk reward” zone of around $85) towards the end of the post…
But the 174% YTD increase in NVDA’s stock this year is extraordinary.
For what it’s worth – retail traders sent almost $30B into NVDA shares this year – according to Vanda Research.
Their data showed that net inflows have seen a nearly 9x jump from 2021.
Again, this is the AI darling (and perhaps “trading cocaine” for short-term traders)
Looking at the chart, I have noticed the sharp loss of momentum over the past 6+ months (shown with the RSI).
This tells me we could see further selling pressure in Q1.
But let’s put that to the side for now…
Our job – as intelligent investors – is to determine what’s a good long-term (5-year) risk / reward price?
And further to that – what do we think is intrinsic value based on the cash it produces (and is likely to produce)?
For example, is that price $130, $120, $100 or lower?
I like to say we’re always trying to do two (basic) things in this game:
- Estimate the earnings potential of companies for years into the future; and second
- Buy these companies at a very attractive prices (in the event things don’t go to plan)
In my 27 year experience trading stocks – things rarely go to plan.
It might be a problem with our valuation (as this isn’t an exact science); it’s management; the industry itself; the economy; or some random event we could never predict.
Did I mention we can’t predict the future?
Therefore, it’s within our best interest to allow for such (unknown) events.
Determining Intrinsic Value
If we think about value investing – we generally associate this with assessing tangible assets and current earnings.
And for most companies which “make things” at largely predictable rates – this is a very acceptable model.
To that extent, valuing a company more on its book value could work well; e.g., where book value reflects the accounting value of a company’s equity as reported on its balance sheet.
It is essentially the value of the company’s total assets minus total liabilities.
I often like to think that book value valuation is more straightforward and less subjective, as it relies on audited financial statements.
However, this balance sheet approach becomes more challenging for higher-growth companies – mostly due to the uncertainty surrounding the valuation of future prospects.
As an aside, this is why Warren Buffett won’t touch them – it’s very difficult for him to estimate their cash flows with a high degree of confidence.
And in most cases – they trade at multiples which would not interest him. Buffett is more likely to sell a stock at 30x forward earnings – not buy it (i.e. what we saw with Apple this year)
For example, what price do we put on the future of artificial intelligence (AI) – when we are still trying to understand its use cases?
For example, I’m not aware of any company successfully monetizing this at real scale. Yes, we have seen glimpses – but there’s a long long way to go.
Based on expected AI product-market-fit – they are investing hundreds of billions – with a narrow line of sight to ROI.
But I guess that is the tech business – inventing the future.
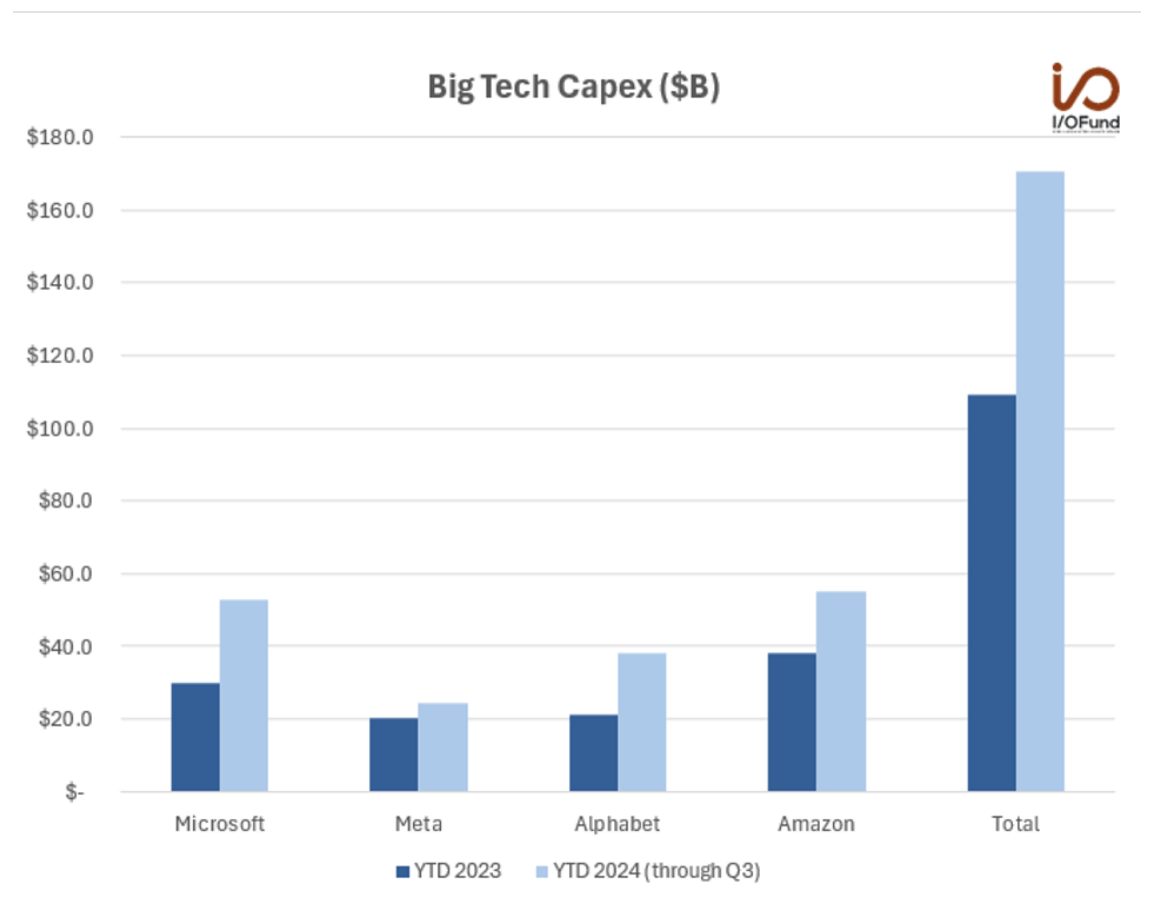
To demonstrate – US companies will invested more than $600B in capex over the past two years into AI chips (mostly to NVDA’s benefit — as I will demonstrate).
What’s more – that spending is expected to top $250B next year
And whilst these companies will no doubt grow their revenues (through more ads, widgets or marketing productivity gains etc) – my question is will the growth be highly profitable given the costs?
No-one can answer that with any degree of precision or confidence…
I ask these questions as sustainable growth within a business is rare due to factors such as:
- diminishing marginal returns;
- creative destruction;
- competitive pressures; (for e.g., if margins are strong – it attract new entrants); and finally
- the eventual erosion of competitive advantages like patents and brand dominance.
For example, there’s no doubt a company like NVDA will face strong competitive pressure from the likes of large-cap tech (who are now producing their own AI chips) – not to mention other chip companies such as AMD, Marvel, Intel, Broadcom and others.
Therefore, what will that do to their earnings growth?
Now NVDA is expected to deliver 51% earnings growth this year (more on this below) – however it’s down from 112% last year.
Every successful company will face inherent limits to their growth – there are no exceptions.
History is littered with painful stories of companies falling from the sky (for e.g., Xerox, Kodak, Blackberry, Nokia, Cisco, MySpace, Yahoo, Palm, Compaq and AOL all quickly come to mind)
Sound familiar?
From my lens, any investment in a strong growth company should satisfy two rigorous criteria:
- Is growth creating value? Companies must demonstrate growth within the confines of a durable and sustainable business; otherwise, growth is a zero-sum game. For instance, selling more “AI chips” might lead to higher sales, but without robust business strength, such growth risks eroding shareholder value; and second
2. Valuable growth must be offered at a sufficient discount. Doing this creates what Benjamin Graham called a margin of safety. This margin is meant to compensate for the uncertainties inherent in projecting future earnings and profitability. The ideal scenario is you are able to get the growth “for free” – where the investor only pays for the company’s current assets or earnings potential – while receiving the upside of future growth at no additional cost. However, that is extremely rare.
DCF to Establish NVDA’s Intrinsic Value
Let me start by setting the scene for the quality of this company.
It’s second to none…
In 2017, the chip leader booked ~$5B in total sales.
Fast forward to 2024 and that figure hit $61 billion.
Next year analysts see the company delivering $129B in revenue.
That’s an 8-year revenue CAGR of 50%
Now an 8-year revenue CAGR of 50% might be “easy” for a company only doing say “$100M” a year in revenue – but this company is projected to do $129B.
Given the sheer strength of their competitive moat in AI – they have delivered this growth with profit margins exceeding 60%.
It’s simply unparalleled.
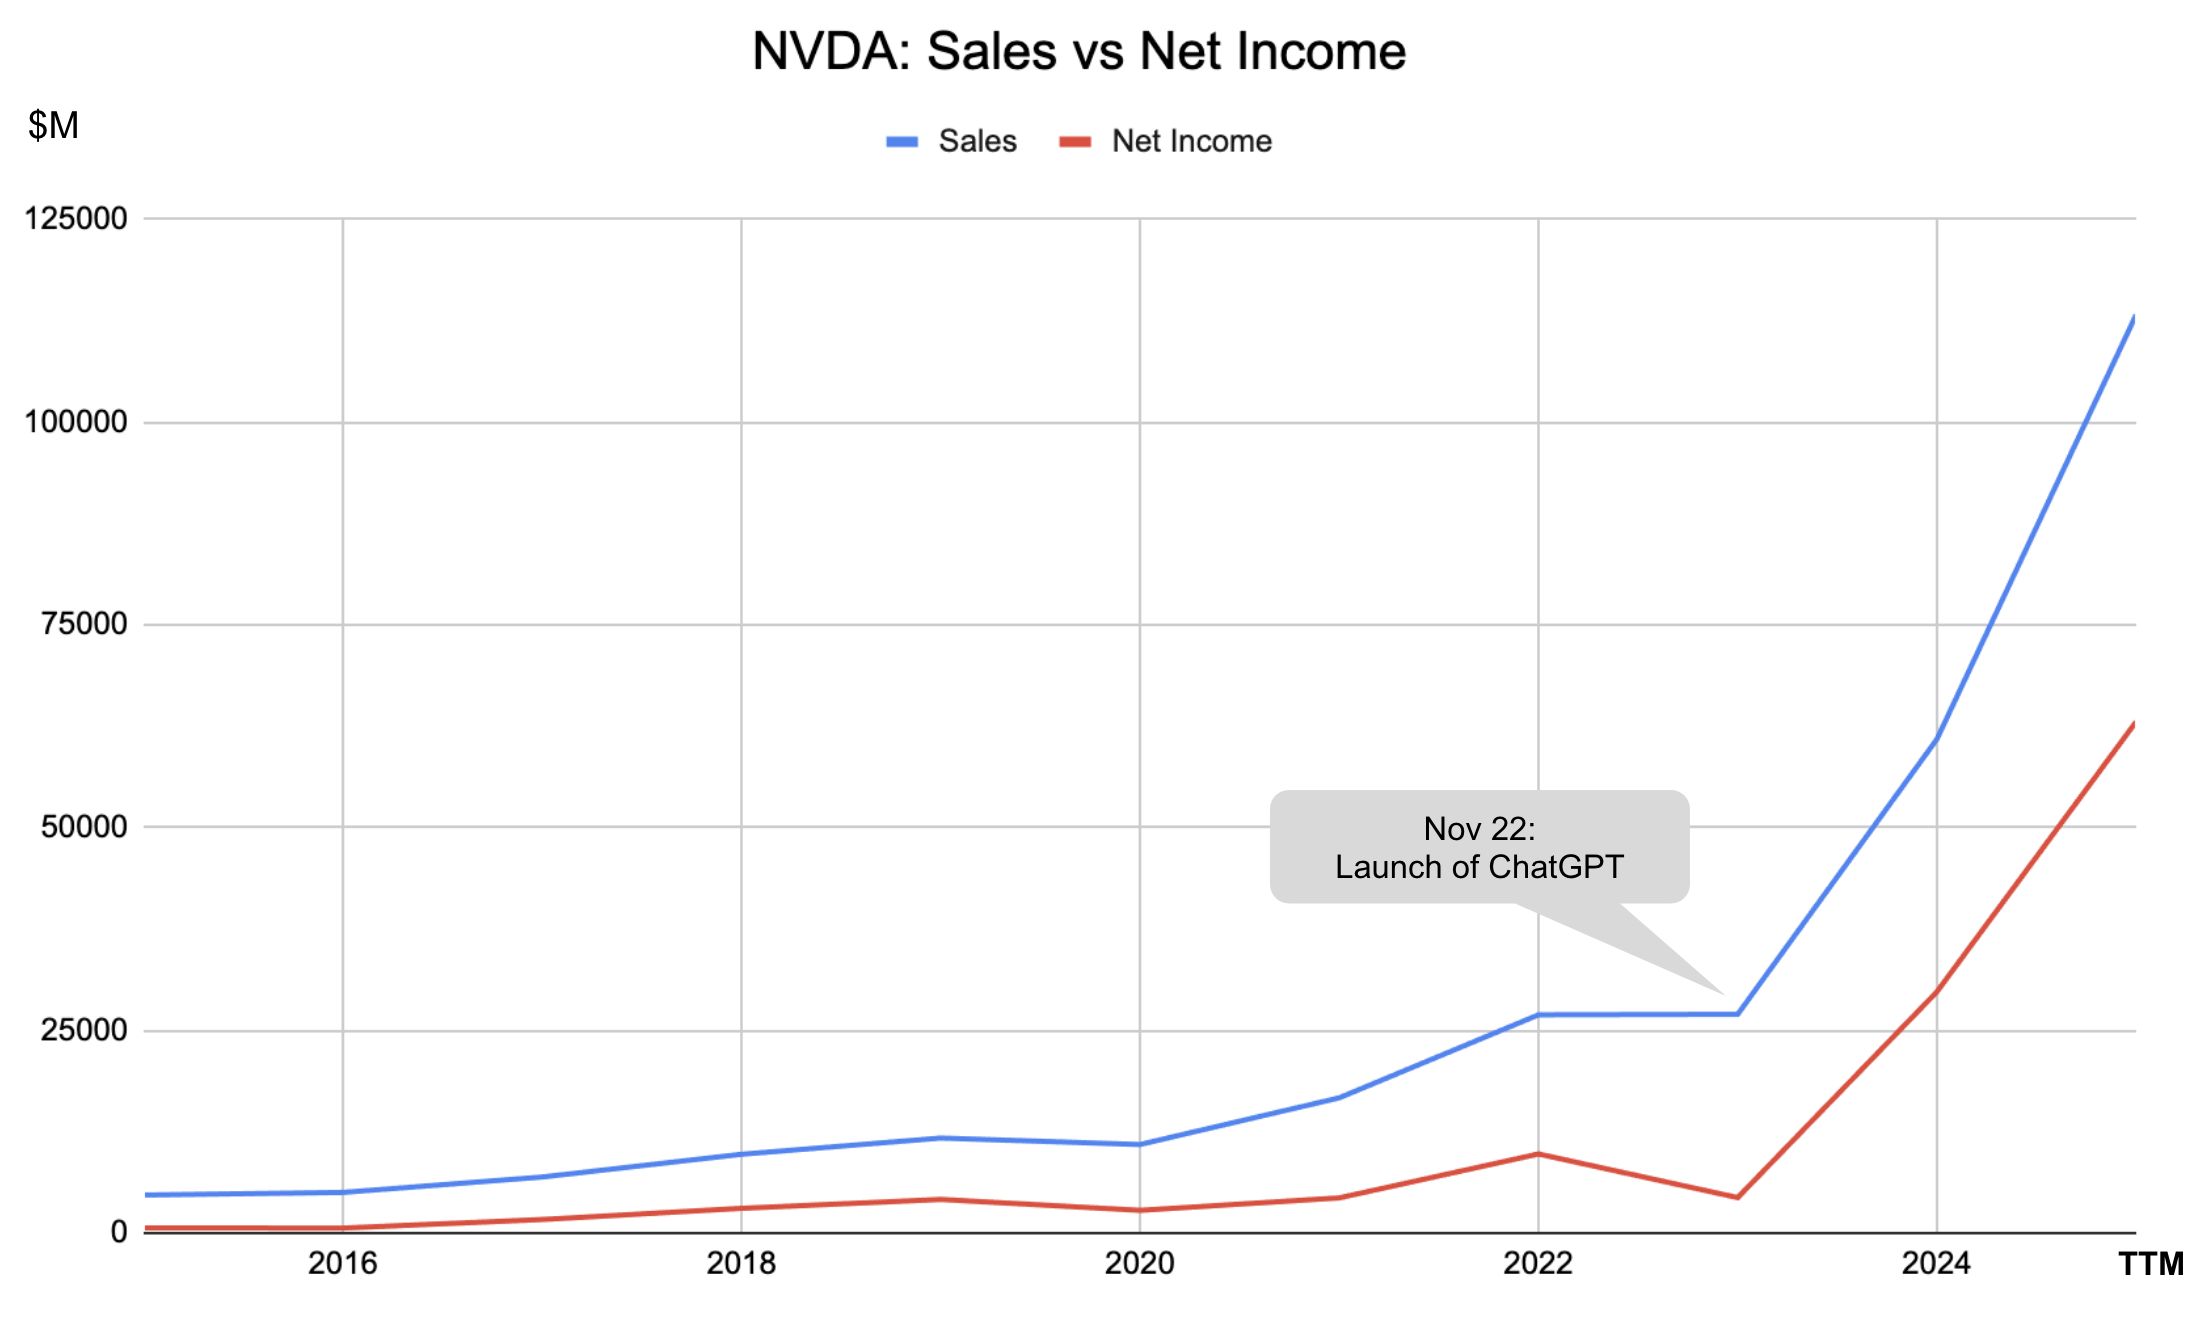
Below is their gross sales and net income over the past 10 years through the trailing twelve months (TTM)
Source: Company 10K and Personal Spreadsheets
To better demonstrate their profitability – I have plotted their revenue vs net income over this period:
Source: Company 10K and Personal Spreadsheets
So what should we pay to get a piece of this (AI) success story?
$137 or less?
Before we get to my valuation – there are 6 popular methods you could apply to value the stock.
However, for a growth company like NVDA – I believe the best approach is using a Discounted Cash Flow (DCF)
In short, a DCF model is an absolute valuation method that estimates the intrinsic value of a stock by discounting the company’s future cash flows to their present value (PV).
The model projects a company’s unlevered free cash flows (my general preference) and discounts them using an appropriate discount rate (which is highly subjective) to determine the company’s PV.
But like any model – DCF is not without its flaws…
For example, it requires making a number of assumptions when attempting to value the company. These include:
- Cash Flow Projections: Relies on accurate cash flow projections based on future performance assumptions;
- Constant Discount Rate: Assumes a relatively stable and suitable discount rate over the projection period;
- Terminal Value: Incorporates a terminal value representing cash flows beyond the explicit projection period;
- Stable Financial Leverage: Expects unchanged capital structure, ensuring consistent risk profile and discount rate throughout the projection period.
Given the nature of their business and large variability – I’m only willing to do this over 5 years (and not the typical 10-year period). Obviously the further you project with DCF – the greater the inaccuracy.
It’s hard enough to make assumptions for 5 years let alone 10!
This is the DCF formula we will use is as follows:
Intrinsic value = [FCF1 / (1+r)1] + [FCF2 / (1+r)2] + …. + [FCFn / (1+r)n] + [FCFn * (1+g) / (r – g)]
where:
- FCF = free cash flow
- r = discount rate (required rate of return)
- g = growth rate
- n = time period
Don’t be intimidated by this formula — I will break it down as we go.
There are 7 steps to completing a DCF valuation:
- Step 1: Free Cash Flow
- Step 2: Discount Rate
- Step 3: Perpetual Growth Rate
- Step 4: Terminal Value
- Step 5: Shares Outstanding
- Step 6: Discount Back and Find Intrinsic Value
- Step 7: Apply a Margin of Safety
One further optional (but recommended) step is running sensitivity analysis – where you tweak the various assumptions made (e.g., discount rate, growth rates, net margin) and the impact on its intrinsic value.
In my conclusion – I will offer a spreadsheet for you to download where you can perform sensitivity analysis by adjusting any assumptions made.
My objective with this post is to slowly work through each step – where you will get an understanding the implicit assumptions made with running a DCF.
And from there, you can adopt the model to any (growth) stock you are evaluating.
With that, let’s start with NVDA’s free cash flow (and what I believe is the truest measure of a company’s health vs its earnings)
Step 1: Free Cash Flow
The first step in a DCF valuation is to find the free cash flow (FCF) of a company.
FCF measures a company’s financial performance and shows the amount of cash a company has remaining after accounting for operating expenses and capital expenditures (CapEx).
In other words, FCF is the amount of cash flow available for discretionary spending by management and shareholders.
There are two types of FCF calculations:
- Free cash flow to the firm (FCFF): Cash flow that is available to the firm, including bond investors, if the company hypothetically has no debt. Also referred to as “unlevered free cash flow.”
- Free cash flow to equity (FCFE): The amount of cash generated by a company that is available to stock investors. Also referred to as “levered free cash flow.”
The primary difference between FCFF and FCFE are interest payments and taxes, as FCFE includes interest expense paid on debt and net debt issued or repaid.
In most DCF valuations, you’ll want to use FCFE (levered cash flow) because it provide a more accurate picture of the cash flows an equity investor can expect.
FCFE is also ideal as long as the leverage for the company you’re analyzing is fairly stable. And given NVDA has zero debt on its balance sheet – it could not be more stable.
For context, use FCFE unless the firm’s capital structure is expected to change in the near future (e.g., taking on a lot more debt).
Now many analysts choose to use the simple FCF calculation, instead of the complete FCFE calculation shown above, as it’s very difficult to predict the net borrowing a company will have in the future.
Below is the simple and most commonly used FCF formula approach:
FCF (simple) = Cash flow from operations – Capital expenditures (CapEx)
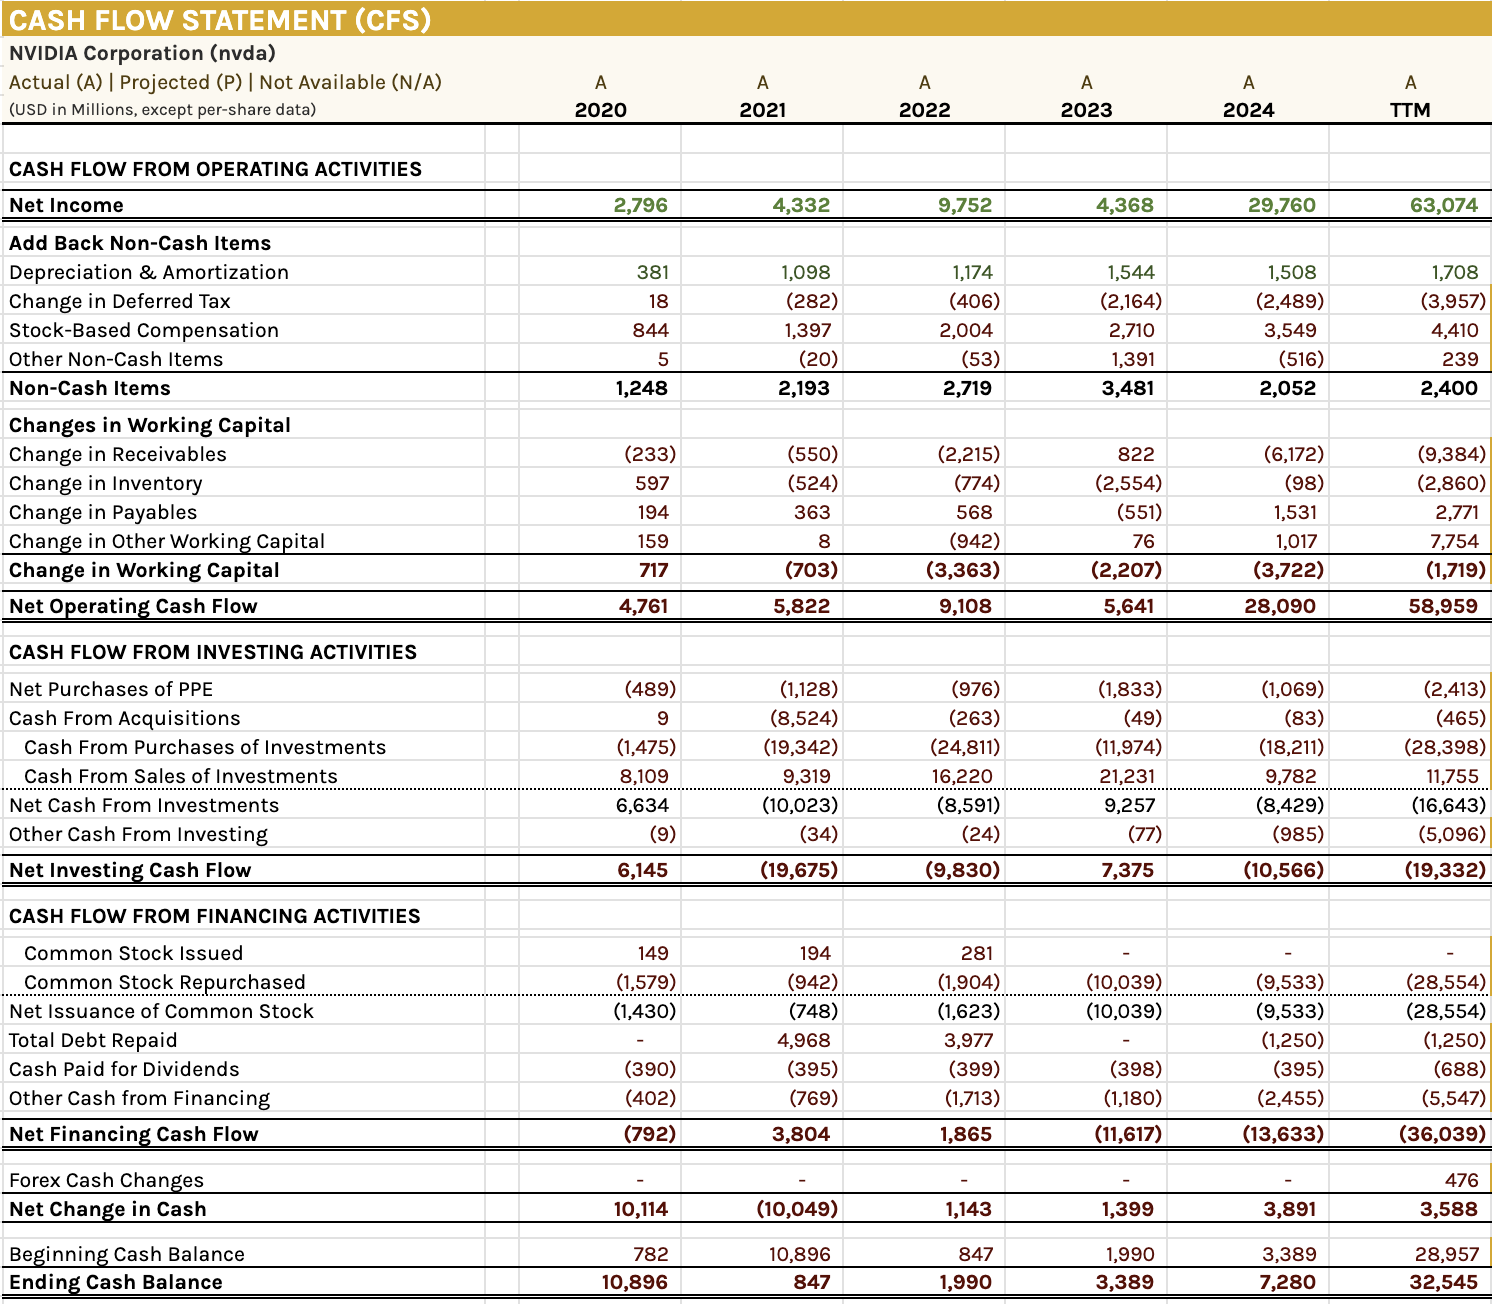
The first thing you need when analyzing FCF is cash flow from operations (aka cash from operations (CFO)), found in the cash flow statement.
Then, you would subtract total capital expenditures (CapEx), also called the plant, property and equipment (PP&E) under the investing section on the cash flow statement.
This would give you the simple FCF number (from the company 10K)
To summarize, our FCF for each year from 2021 to Trailing Twelve Months (TTM) is as follows:
This is the approach most analysts choose as it’s very hard to predict “net borrowings” in the future.
However, it’s good practice to add back any “net borrowings” or money borrowed for financing activities in a business (found under the financing activities in the cash flow statement).
This is simply the difference between the total debt issued and the total debt paid over a period.
Whilst not relevant for our NVDA DCF calculation – below is the revised FCF formula approach with net borrowings included:
FCF = (Cash flow from operations – Capital expenditures (CapEx)) + Net borrowings
Note: if you think a company has additional borrowing requirements – this will change your FCF meaningfully.
With our FCF in-hand – we’re now tasked with estimating how much this will grow over the next 5 (or 10) years.
Further to my preface – analysts believe NVDA will grow by 50%.
And I think that’s a modest assumption for the next 12 months – given NVDA’s massive lead in the (AI chip) space.
However, beyond that I would temper expectations (e.g., a figure closer to 40% or lower)
Furthermore, I’m only willing to attempt to forecast 5 years given how volatile its earnings will be.
For example, if NVDA earnings varied less than 10-15% each year; and/or there was far less competition (i.e., their moat was more secure) – I might be more comfortable expanding this to say 10 years.
However, I think the near-term will be volatile in terms of revenue and earnings (for example, I think there is a significant amount of “capex digestion” ahead in 2025 for companies who have bought these chips)
There are various ways to forecast growing FCF, but I will show a simple and effective method that works well:
FCF Rate = FCF / Net income
The closer this percentage is to 100% – the more FCF aligns with profitability.
As an aside: this is also one of the four criteria for deciding on whether a DCF can be used for a company. For e.g., in the table below, we can see that the FCF rates for NVDA over the past 5 years (to TTM) is ~92% on average.
In other words, this validates DCF is the sound approach for this company (vs other methods such as book value etc)
NVDA: FCF Rate (Source 10K and Personal Spreadsheets)
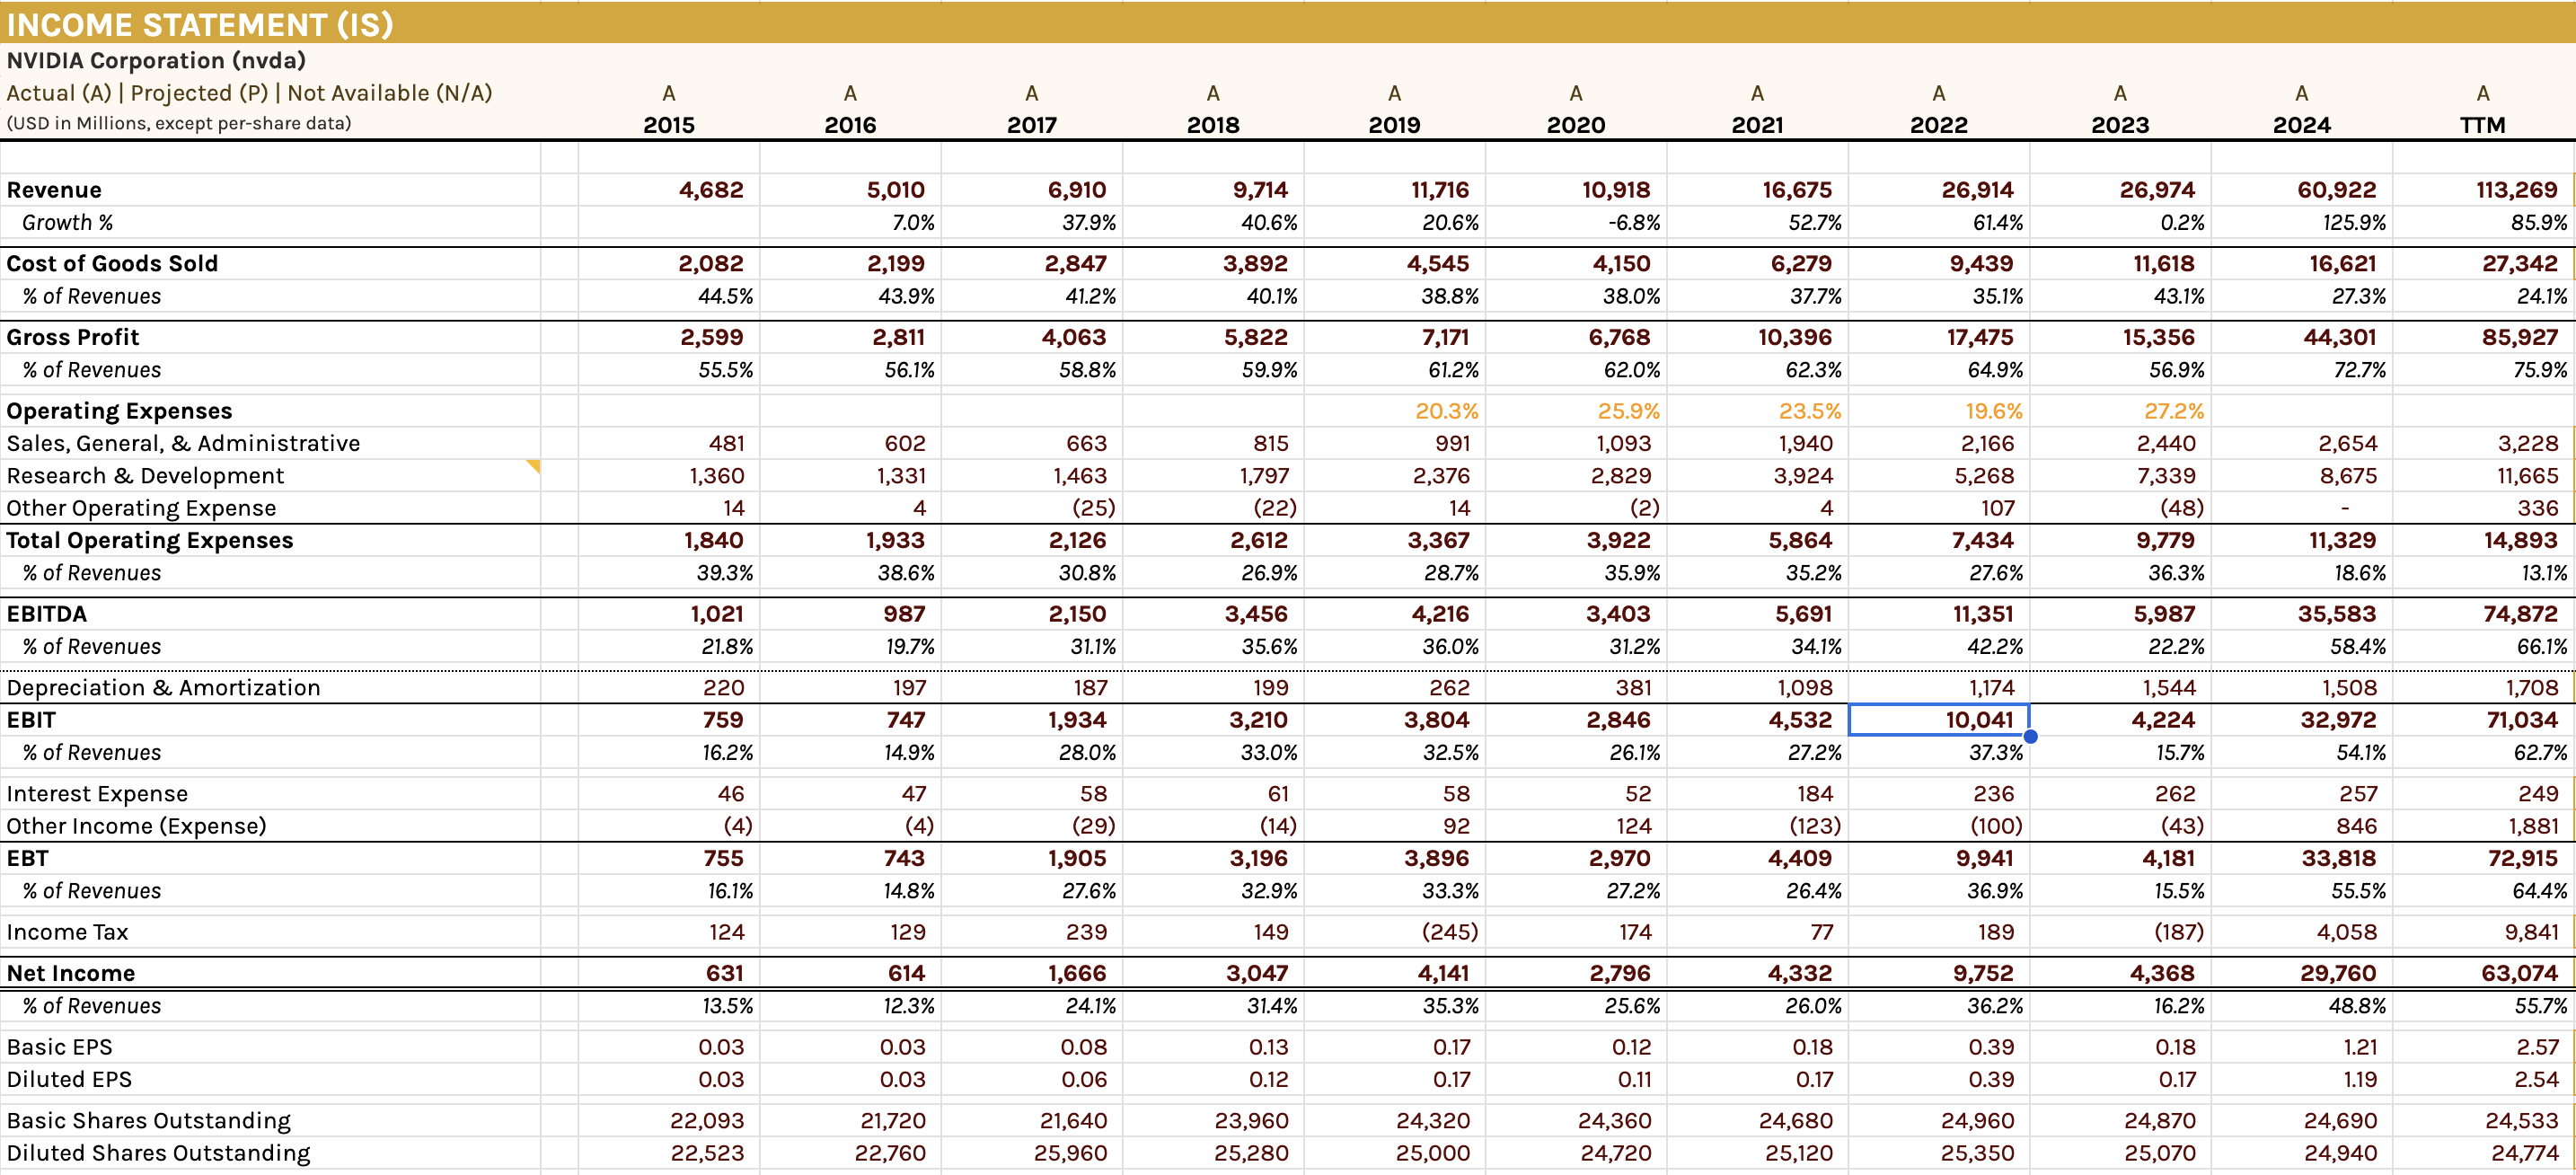
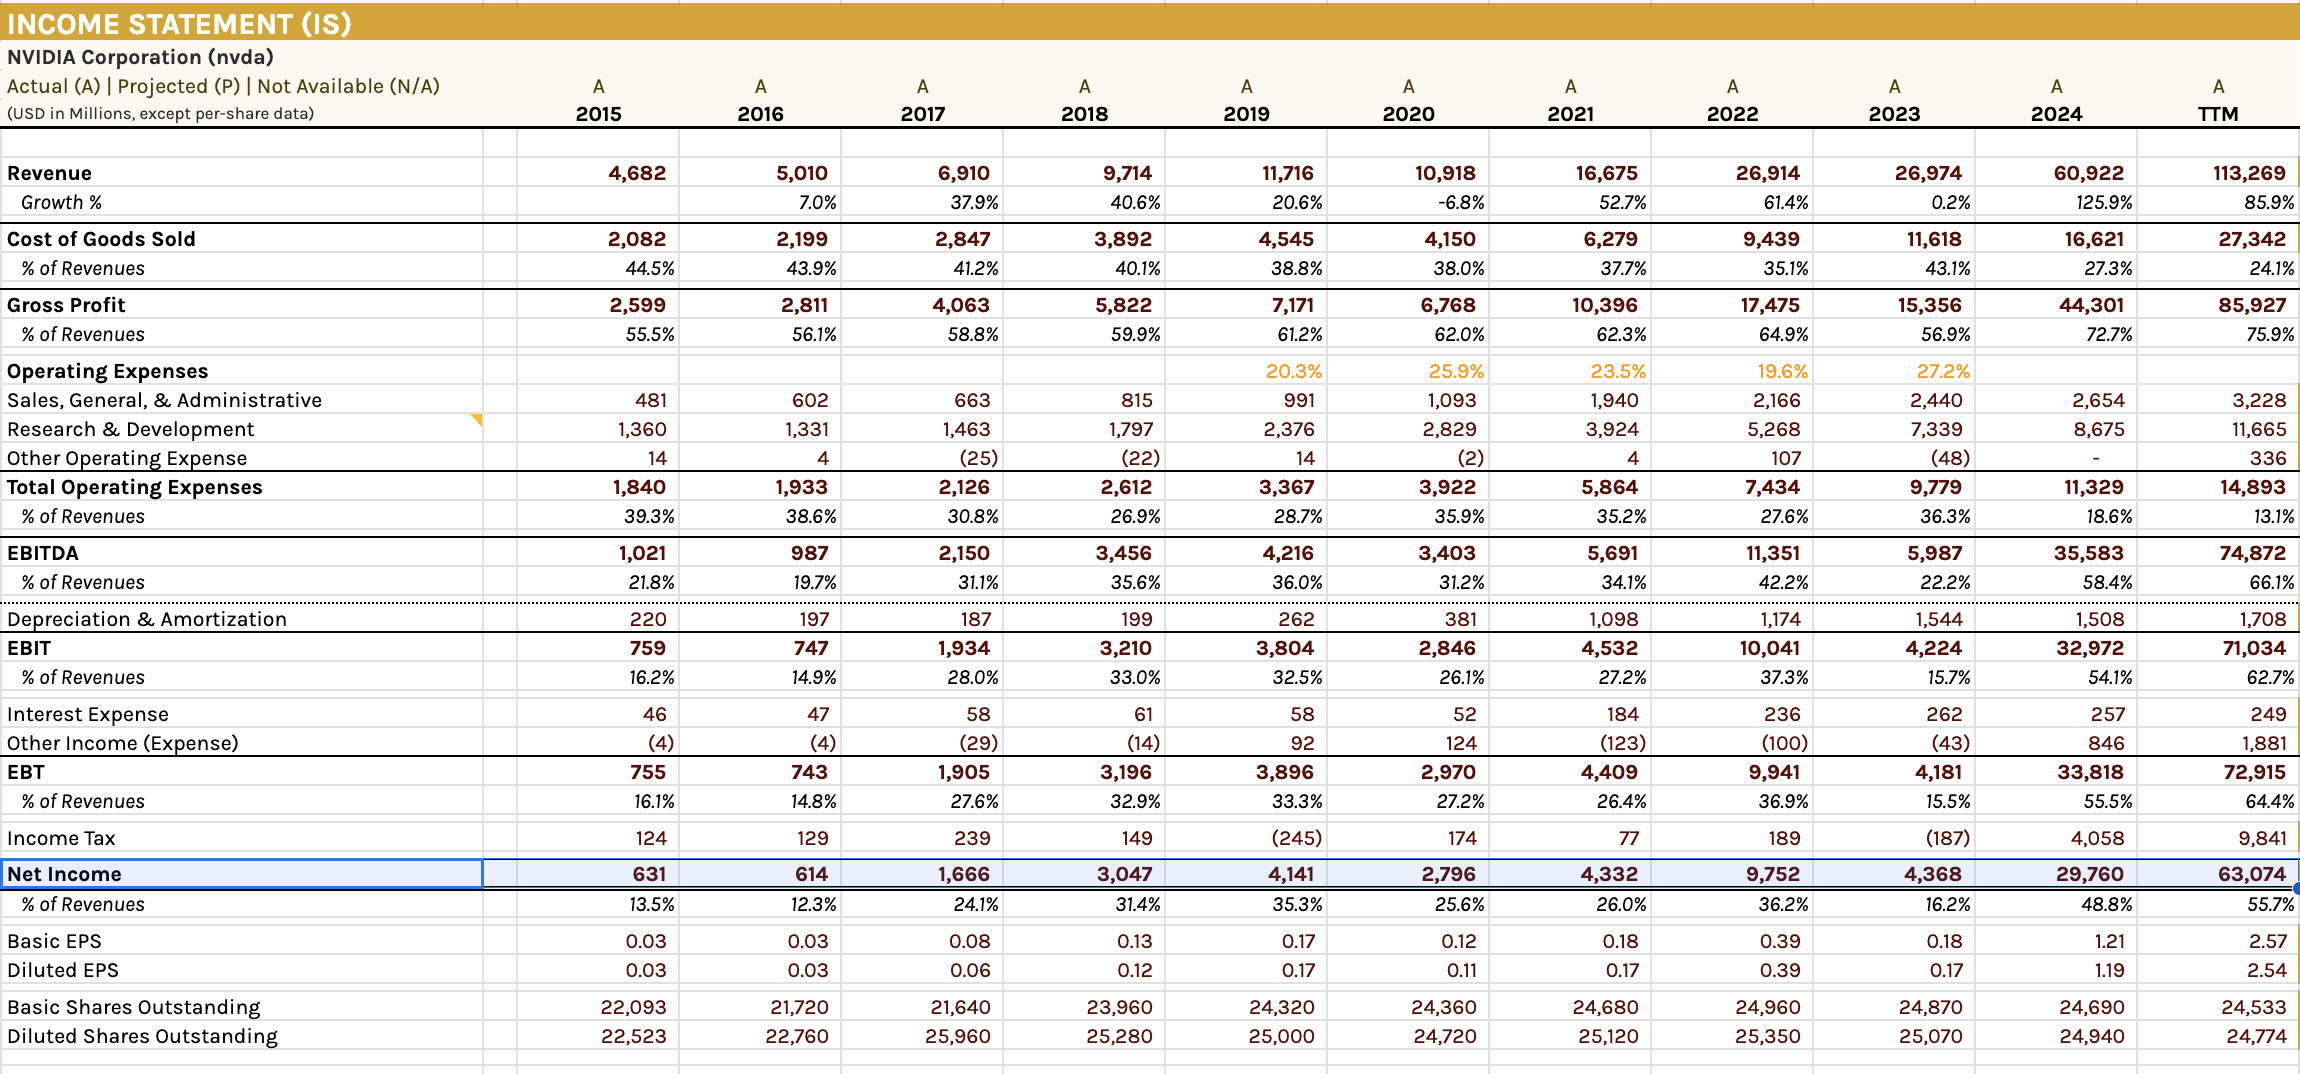
For reference – below is NVDA’s income statement (allowing us to calculate the respective percentage values)
Important note:
- The percentage you choose to use depends on your research of the company and how different you think FCF will be relative to net income over your forecast period.
For example, if you’re uncertain about a company’s future, you can use the smallest percentage (if it’s not an outlier) to be conservative. However, if you decide to use a higher percentage – then your estimates are more aggressive / higher risk.
Because I’m conservative – I’m going to use 70% as the FCF rate for my projections (a solid discount to the current TTM rate of ~90%)
But this is a good example of the discretion you have when applying the DCF model.
Remember:
- Our objective with DCF is to be approximately right; and
- Being approximately right is a lot better than being precisely wrong (i.e., paying too much!)
To that end, we always err on the side of caution.
To estimate future FCF, the method I will show you involves forecasting revenues, estimating net income, and then coming up with FCF.
For example, alternatively you could concentrate on forecast net income – and then derive FCF – however I’ll demonstrate both approaches
1. FCF Revenue Method
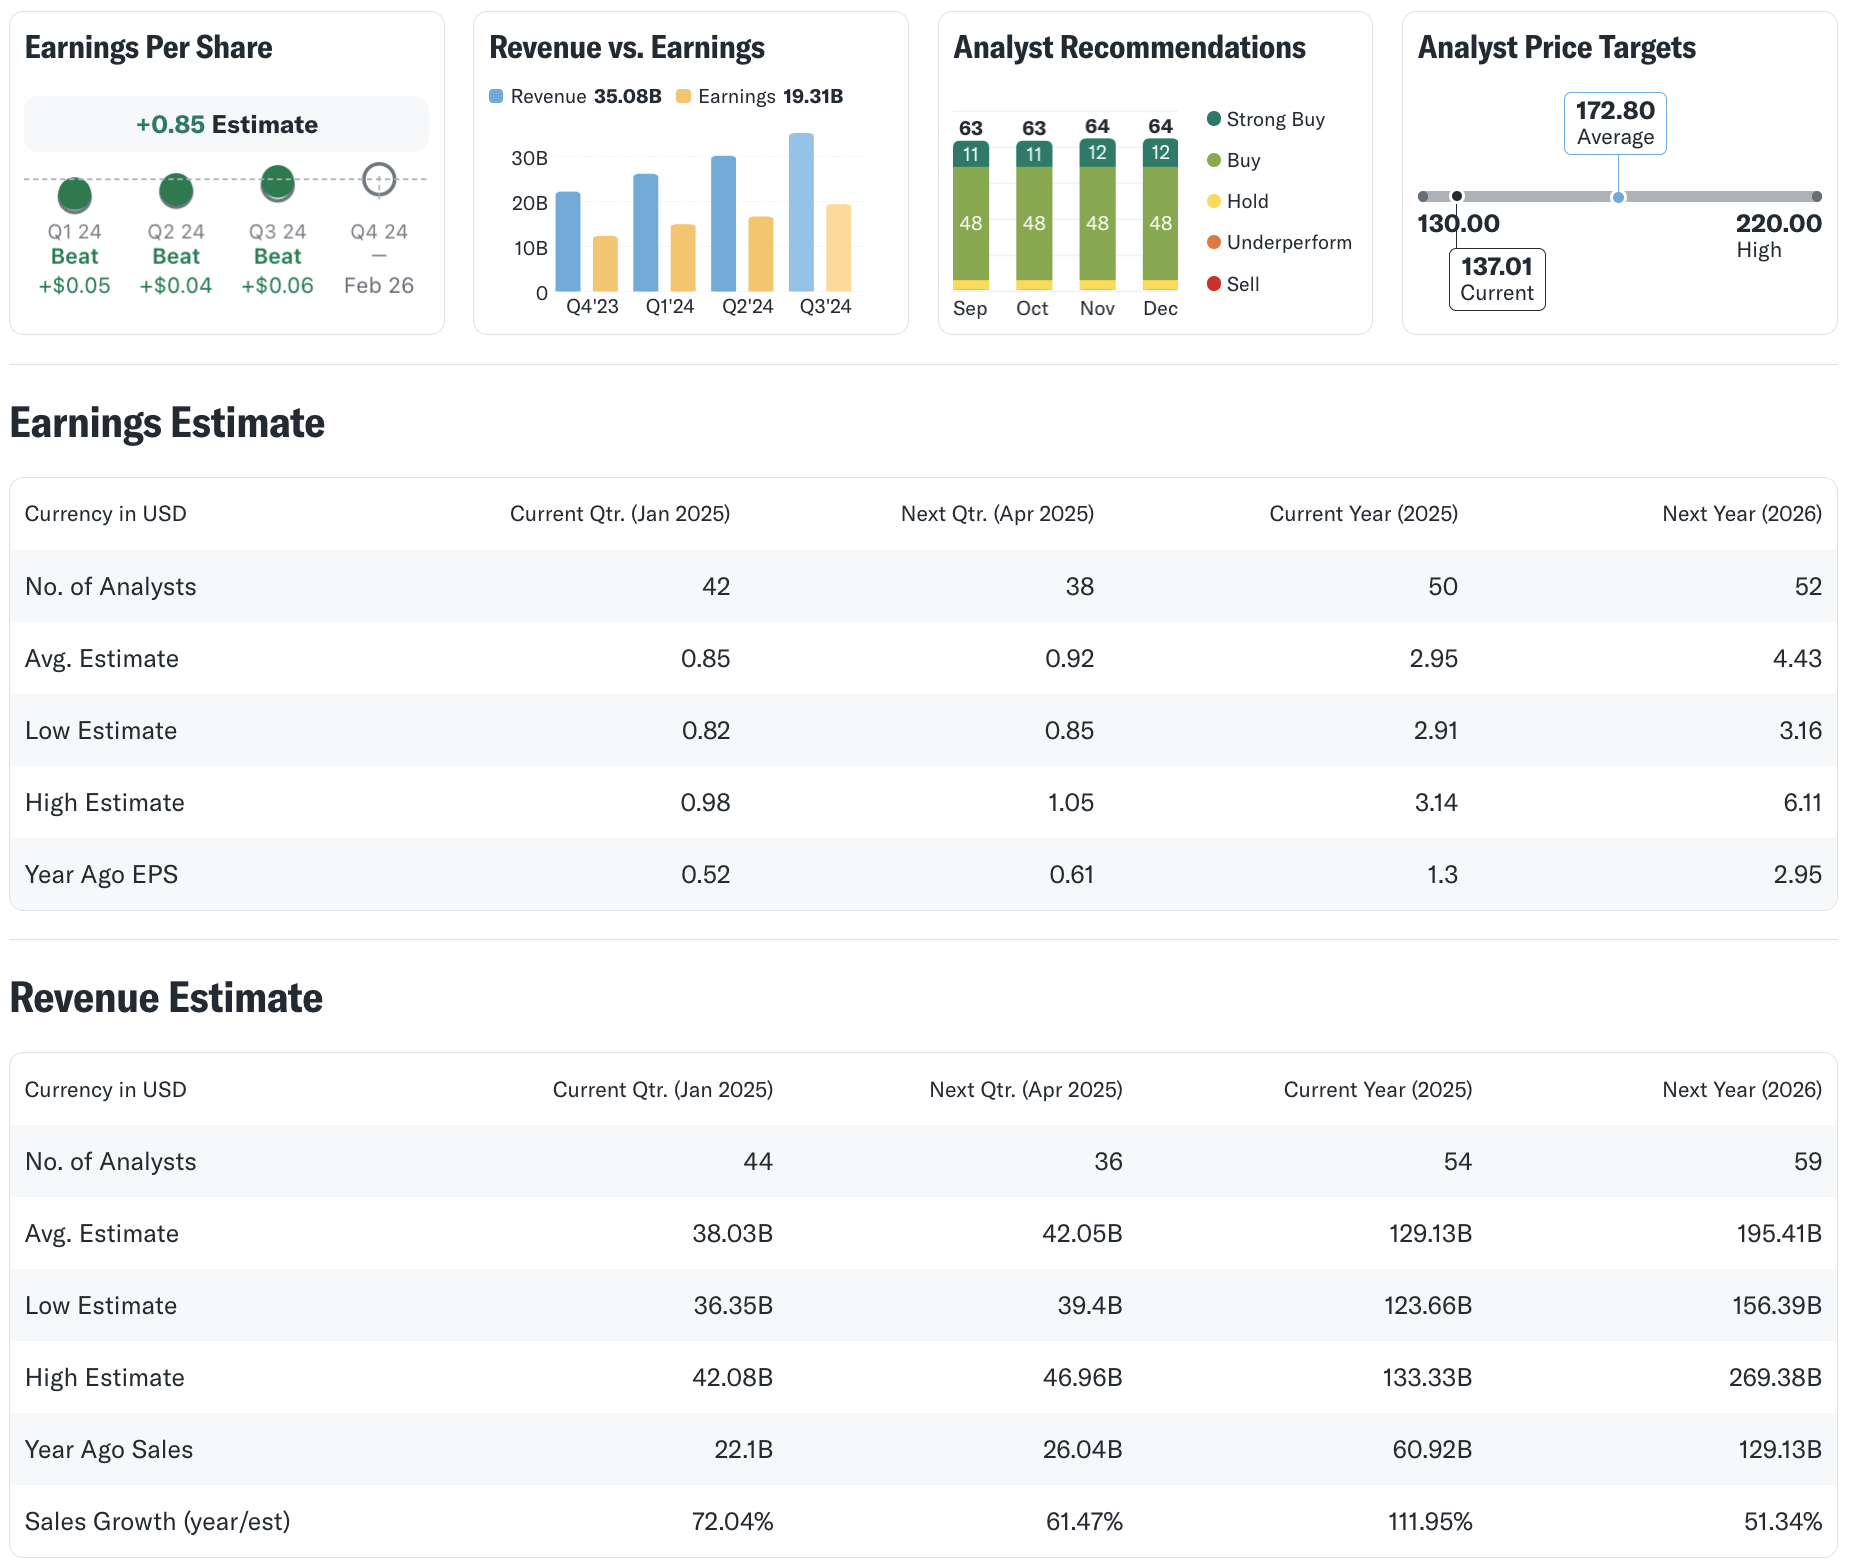
In this case, a large number of analysts cover NVDA. We can see estimates from the analyst community below (from Yahoo!Finance – under the “Analysis” tab)
As an aside, note how many analysts rate the stock as a “strong buy” or “buy” at the price of $137.
What’s more, the lowest price target on the street is $130 (vs high of $22) over the next 12 months.
We will see how this works out.
Again, our objective is not only examine the quality of the company (which we should always do) – but whether it’s being offered at a strong discount.
With respect to the estimates above – what we’re interested is the 2025 and 2026 average revenue estimates; i.e., $129.13B and $195.41B
I would not take the high or low estimate – but instead chose the mid-point.
If you’re valuing a company that does not have a revenue (or net income) estimate, or perhaps too few analysts for the estimate to be considered reliable (e.g., less than 10) – you can choose to identify a reasonable growth rate for the company instead (something you will need to do regardless)
One simple method to determine this growth rate is to find the revenue growth rate between each year (i.e., revenue growth rate = (new year – old year) / old year). You would do this for each of the five years and determine an average (and trend) — which would you apply for your DCF
Note:
- The trailing twelve month (TTM) figure includes three of the four quarters. This is expected to be between $129B to $133B (referring to our Yahoo analyst rev estimates – which would be YoY growth of ~112%).
Assuming NVDA finishes 2025 with revenue of $129B – that will represent average revenue growth of 69.4% over the past 5 years.
Question: do you think 69.4% is sustainable for the next 5 years?
I think it’s optimistic – and not what I would use as my ‘base case’.
For the purpose of my own DCF – I’m going to discount that growth rate to 40% (which is still an aggressive figure)
With this estimate – the revenue and revenue growth rates (actual (A) and projected (P)) for NVDA are shown below:

Notes:
- Highlighted in blue on the revenue line are the analyst’s average revenue forecast for the current period $129B (TTM); and 2026 at $195B;
- The assumed growth rate of 40% is applied from 2027 though 2030 – adopting the implied 51% growth rate for the 2026 year.
Now, you will need to ask yourself if 40% revenue growth can be sustained for the next years?
Or maybe you think that’s too low?
However, also bear in mind, we can apply a “margin of safety” discount to our final value (more on this in my conclusion)
Here you should do a lot of research – where your understanding of the business (and the environment for semiconductor chip demand) plays a key function.
For example, what are the risks to 40% sustained growth not materializing? What happens to our valuation should we see 30% and so on?
In any case, you can apply your own estimates (i.e., our sensitivity testing).
My goal is to put forward the model to explain where I think there is intrinsic value (and more importantly – the assumptions made in deriving that value)
Armed with our (bold) revenue projections – we now need to estimate net income.
One method is to find “net income (profit) margin” (aka net margin) – which determines the proportional profitability of a business, expressed as a percentage of revenues
Net income margin = Net income / Revenue
Net income and revenue are found on the income statement (shared earlier). Below is a summary:
Similar to what we did for revenue – we apply the same method for Net Income Margin.
For example, an average of the last 5 years (including TTM) is 36.6% (vs the current year of almost 56%)
I am going to use a safer figure of 35% (still very strong) – inline with the 5- year average.
Again, this is at your discretion.
This can be used over the forecast growth period (5-years) to come up with future net income (by multiplying it to the projected revenue numbers), as shown below (actual (A) and projected (P)):
Again, the TTM and 2026 revenue projections are from the average analyst’s projections.
For Net Income Margin – I have applied the figure for 35% from 2026 through to 2030.
Next, we take our FCF rate (again, I chose 70%) and multiply this by net income to get projected / forecast FCF through to 2030.
Notes:
- For the 2025(P) we will apply the 89.7% FCF Rate we have for TTM
- An alternative estimate is Buffett’s “owner’s earnings“. Although this calculation is nearly the same as the simple FCF calculation, it’s more involved. However, it may be more accurate.
Step 2: Discount Rate
The next step is to calculate the discount rate (aka the required rate of return).
The required rate of return is the minimum return an investor will accept for owning stock in a company, accounting for the risk of holding the stock.
Because we’re using FCF, our discount rate should be based on our individual perspectives as an investor.
For example, my minimum return required for NVDA is 10%.
I chose this as this is the expected return from owning the S&P 500 Index over the long-term. If I cannot achieve at least 10% – why take the risk of owning the stock?
Important note:
- The rate you choose will be a function of your risk tolerance (n.b., use a higher discount rate if you prefer lower risk), investment goals (as I outlined above), time horizon, and available capital, among other things.
If you don’t have a preferred discount rate (e.g., 10% is commonly adopted) – then you can use the “weighted average cost of capital” (WACC) — which is essentially a default required rate of return.
If you are going to use WACC – it relies on an asset-pricing model called the “capital asset pricing model” (CAPM) – which comes with a number of assumptions.
The main issue with this model for valuation, is that it assumes investors act rationally on the latest available public data and that markets are efficient, which is obviously not true in the stock market.
Therefore, to use the asset-pricing model in this regard may lead to misleading figures in your valuation.
For example, the current WACC for NVDA is 18.66% — where the average for the past 5 years (including TTM) is ~15%
However, WACC is still the next-best alternative if you do not have a personal required rate of return. My recommendation is use a figure around 10% (but not less than)
See more from Investopedia if you want to calculate the WACC for any stock.
As an aside, I maintain a spreadsheet of the WACC and 5-year average ROICs for all 500 S&P 500 companies (where I filter for strong, consistent (average) economic profit margin.
Step 3: Perpetual Growth Rate
The perpetual, or constant growth rate, is the growth rate that free cash flow (FCF) is going to grow into perpetuity.
Now a conservative range is in-line with the expected growth of the U.S. economy, the inflation rate, or long-term GDP growth.
Therefore, a number around 3.0% is reasonable. However, I would be reluctant to go higher. A figure of 2.5% is more conservative and will result in a lower valuation.
Note: the perpetual growth rate assumed (“g”) needs to be smaller than your discount rate (“r”). We satisfy this requirement with our perpetual rate of 3.0% and a discount rate of 10%
We will use this growth rate in perpetuity when solving for terminal value.
Step 4: Terminal Rate
Terminal value (TV) is the value of a business beyond the forecast growth period for when future cash flows can be reasonably estimated.
By finding the terminal value, investors can estimate what the cash flows will be after the forecast growth period (i.e., 5 years).
Here is how we calculate TV:
Terminal Value (TV ) = FCF * (1 + g) / (r – g)
Where:
- TV = terminal value
- FCF = free cash flow
- r = discount rate (required rate of return; e.g., I will use 10%)
- g = perpetual growth rate (e.g., I will adopt 3.0%)
Here we take the last forecast time period, in our case time “period 5“, and you’d grow this (FCF5) one year by your perpetual growth rate we established earlier. This would give you the free cash flow for time “period 6“.
From there, we divide this figure by our required rate of return (e.g., 10% or WACC) minus the perpetual growth rate (3.0%); i.e.
TV = $183,918B * (1 + 3.0%) / (10% – 3.0%) = $2,706,227B
You can read more on determining terminal value here.
Step 5: Shares Outstanding
The next step is to find the number of shares outstanding for the company, which is the amount of company stock held by all shareholders, including insiders and institutional investors.
Yahoo!Finance Statistics page tells us there are 24,490M shares outstanding for NVDA.
To find a more exact figure, you can look at the company’s most recent 10-K annual report or 10-Q quarterly report to find the number of shares outstanding.
Step 6: Calculate the Intrinsic Value
Perhaps the most important steps in a DCF model is to account for the time value of money (TVM)
TVM states that a dollar today is worth more than a dollar in the future due to its potential earning capacity.
To understand this more – I highly recommend reading Kahneman and Tversky’s “Prospect Theory”
Based on this fundamental law – you must discount any cash you forecast/project into the future to estimate the present value worth, which you can then use in a DCF calculation.
This would be done by using the approach below:
PV of FCF = FCF / (1 + r)n
Where:
- PV = present value
- FCF = free cash flow (forecast only)
- r = discount rate (required rate of return)
- n = time period
We begin by finding the discount factor (the denominator) for each period, including the terminal value figure just calculated.
For example, for the forecast FCF3 (2027 in our case) – we would apply (1 + 10%)3 – giving the discount factor for 2027 of 1.21 (full calculations below)
From there, we take the forecastFCF3 in step 1, and divide by this discount factor to solve for the present value of the free cash flow figureFCF3 for the forecast year of 2027.
Because we’re using a 5-year forecast period – we do this six times. However, given the sixth time is our terminal value – we use a 5-year time period instead (n).
After this is complete, we sum all PV of FCF figures to come up with today’s current equity value. This gives us a figure of $2,053,697B
Finally, we divide the equity value by the total shares outstanding (24,490) to get the intrinsic stock value.
Based on this, we can estimate the intrinsic value for NVDA is around $83.86 per share
Again this assumes:
- 40% revenue growth beyond 2025
- 35% net income margins beyond 2025
- A required discount rate of 10% (matching the Index average long-term return); and
- A perpetual growth rate of 3.0%
DCF models are highly sensitive to these inputs.
But there’s one final step…
Step 7: Apply a Margin of Safety
Based on the above, I calculate the intrinsic value for NVDA to be $83.86
However, that’s 38% below the current asking price of $137.
We know the stock trades at 32x forward earnings – where earnings are expected to be $4.28 per share.
Now, assuming a price of say $83.86 – that’s a forward PE of ~20x
And whilst I treat PE’s as not much more than “back of the napkin” estimates – a 20x PE for NVDA is conservative given its expected rates of growth (and market position).
Now if Ben Graham was running this analysis – he would take the intrinsic value and apply a discount factor. For example, these forecast are highly uncertain.
But what we have done is “stress test” the assumptions in the asking price of $137. We are no longer blind to the risks.
- 10% discount would be $75.47 (i.e., the strike price I chose for my short put trade earlier this year)
- 20% discount would be $67.09; and
- 30% discount would be $58.70
This is Graham’s margin of safety concept (see this post for 8 case studies).
Given this – I would be confident adding NVDA anywhere ~$80 per share.
Now I can’t tell you if that opportunity will present itself.
It may not.
However, I’m only interested in buying stocks at very attractive valuations.
I’m more than happy to let it go — especially when I’ve built in some aggressive growth estimates (e.g., 40% revenue growth for 5 years).
And whilst sales growth represents a slow down from the 51% expected next year – I expect the competition for AI chips to only increase in the years ahead (where margins will likely fall).
If nothing else – extremely high margin business (such as AI chips) are honey pots. They will attract competition from far and wide until those margins are eradicated.
Putting it All Together
Tech stocks (like NVDA) are not cheap heading into 2025.
But if you listen to most talking heads on CNBC or Bloomberg – you will often hear “buy the dip at $140″.
However, on what basis is it cheap?
We have proven that it’s not cheap based on a reasonable DCF calculation.
From my lens, unless you take the time to do the work – you have no way of knowing what “value” is.
You are trusting some bozo on TV who is paid to always say “buy”.
The work required isn’t hard…
It’s math that any Year 8 student could do.
It’s more about taking the time to review the balance sheet, income statement and cash flow statement (and any footnotes in the 10K)
I would encourage you to do this kind of valuation for any growth stock trading at a lofty multiple – where you can determine what represents value.
And whilst this exercise is not meant to be precise – it should at least sanity check what the market is asking for the stock. From there, you can dimension your own risk.
One last thing…
If NVDA misses on its sales or earnings guidance next year – watch it drop like a rock. For example, at ~$140 per share – the market assumes:
- 55% revenue growth for 5-years post 2025; and
- 40% net income margins for 5-years post 2025
Which also assumes a discount rate of 10%; and a perpetual rate of 3.0%.
Yes, it could achieve (or even exceed) those figures.
But they are aggressive.
40% sales growth for 5-years after 2025 at NVDA’s scale would be incredible.
What’s more, the stock could experience multiple expansion (e.g., rising to 40x forward earnings if growth continues)
Before I go – here’s a link to download the complete .xls for NVDA.
You can tweak the 4 key assumptions as needed (i.e., apply your own sensitivity analysis).
The spreadsheet will automatically update the intrinsic value per share as you adjust the input assumptions (e.g., 50% revenue growth vs 40% growth etc etc).
The next time someone says to you “Nvidia is a great buy at $140 – now you can ask them why”

