- Are we set up to echo the ‘melt up’ of the mid-to-late 90’s?
- S&P 500 could be emboldened by a much easier Fed
- Ensure you don’t get caught paying too much for stocks
Are stocks headed for a melt-up with the Fed set to ease rates over the next 12+ months?
Things could be trending that way – as stocks continue to print new highs as the ‘soft landing’ script firms.
And whilst there might be further upside – the environment echoes a lot of what we experienced from the mid 1990’s.
For example, at the time we had expanding growth, low inflation with aggressive easing from the Fed.
What’s more, investors were very bullish on the promise of the internet – set to deliver powerful productivity gains.
Stock multiples continued to expand as the S&P 500 delivered strong double-digit gains not seen in decades.
Today conditions feel similar.
The Fed has chosen to aggressively start easing rates to ensure the labor market remains stable.
But will that decision come at the (ultimate) expense of a longer-term bubble?
It’s still too early to say – however it’s possible.
Let’s see if we can draw any parallels.
A Look at the Mid-to-Late 1990s
The mid-to-late 1990s was a great time to be an investor.
For me, it was when I ‘cut my teeth’ on trading as someone in their mid-20’s.
Initially, it felt like an easy game. Stocks only seemed to go up (and fast!)
The term “bear market” was not yet in my vernacular.
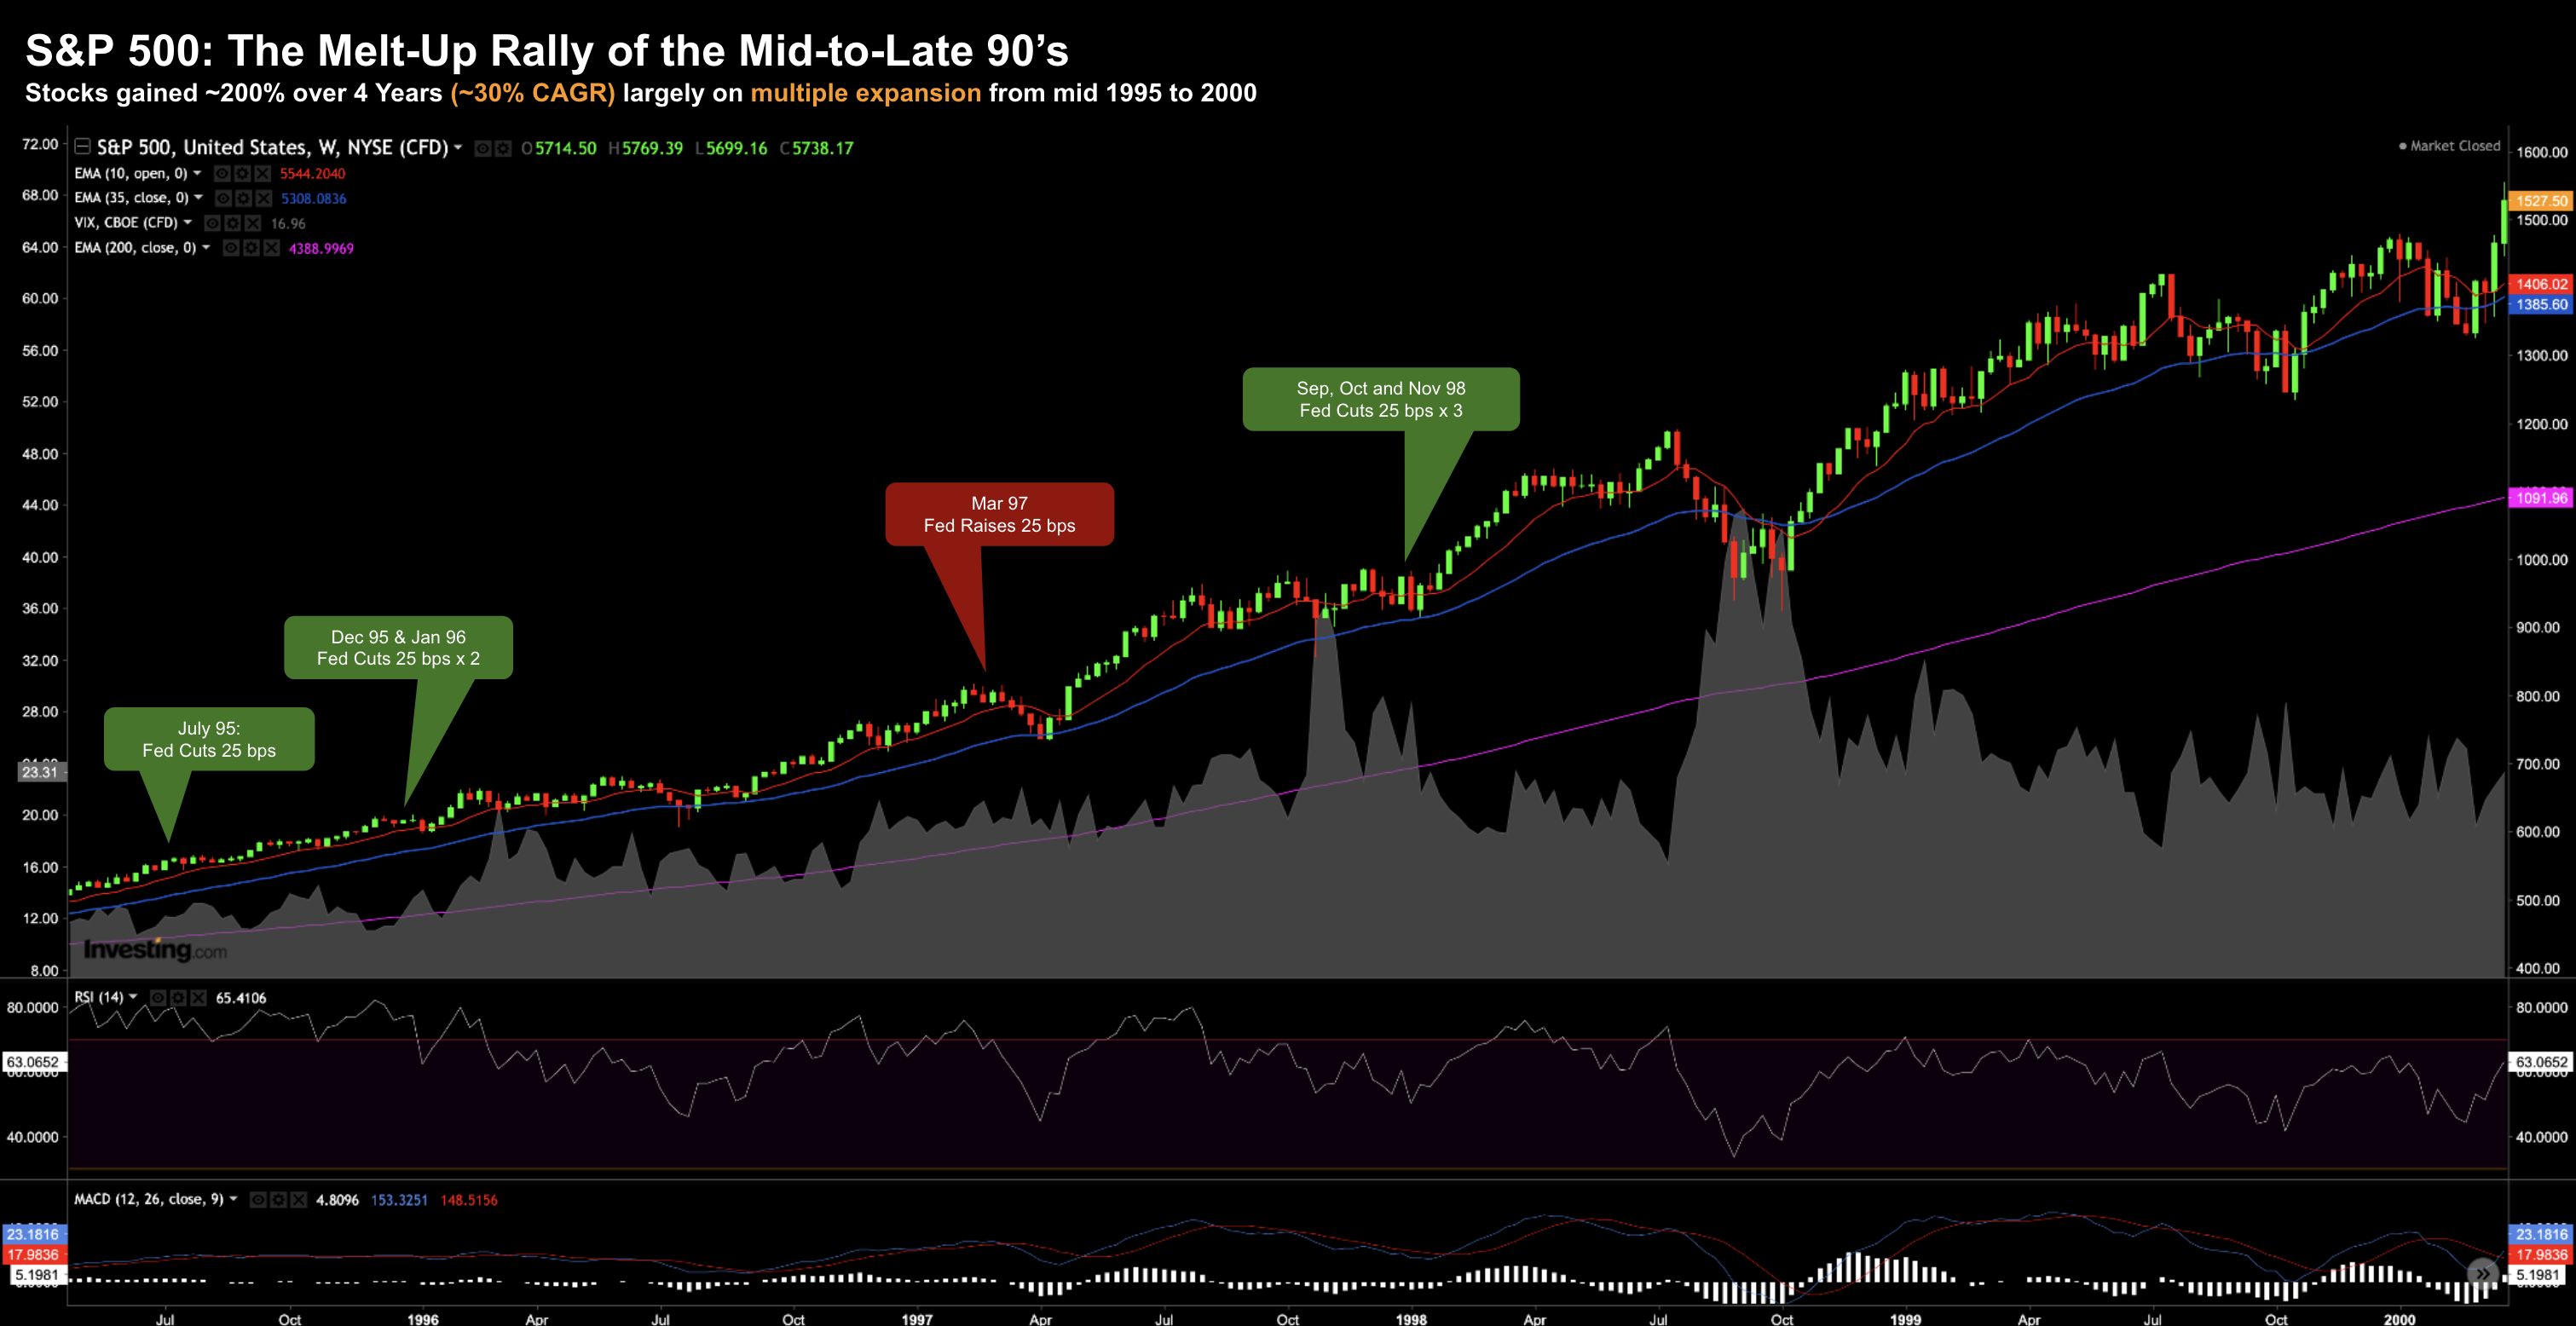
For the ~4 years after 1995 – the S&P 500’s CAGR was around 30% (excluding dividends).
For anyone familiar with the concept of mean reversion (I wasn’t at the time) – it was unsustainable.
The 100-year average is ~7.5% for the S&P 500 plus dividends (a total return of around 10.6%).
What could possibly go wrong?
Economic growth continued at a solid clip – with the Fed happy to fuel the rally with further rate cuts.
Let’s look at some charts – starting with the S&P 500 and reactions to Fed policy.
The near 200% ~4-year rally from 1995 was basically a straight line higher.
Over this period – there were two small pullbacks:
- ~12% decline when the Fed raised rates 25 bps in early 1997; and
- ~22% decline – where the Russian government was forced to devalue their currency and default on their debt.
At the time, the so-called ‘smartest guys in the room’ – hedge fund Long-Term Capital Management blew up – and markets everywhere were affected.
However, the pain was short lived.
During this 4-year period we saw 6 rate cuts of 25 bps with only one rate rise.
Stocks responded favourably – as the Fed eased during a period of moderate to strong economic growth.
For example, below is what we saw with YoY nominal quarterly GDP at the time:
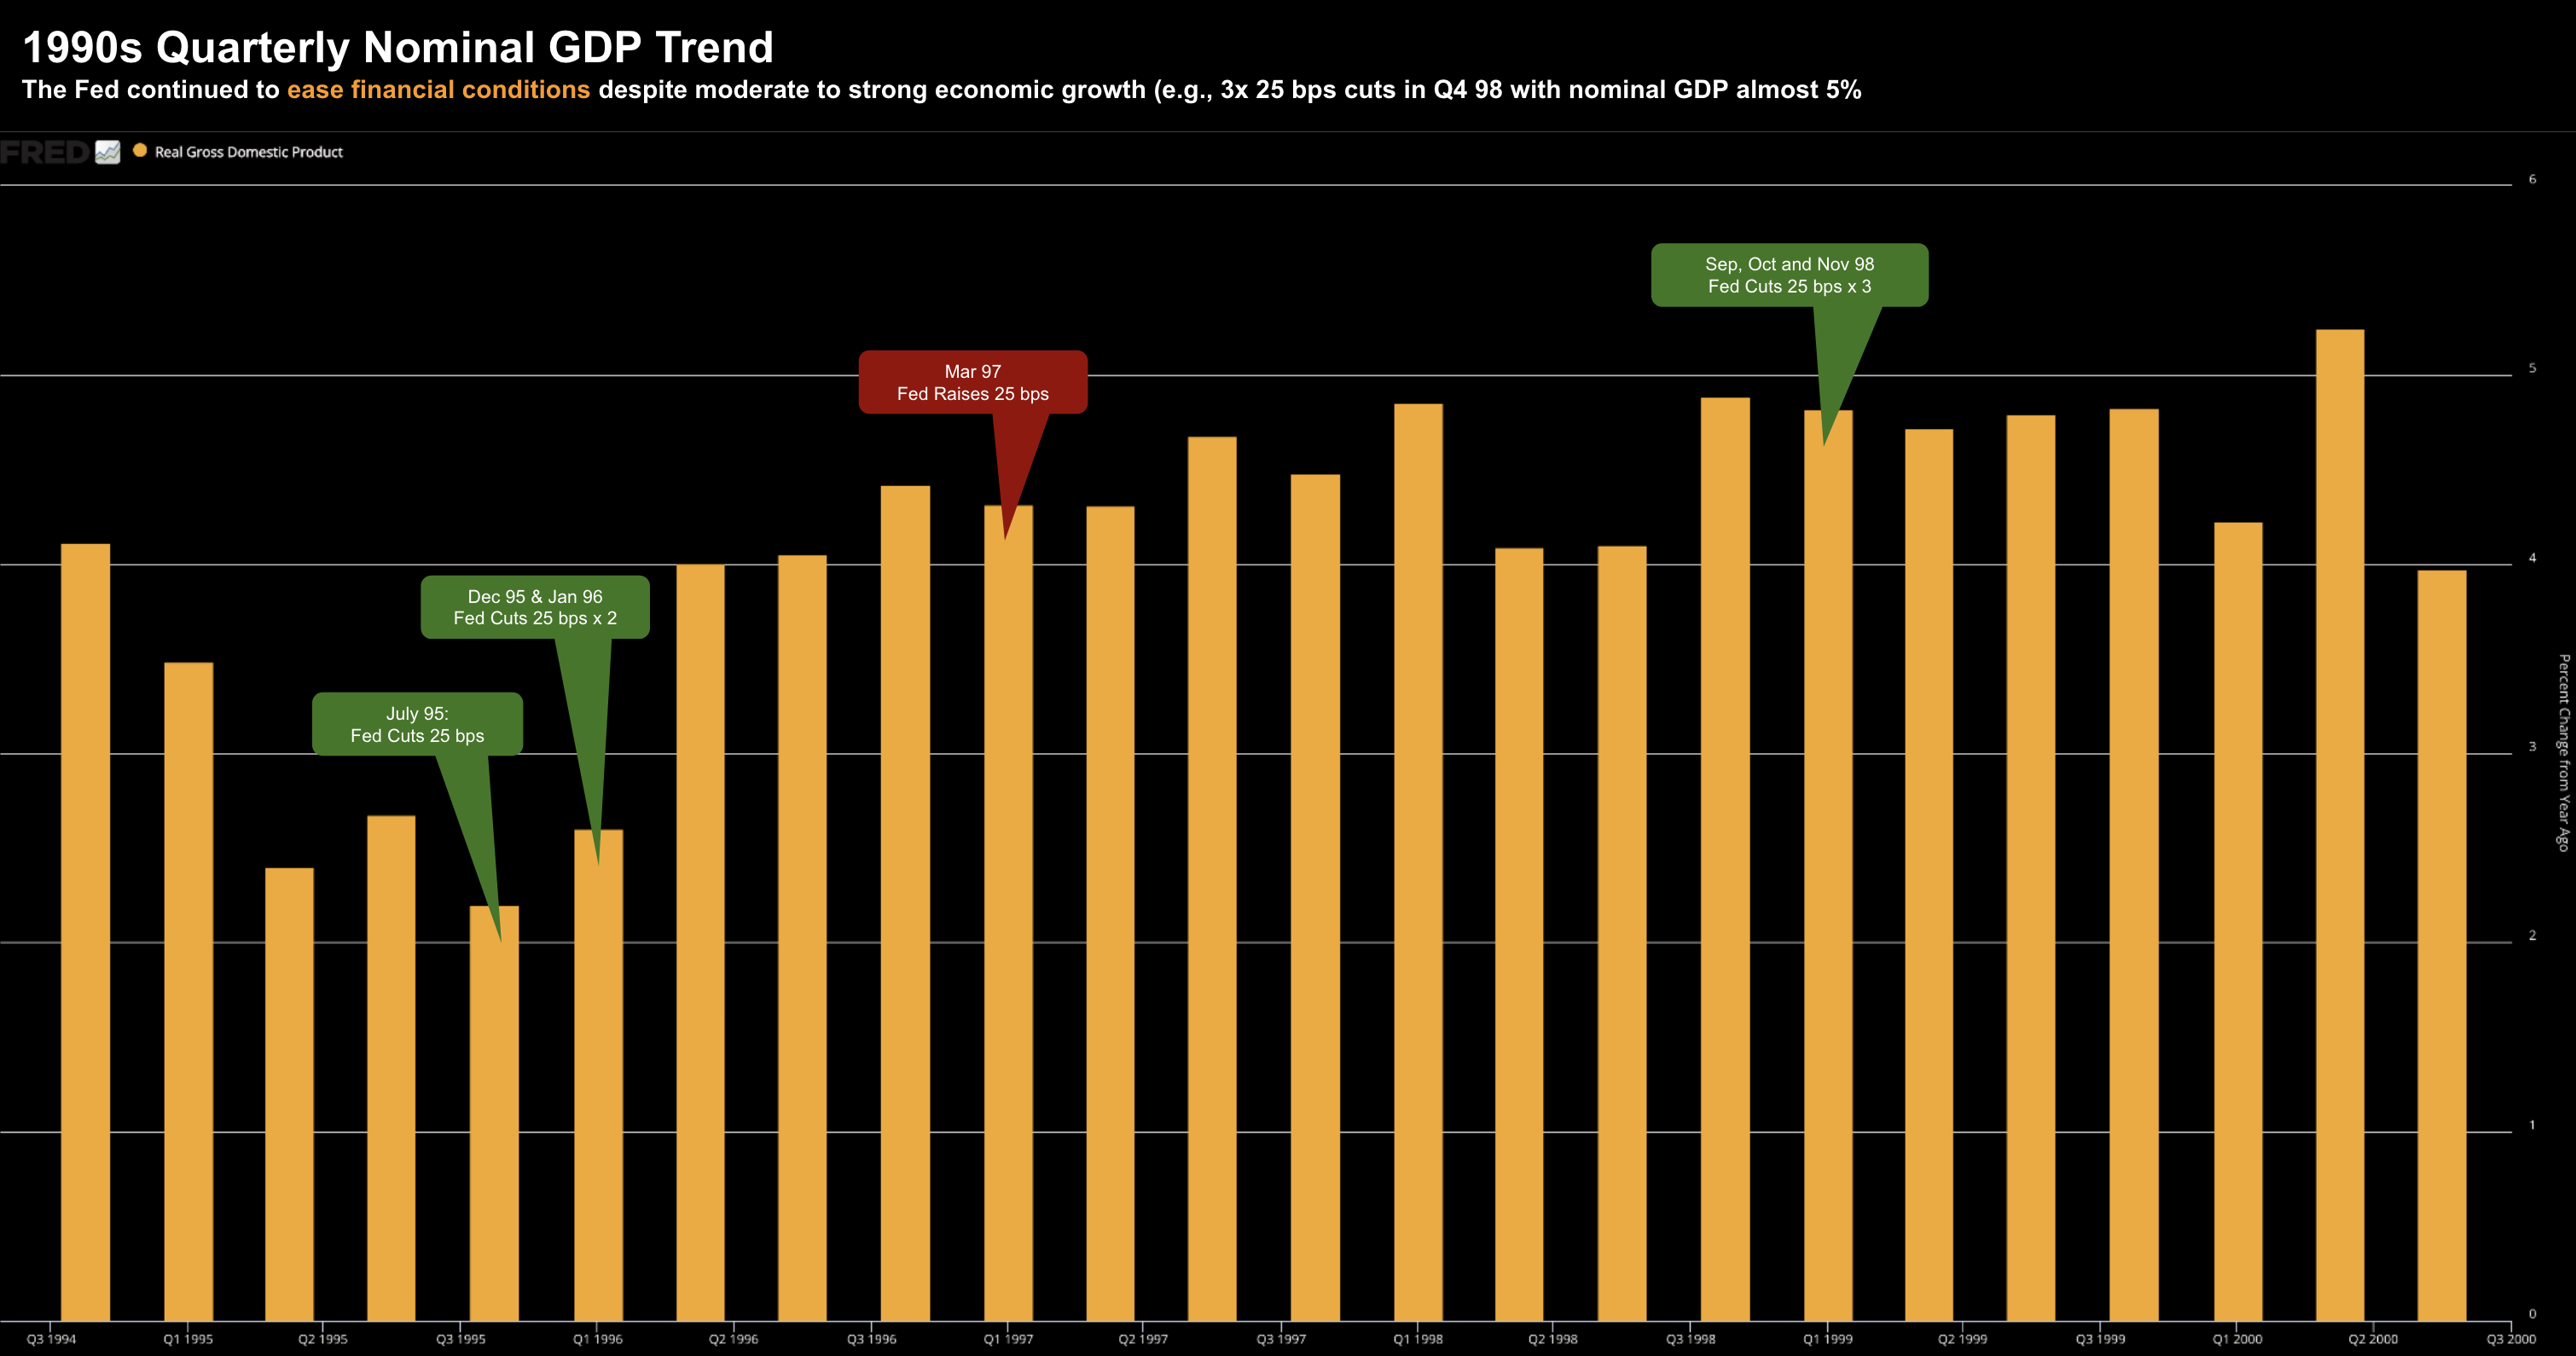
As an aside, the three consecutive rate cuts of 25 bps late 1998 were curious given what we saw with economic growth.
Accompanying the rate cuts of Q4 1998 – the Fed announced that “… action was taken to cushion the effects on prospective economic growth in the U.S. of increasing weakness in foreign economies and of less accommodative financial conditions domestically.”
Markets took their cues – fueled by what they saw with internet based stocks.
We all know what happened next…
Could We See Something Similar?
For me, it was a good lesson in topics such as (not limited to):
- capital allocation and position sizing;
- risk management;
- valuation metrics; and
- mean reversion
The tech crash of 2000 was a great lesson for me on all the things not to do!
The gains which were almost effortless for ~4 years were promptly returned in the space of ~12 months.
For those less familiar, a market melt up refers to a sharp and unsustainable rise in asset prices driven more by a surge in investor sentiment than by improving fundamentals.
In other words, investors become detached from fundamentals and are prepared to pay any price.
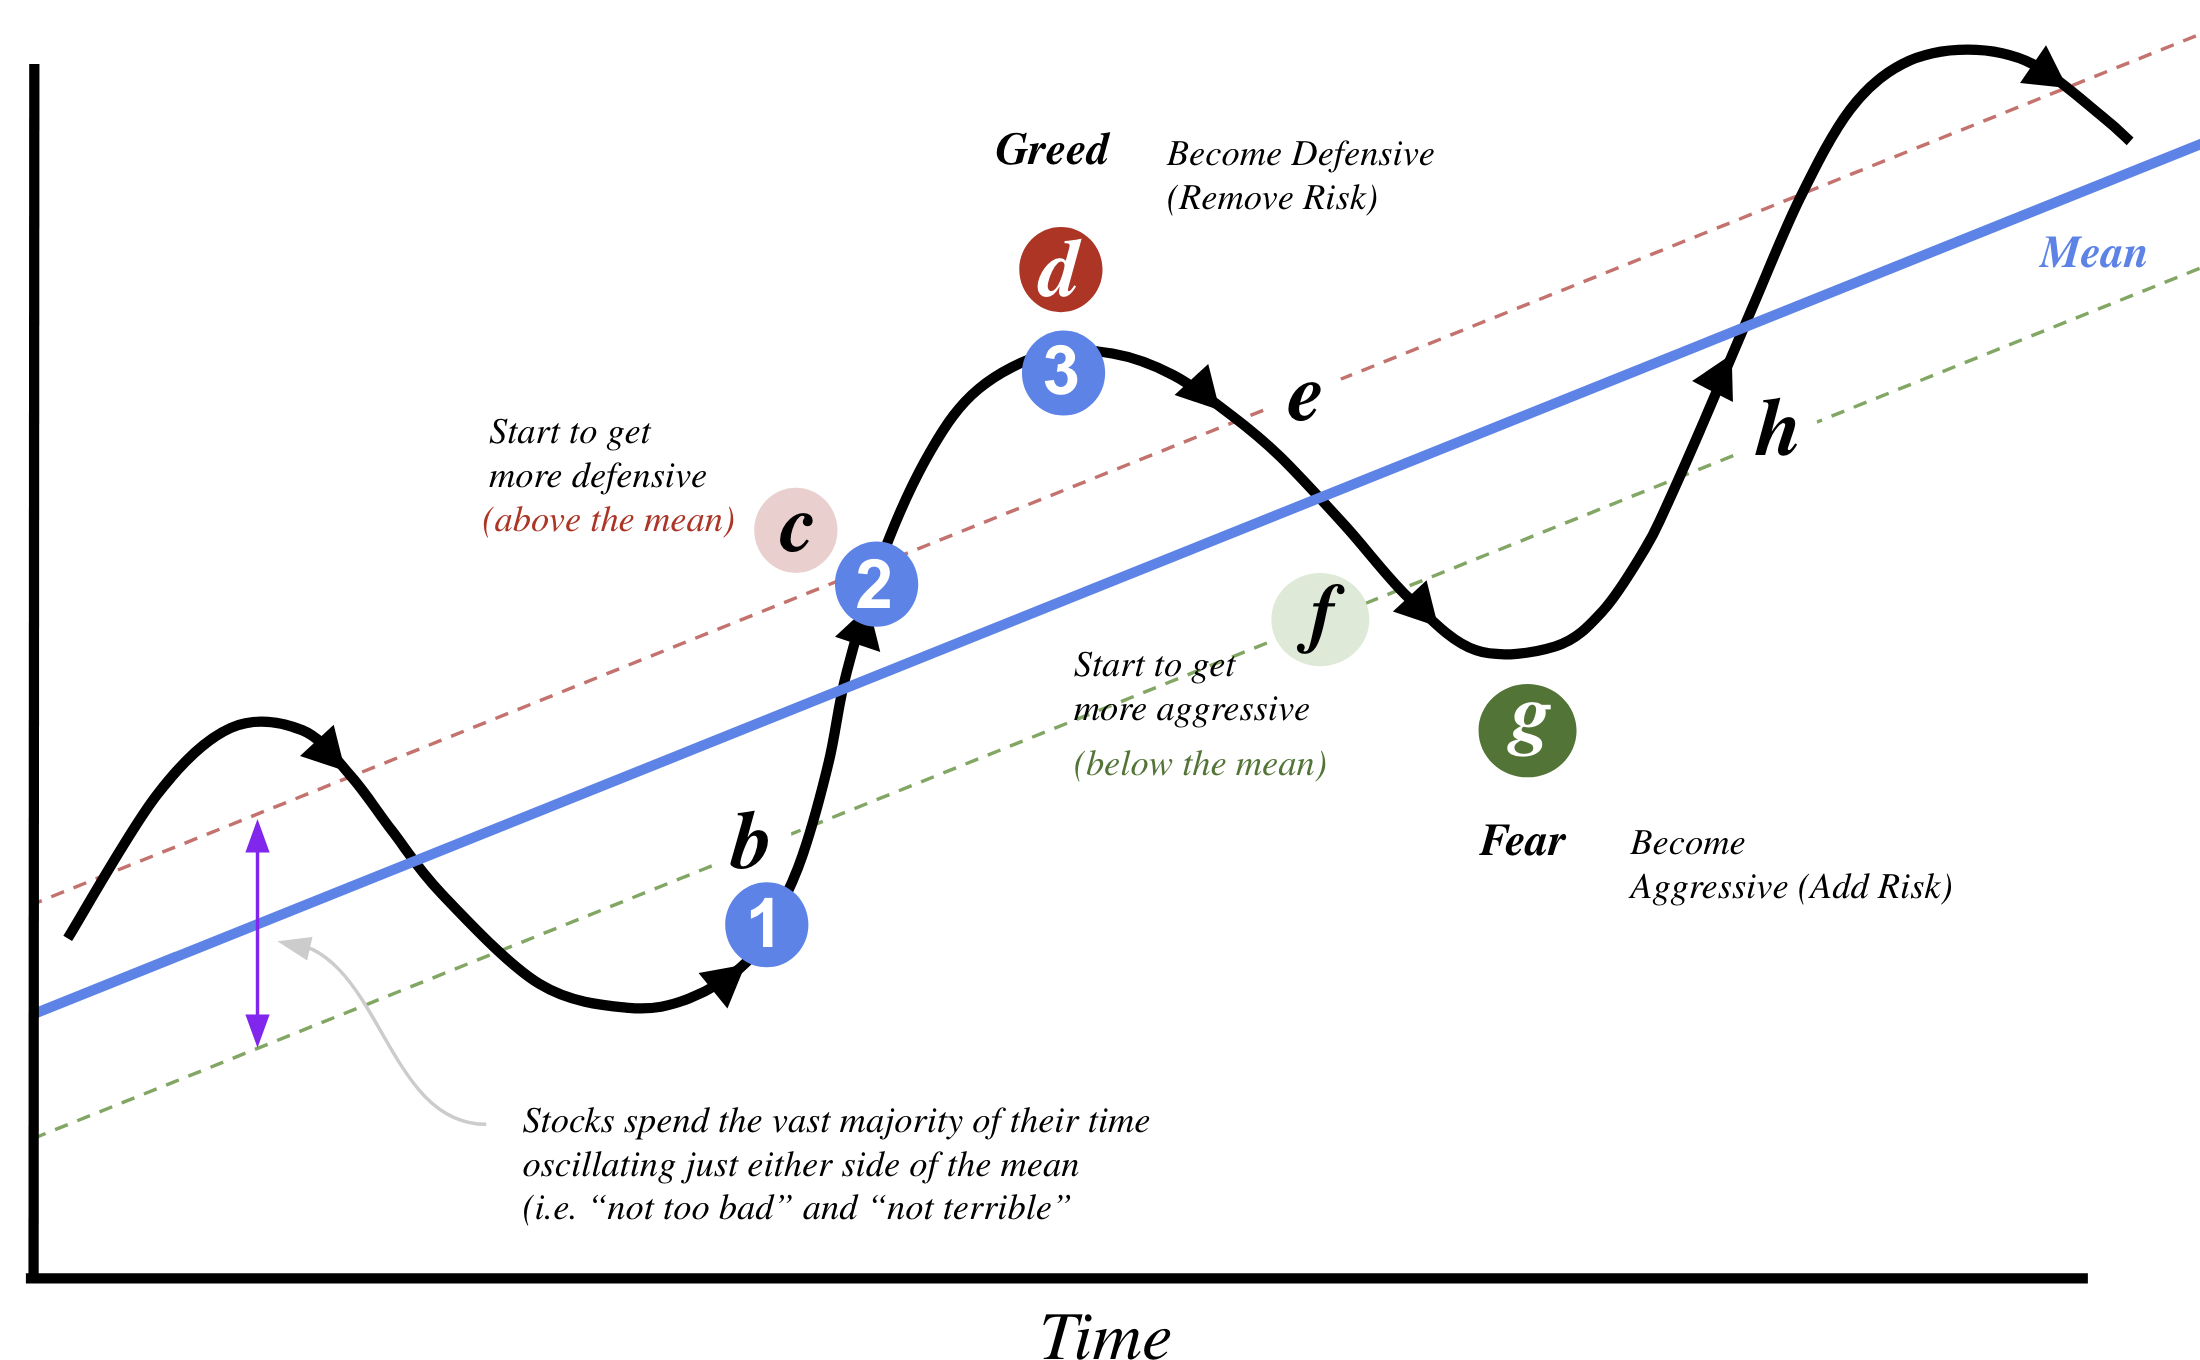
For example, if I refer to Howard Marks‘ market cycle diagram – it refers to phases labelled “2 and 3“.
Coming back to the mid 1990’s – it was a period of solid economic expansion (positive GDP growth) with low inflation.
When you have this environment combined with monetary easing and technological advancements — investors aggressively add to risk.
For example, in the case of the late 90s, this surge in the tech sector led to a bubble, which burst in the early 2000s.
Referring to our diagram – this saw the cycle move from point “d” (peak optimism) to “g” (outright fear”) in quick order.
It was rush for the exits.
Now assuming the Fed is set to cut rates in the realm of “150 bps to 200 bps” over the coming 12 months (as they seek to “recalibrate”) – we could see a similar set up over the next few years.
To be very clear – we are not yet at point “d” in our cycle.
However, we could also argue the Index (which is heavily skewed by the Mag 7) is far from trading at a “fair price”.
For example, the forward PE multiple for the S&P 500 is already ~21x with the market trading 5738 at the time of writing.
However, if we remove the Mag 7, that multiple comes back to around 18x (which is reasonable)
We are no where near the frothy valuations of 1999…
But that’s what could lie ahead with aggressive easing.
For now, we assume 2025 earnings will be in the realm of $275 per share (i.e., ~11% growth)
Rate cuts could see this expand further as the Fed adds liquidity to a roaring market.
Which begs the question:
Does the Fed really need to be that aggressive?
Many believe they do.
S&P 500 Emboldened by the Fed
I understand why the Fed decided to cut 50 bps this month….
The labor market is slowing and inflation risks appear to be behind us.
And with the Fed’s preferred inflation measure – Core PCE coming in at 2.7% (which remains very sticky) – the Fed has scope to normalize the effective fed funds rate back around 3.50% to 4.00%
Powell’s logic is rate cuts will help prevent unemployment from rising significantly…
And maybe it will…
But there is open question whether that train has already left the station (as I discussed here)
That said, with every policy decision there is typically a “trade off”.
In this case, the Fed’s choice to balance the risks by aggressively cutting rates could also increase the chance of the market overheating.
As an aside, it’s worth nothing there is something like $6 Trilion in money markets itching to find a home.
This is what we saw during the late 90s – which led to a long-lasting painful recession.
Capital was lost and jobs were shed at scale.
Therefore, the Fed will be wise to balance some possible “short-term economic pain” with “longer-term stability”.
The problem is – no-one wants any form of short term pain.
Let’s look at how stocks closed the week:
Sept 28 2024
As I was saying last week, the bulls continue to hold court.
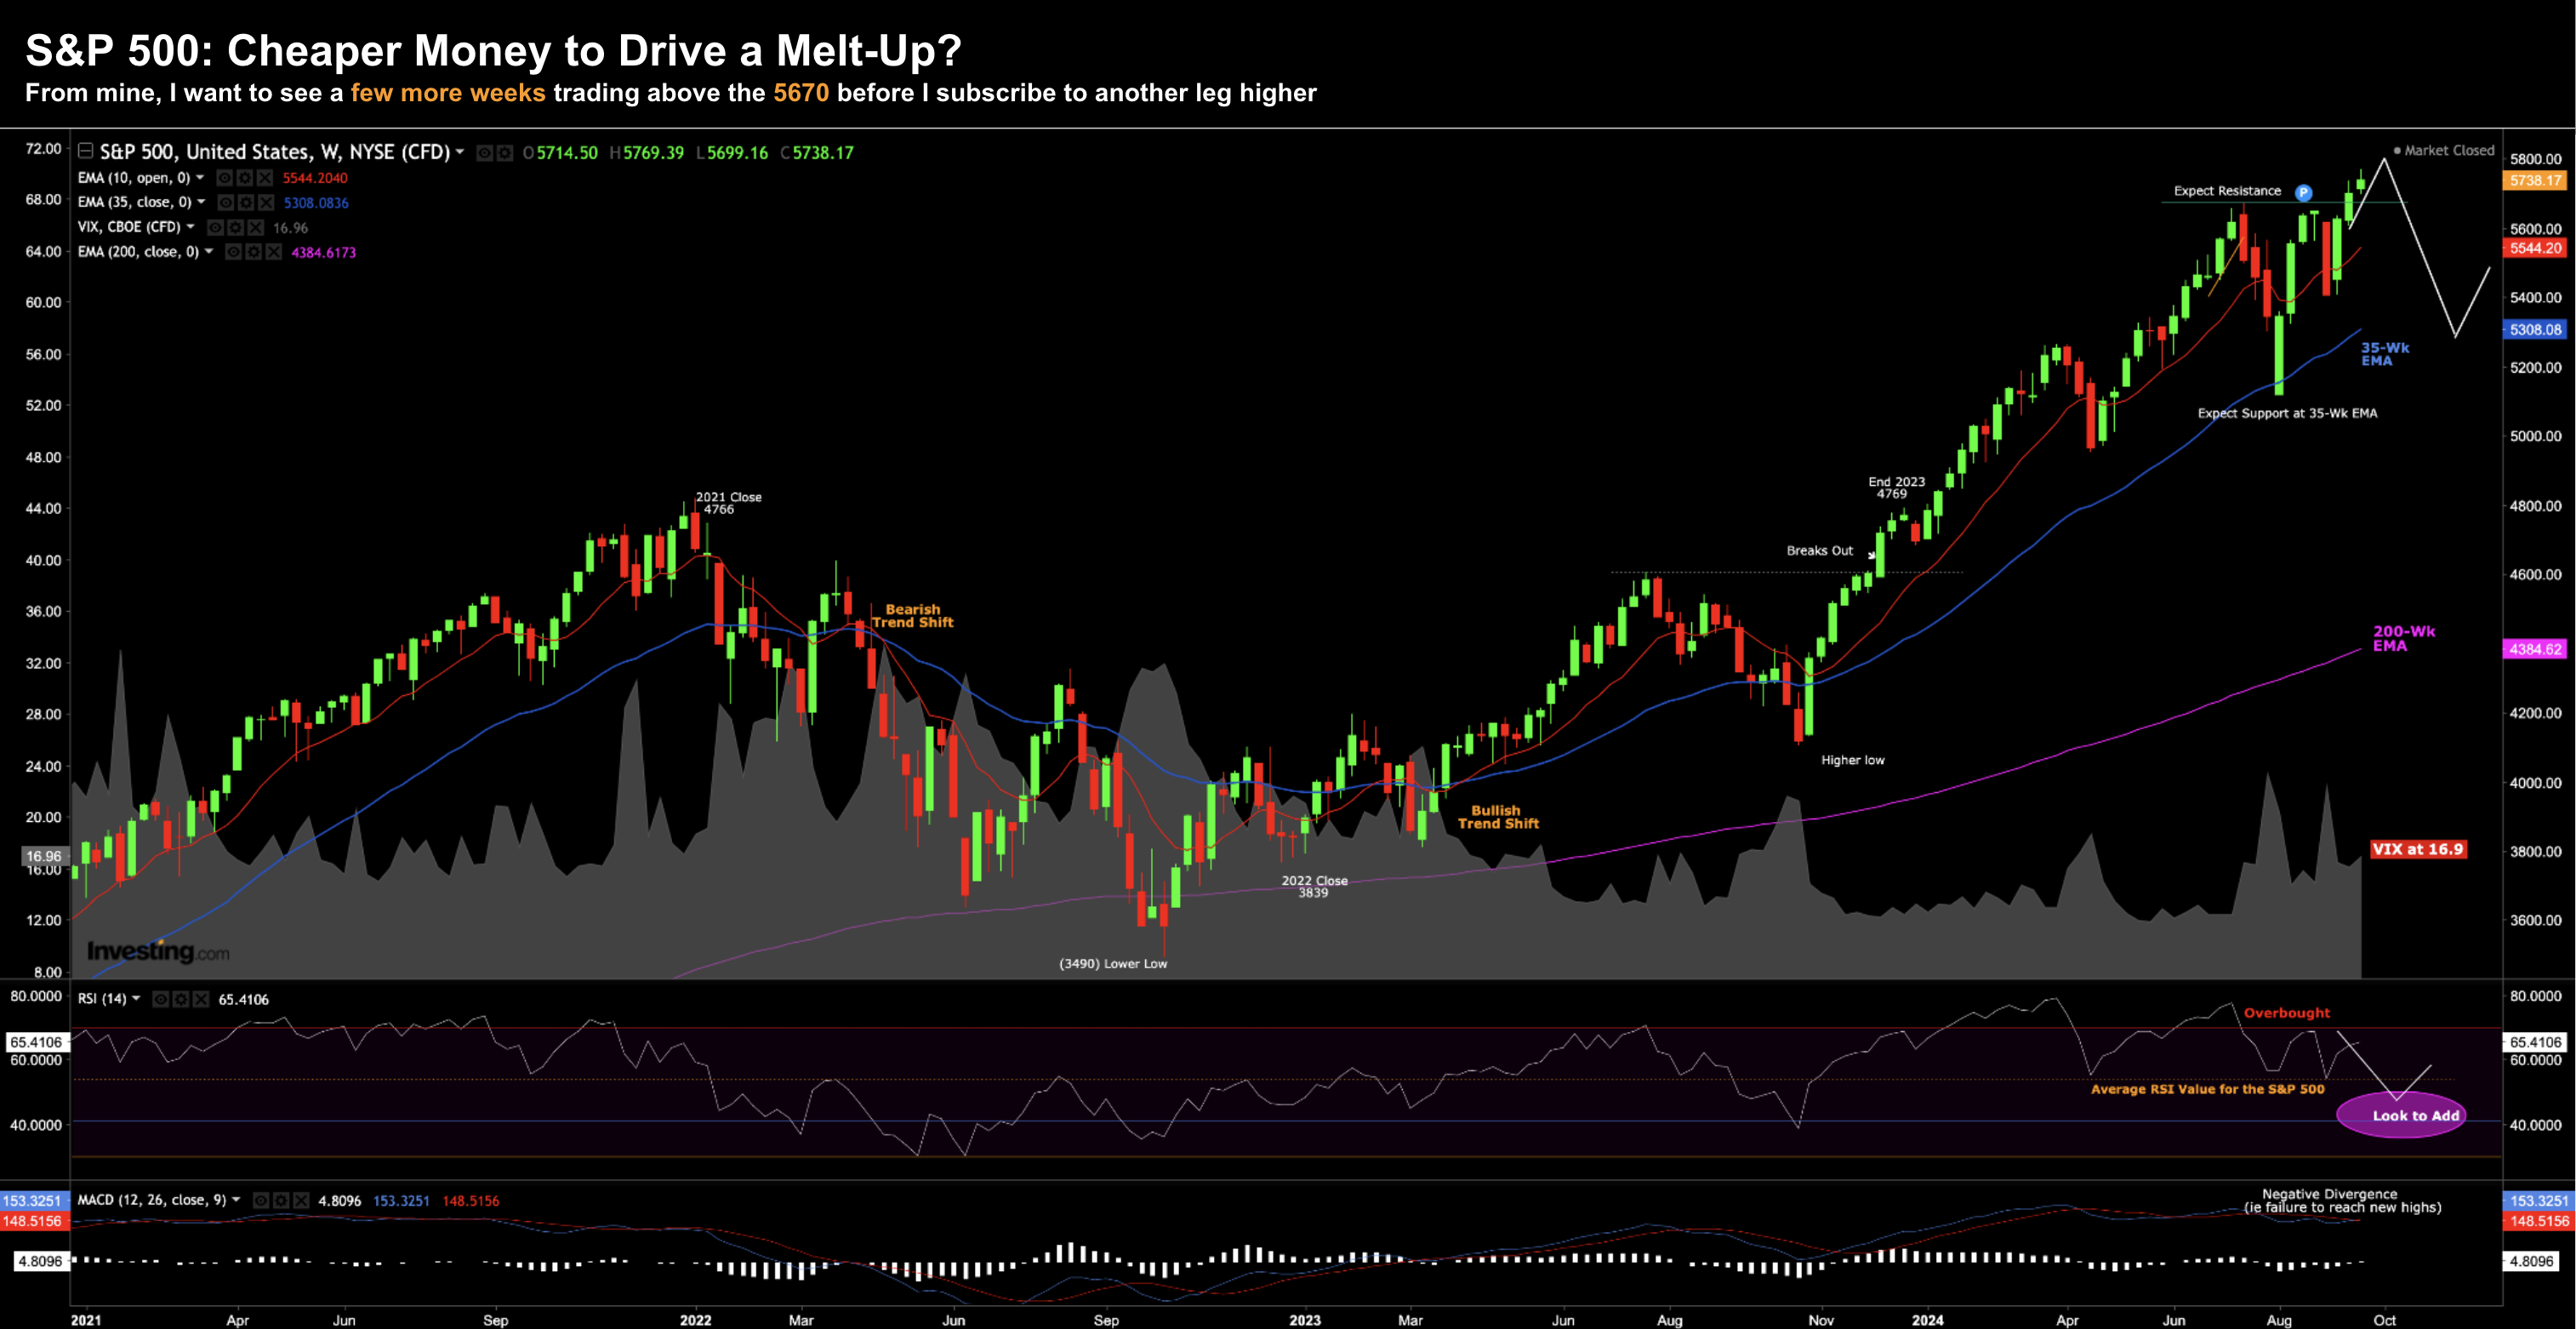
Whilst markets have made all-new highs – I’m reluctant to call a (technical) break out above the previous 5670 high (from mid-July)
For example, what I prefer to see is at least 3 to 4 weeks of strong closes above this level before I subscribe to the next leg higher.
And we could easily see that…
However until then there is a good possibility the market pivots from here and closes back below this former high – which would be considered a false break higher.
For example, something I am seeing in the lower window is a real loss of momentum.
This is known as negative divergence and does not confirm the new highs… it’s something to watch.
And if we do see a false break of the high (due to failing momentum) – then I favour a move back towards the 35-week EMA zone.
October is known for its (sharp) surprises…
And with 37-days until the U.S. Presidential election (which is far too close to call) – I’m not ruling anything out.
Putting it All Together
If nothing else, I expect (and look forward to) greater volatility between now and year’s end.
The market will continue to digest monthly employment reports, corporate earnings and the consequences of easier monetary policy.
However, there is one thing I remain positive on:
And that’s long-term U.S. productivity growth thanks to transformative advances in technology.
This is important.
With the productive gains it will enable the economy to expand without igniting runaway inflation.
Technological advancements such as artificial intelligence (A.I.) will drive greater productivity and support economic growth.
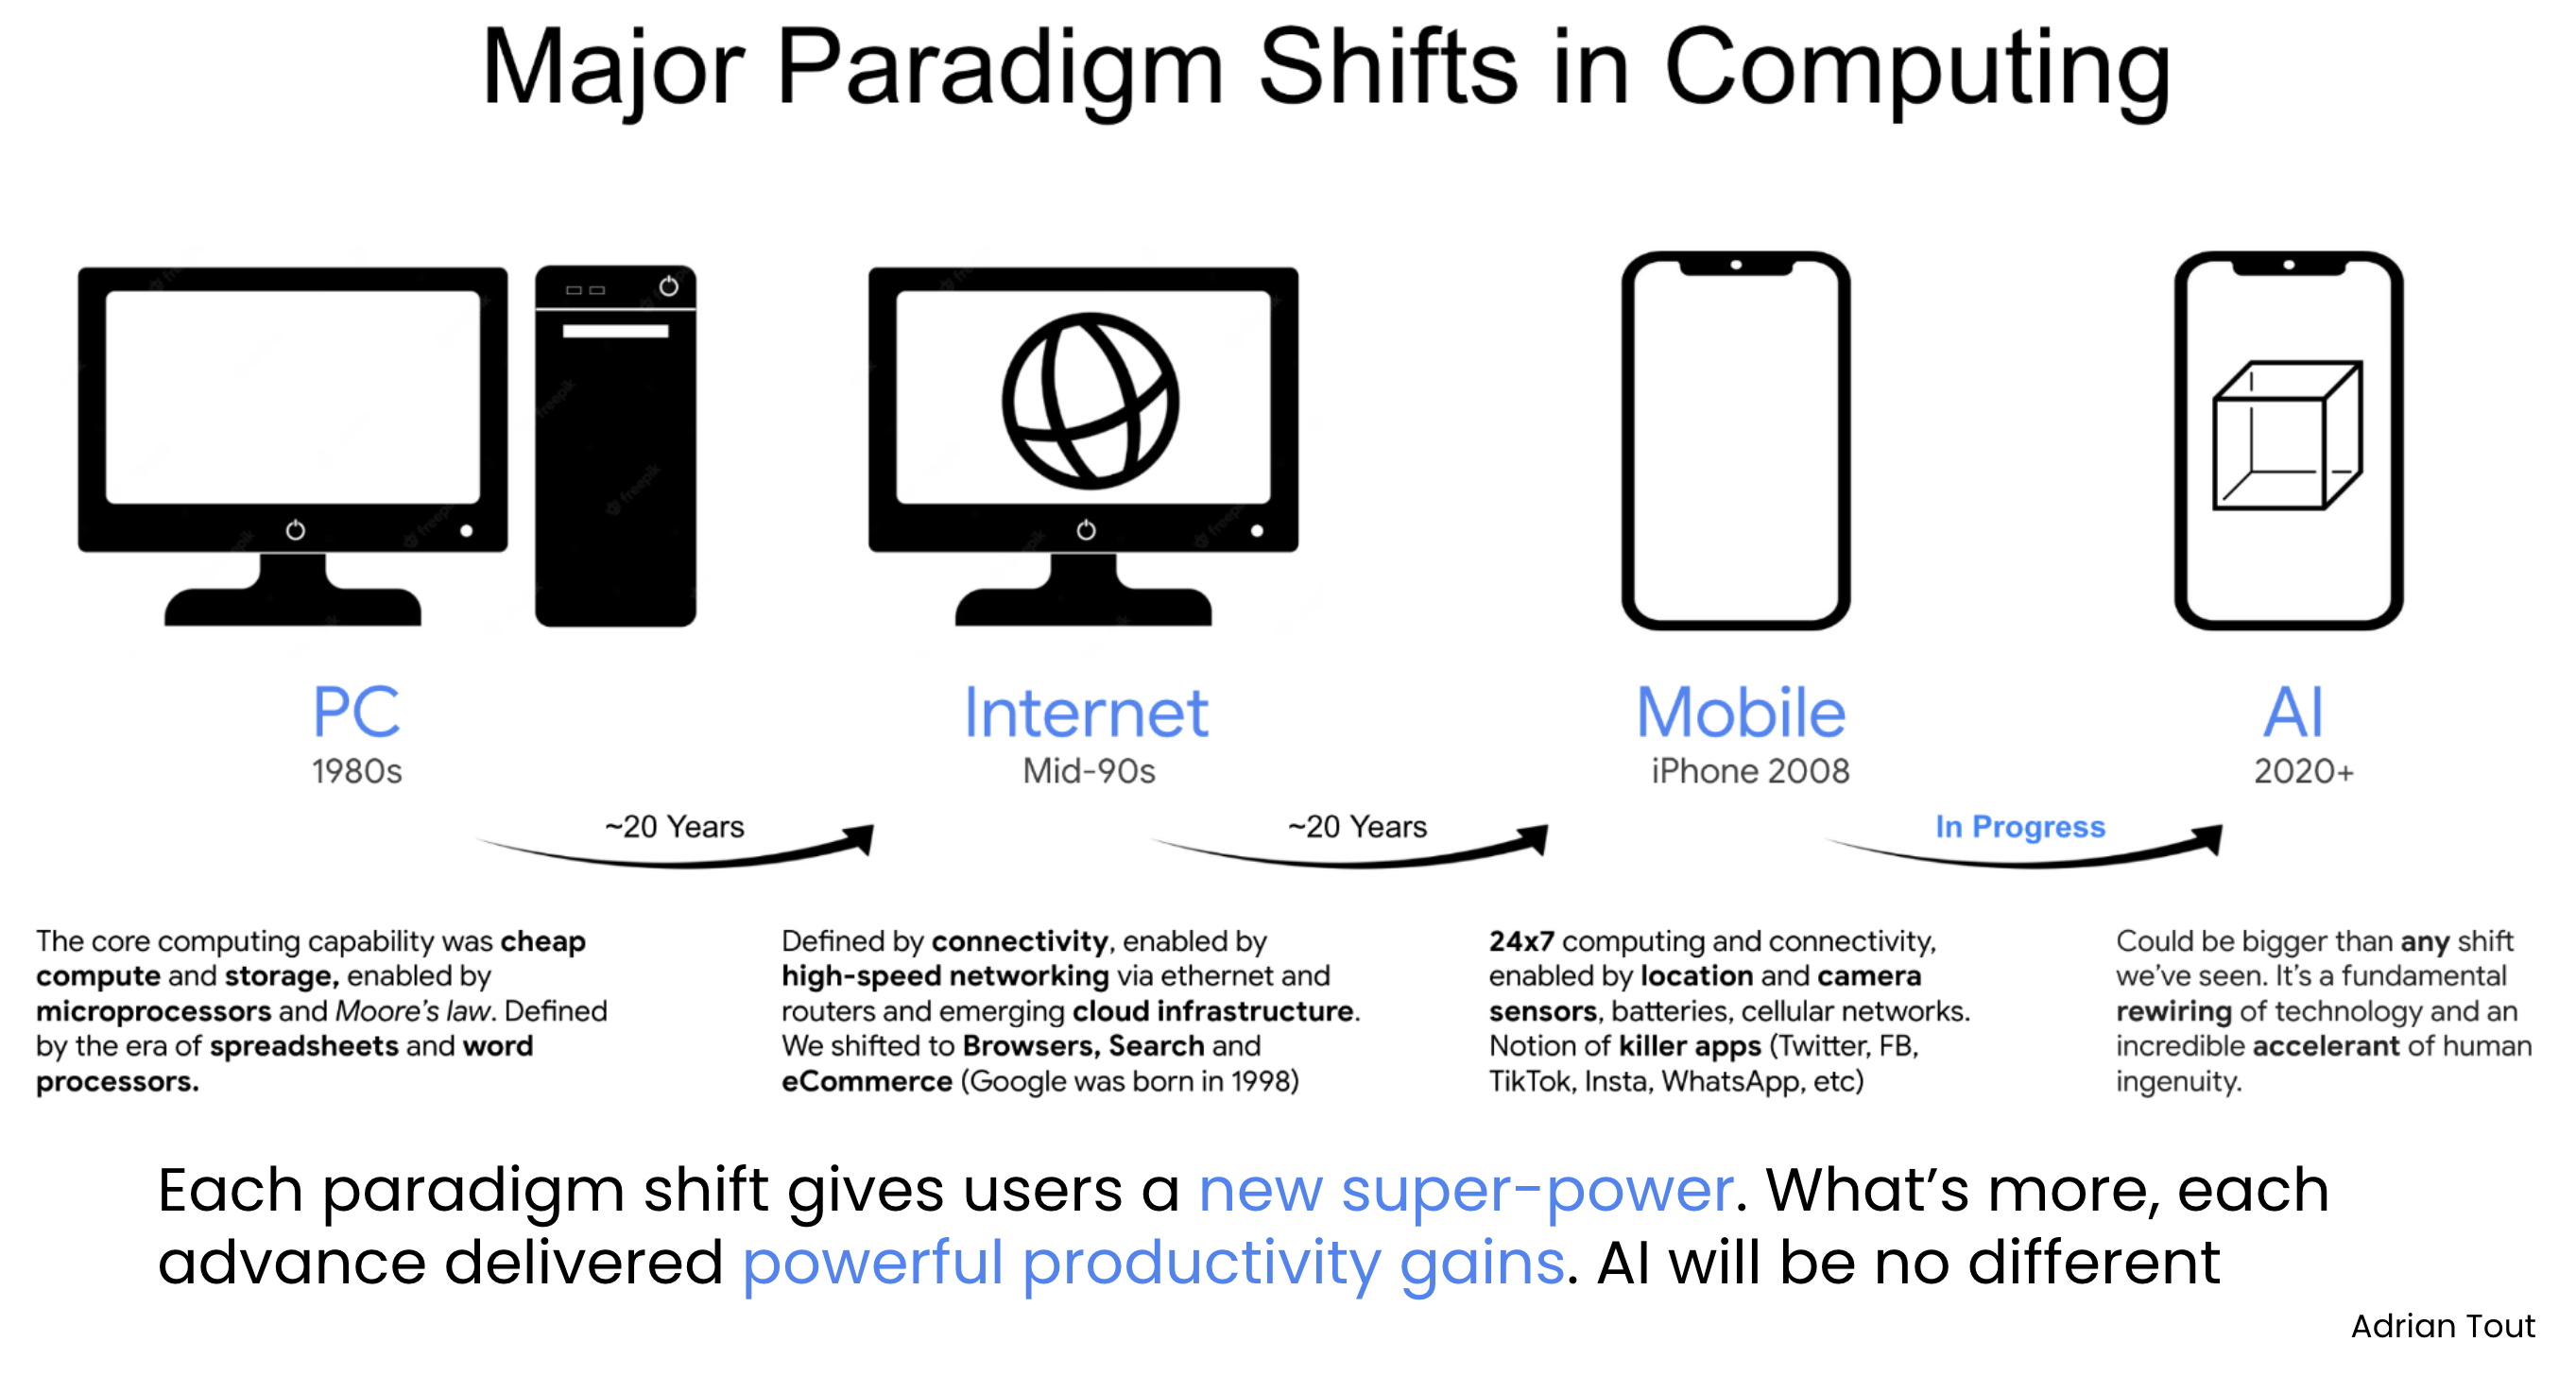
We saw something very similar with both the advancement of the internet and then mobile computing (which gave us the power of location-enabled technology and 24×7 compute)
For example, readers may recall this framework I developed last year (as part of a talk I gave to a University)
Each ~20-year leap forward in technology has delivered powerful productivity gains:
But here’s the thing:
Whilst this is a positive for long-term economic growth and general advancement – investors can get caught paying too much.
That’s something to be mindful of — as multiples look set to continue their expansion during this easing cycle.

