- NVDA now ‘the defining stock’ of the rally (no longer TSLA)
- Earnings trend feels lower – not higher
- Equal Weighted Fwd PE is 15.5x (not expensive)
Q4 2023 earnings are starting to hit the tape…
From mine, if the market is to continue rallying – it’s less about inflation and the Fed – it’s whether corporate America will deliver on 12% earnings growth in 2024.
Coming into earning’s season – my view was 12% felt ambitious – given the slowing economy and relative health of the consumer.
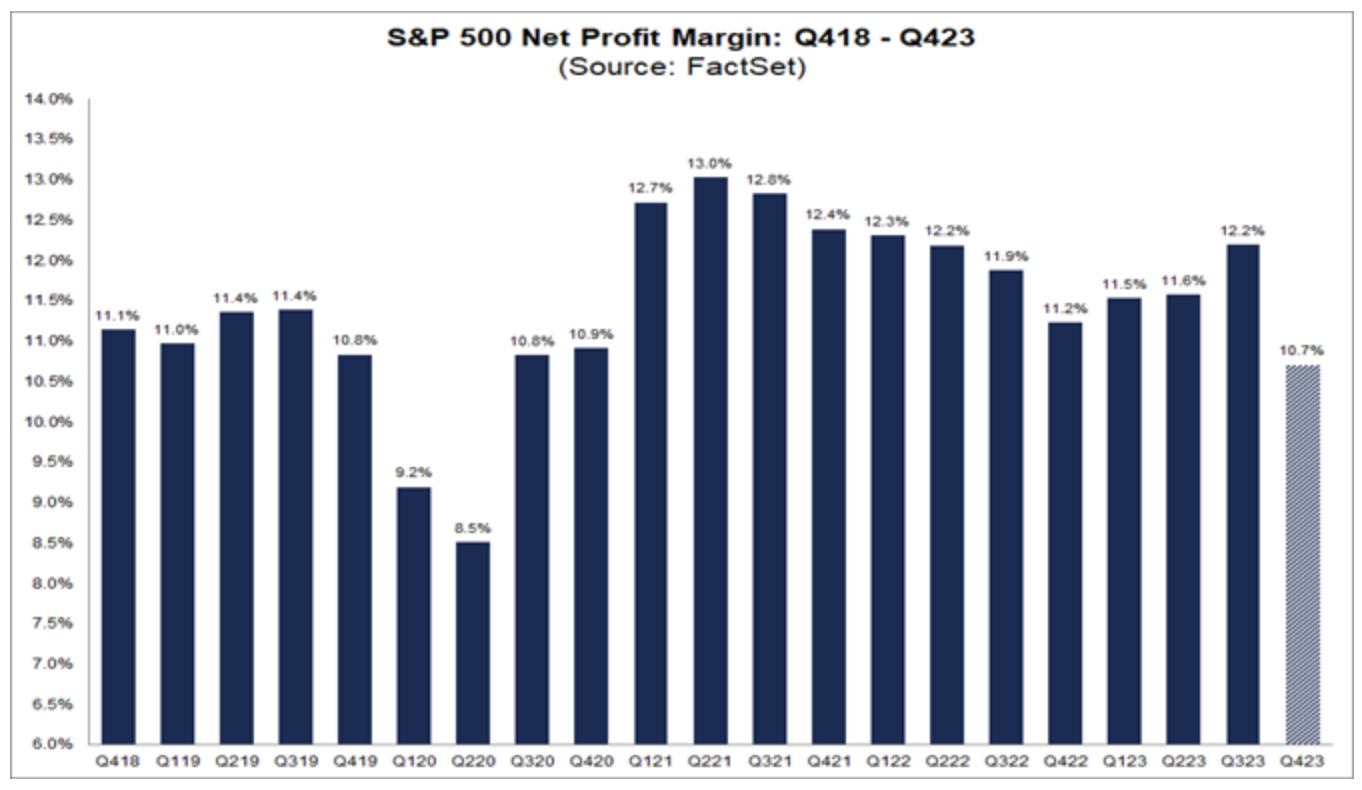
Today, Factset provided us with the latest update:
The (blended) net profit margin for the S&P 500 for Q4 2023 is 10.7%, which is below the previous quarter’s net profit margin (12.2%), below the year-ago net profit margin (11.2%), and below the 5-year average (11.5%).
If 10.7% is the actual net profit margin for the quarter, it will mark the lowest net profit margin reported by the index since Q2 2020 (8.5%). In addition, it will mark the largest quarter-over-quarter decline in the net profit margin since Q1 2020 compared to Q4 2019 (9.2% vs. 10.8%).
At the sector level, all eleven sectors are reporting (or are expected to report) a quarter-over-quarter decrease in their net profit margins in Q4 2023 compared to Q3 2023, led by the Financials (12.6% vs. 17.7%), Utilities (12.4% vs. 15.9%), and Consumer Discretionary (6.9% vs. 9.5%) sectors.
Four sectors are reporting (or are expected to report) a year-over-year increase in their net profit margins in Q4 2023 compared to Q4 2022, led by the Utilities (12.4% vs. 9.1%) and Communication Services (11.7% vs. 8.8%) sectors
On the other hand, seven sectors are reporting a year-over-year decrease in their net profit margins in Q4 2023 compared to Q4 2022, led by the Financials (12.6% vs. 16.6%) and Energy (9.6% vs. 13.0%) sectors
However, a potential concern is analysts assume net profit margins will improve in the first half of 2024.
Will they? How?
That can only happen via three ways:
- Cost cutting (e.g., ‘right-sizing’ labor forces);
- Greater productivity; and/or
- Increases in revenue
As of today, the estimated net profit margins for Q1 2024 and Q2 2024 are 11.7% and 12.1%, respectively.
By way of comparison, Q1 2023 was 11.5% and Q2 2023 was 11.6%
Putting it together, it feels like:
(a) S&P 500 is expensive (i.e., lower earnings increases the fwd PE ratio); and
(b) 12% earnings growth priced in appears optimisti
Now late last year – I posed the following question “Did We Just Pull Forward 2024’s Gains?”
Based on the trend of earnings reporting so far – this could be starting to play out.
However, that flies in the face of the market achieving record highs (more on this shortly when I discuss the Magnificent Seven (M7)
Equal Weighted Fwd PE of 15.5x
Whilst the overall S&P 500 is expensive – trading a forward PE above 20x (which assumes 12% EPS growth) – this ratio is also heavily skewed towards tech.
Consider NVDA – which trades at a forward PE of 30x plus – also responsible for much of the Index’s recent gains.
TSLA trades at a forward PE of more than 50x; AMZN at 43x and MSFT at 36x
Put together, the forward PE’s of these collective companies is north of 35x
Jan 22 2024
However, it’s questionable whether any deserve the multiples awarded given:
(b) projected earnings growth.
Now if we look at the Equal Weighted Index – valuations are far more reasonable (i.e., a better long-term risk reward).
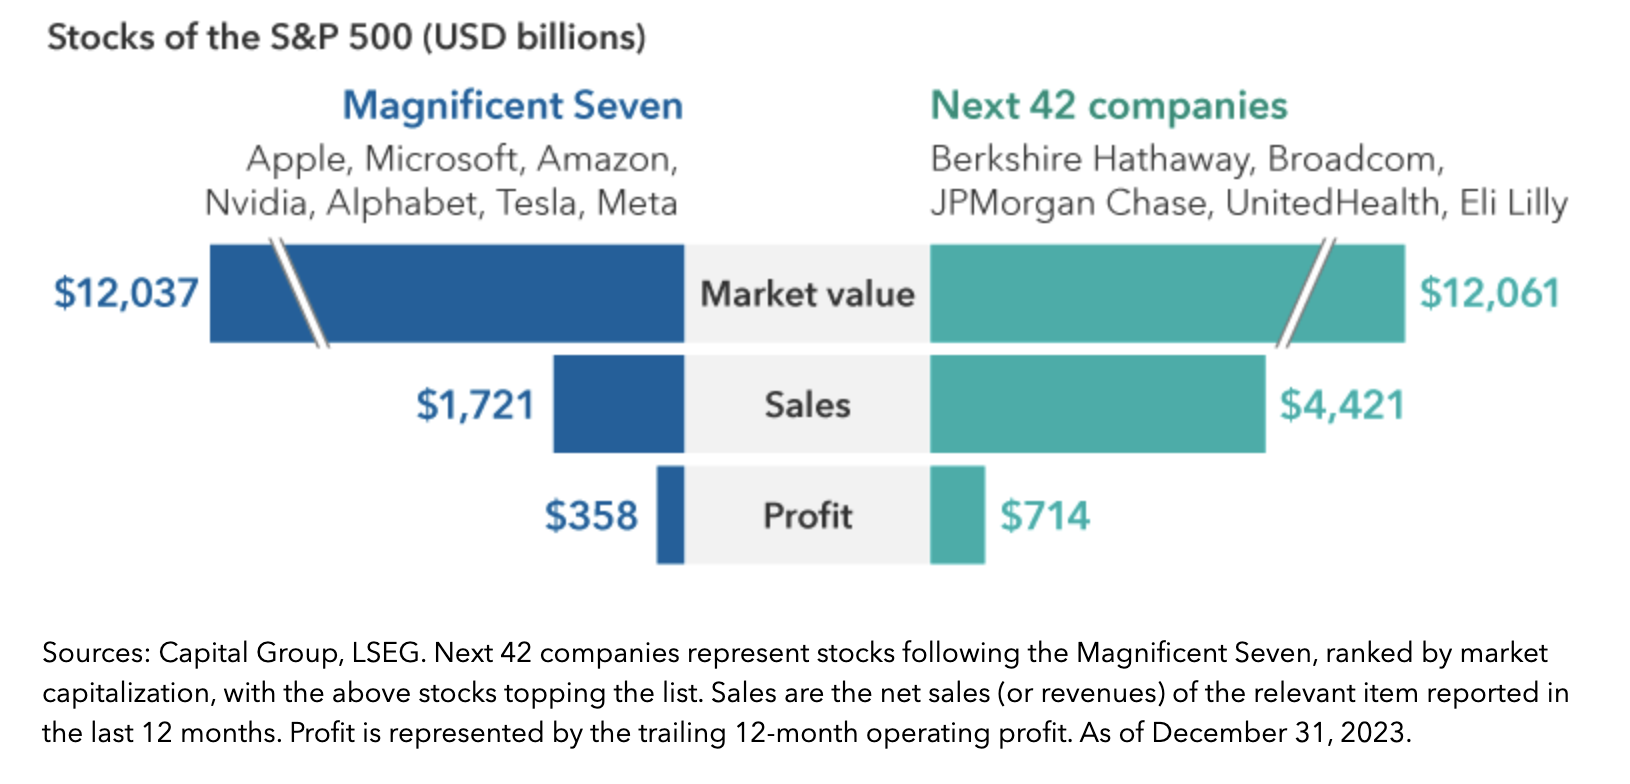
Consider the following graphic from Capital Group (current Dec 31 2023).
Their research tells us:
Both the 12-month forward sales and earnings for this next set of companies making up a $12 trillion market cap are higher than for the Magnificent Seven (M7), according to LSEG’s data as of December 31, 2023 – yet another data point indicating U.S. stock market performance could broaden in the coming years, pending earnings outlooks.
This echoes the point I made in my last post – highlighting the opportunity in the equal weighted index.
Our focus remains on valuations given the rise in share prices for the M7.
The S&P 500 has a forward price-to-earnings (P/E) ratio of about 15.5x excluding the M7, while the M7 has a P/E of about 35x, according to data compiled by FactSet as of January 2, 2024.
This is why I believe there is far better risk reward in the equal weighted index – as you are buying the market at roughly fair value (i.e., 15.5x)
With respect to earnings and growth:
Earnings growth estimates in 2024 bring the division into high relief – the M7 boasts 20.8%, with the S&P 500 at 11.5%, and S&P 500 sans-M7 at 6.7% respectively.
For 2025, earnings growth estimates for those three groups are projected at about 17%, 12% and 6.7%, respectively.
Longer-term earnings estimates for the M7 remain higher, but the uncertainty band around them would also be higher. Hence, the need to diversify.
Similar to what I recommended – they stress the importance of some exposure to the M7 – however it should be tempered.
As I’ve explain over the past few years – there’s a good reason these stocks trade at meaningfully higher multiples than the market’s average (i.e. between 17-18x the past 10 years).
For example, they’re some of the highest quality stocks in terms of:
- free cash flow generation
- operating margins
- defensible operating moats
- market position and
- sheer strength of their balance sheets.
That said, exposure to a broader set of stocks within the S&P 500 is prudent (and/or abroad) – where revenue and earnings growth look promising – would be prudent.
Putting it All Together
Coming into the weekend – Nvidia (NVDA) added some $250B in market cap year to date.
That is almost half of the total S&P 500 over the same period – giving you a better sense of the dense market concentration (and skew towards AI centric names)
From mine, NVDA is the defining stock of this rally and the source of the ‘speculative energy’.
For example, last year that stock was Tesla (TSLA)
Not now.
TSLA has underperformed its peers from mid last year – as the market reconsiders the growth prospects for electric vehicles (and its lofty valuation)
Before I close, today I saw further rotation out of large-cap tech (which is good news).
For example, the Russell 2000 was up 2.0% vs the Nasdaq just 0.32%
Whilst we should never draw conclusions from just one day’s worth a trading – it’s encouraging to see the market broaden.
This is what I expect will happen.
From mine, investors would be wise to seek further diversification (where valuations are more reasonable)
Let’s continue to keep an eye on earnings growth (and its trend).


