- Most expect a soft landing – so why worry?
- A framework for forecasting slowdowns and the market direction
- Looking back at lessons from 2000/02
Optimism remains extremely high on Wall Street.
For example, if we assume:
- Inflation is likely to continue falling towards the Fed’s 2.0% target;
- As a result, we’re likely to see an easing rate cycle next year;
- Corporate profits are expected to grow 13%; and
- Employment remains strong.
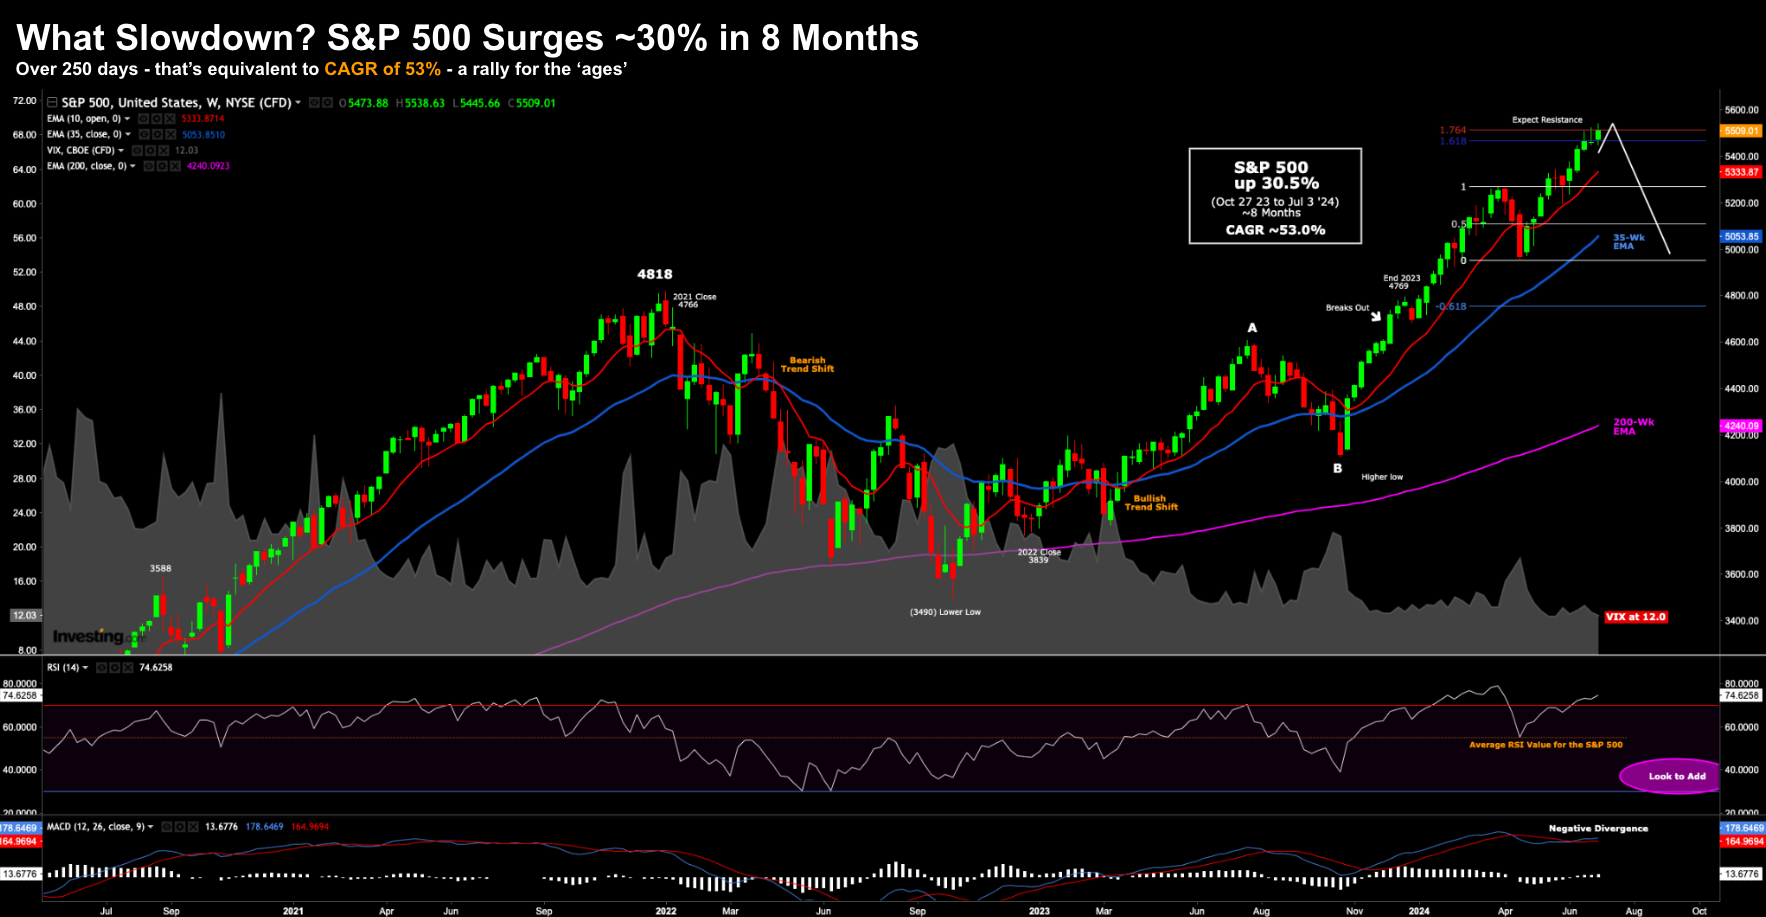
Combined with excitement about the potential for all-things artificial intelligence (AI) – the S&P 500 is ~30% higher than 8 months ago.
That said, around 60% of those gains have come from less than 6 stocks.
Regardless, that’s the equivalent of an annualized compound annual growth rate (CAGR) of 53%
CAGR: (5509/4117) ^ (1/((250)/365))-1 = 53%
Where:
(i) 250 equals the number of days since the October 27 low; and
(ii) 4117 was the low.
Given the average (100-year) Index CAGR is ~10.5% (inclusive of a ~2.5% dividend) – it will be remembered as one of the most aggressive (and narrow) rallies we’ve seen in decades.
Below we see the exponential surge over ~8 months:
July 3 2024
Further to this post – many Wall Street analysts have scurried to ratchet up their end of year forecasts.
The average EOY S&P 500 target is ~5400 – with some penciling in 5600 (implying further gains of ~2%)
And if we assume 2024 earnings are expected to grow 12% to ~$245 per share – that’s an implied 2024 PE of 22.9x
Looking further ahead, Factset reported that analysts see 2025 earnings in the realm of $278.80 per share.
That implies a 2025 forward PE of 19.7x
And whilst this is certainly possible – this EPS forecast assumes variables such as:
- Rates to come down b/w 50 and 100 basis points;
- Inflation to slow (e.g., CPI b/w 2.0% and 2.5%);
- Real GDP to expand (~2.0%+ YoY);
- Employment to remain full (e.g., total unemployment 4.0% or less);
- Corporate profits to expand; and of course
- No recession
This is your ‘soft landing’ script…
But it begs a question:
What impact will a ‘soft-landing’ have on current stock valuations?
Put another way – does there need to be a recession to experience a meaningful (e.g. 12%+) decline?
My short answer is no (however I will support that shortly).
The gist of this post is to remind investors that you don’t need a definitive line-of-sight to a potential recession before protecting gains.
I say that because recessions are lagging events – which come at the very end of the cycle.
By the time they arrive – the economic damage is already done.
Therefore, we need to be in front of the curve.
Typically in the 9-months leading up to a recession – stocks continue to trade at or near highs – as analysts raise their outlooks.
Unemployment and earnings are usually strong – as GDP keeps its head above zero.
But those who are able to understand where we are in the business cycle will pay careful attention to what’s happening shortly after peak economic growth.
What’s more – they will lean into leading indicators like consumer spend (i.e., PCE)
Doing this can mean you don’t stand in the way of a potential steamroller picking up pennies (i.e., high negative convexity risk)
For me, the key to winning this game is not to lose money (as I’ve been stressing of late)
Gains will always come and there are times to add exposure.
But longer-term successful speculators are always thinking of ways not to give money back once its earned.
This post will expand on that thinking.
On the other hand, the way we outperform is buying when there is outright fear (i.e. a recession).
Let’s explore…
Understanding the 4 Key Economic Stages
In “Ahead of the Curve: A Commonsense Guide to Forecasting Business and Market Cycles” – Joseph H. Ellis provides a valuable framework for defining the stages in a typical economic cycle.
By way of introduction – Ellis spent 25-years working at Goldman Sachs as an analyst for consumer retail.
His book presents a methodology for simplifying the use of economic data in forecasting the basic direction of the economy and, with it, the likely direction of the stock market. I quote:
Early in my career, I came to realize that I simply could not wait for economic trends to manifest themselves in the stock market and in the sales and profits of the companies I was charged with covering. I had to see whether it was possible to get ahead of the curve in forecasting consumer spending and general economic trends.
I couldn’t excuse myself from this task simply by noting that few economists themselves had been successful at this. As much for self-preservation, I suppose, as from curiosity, I began to investigate how I might develop an improved method for forecasting consumer spending and, with it, the rest of the economy.
Furthermore, I wanted to document the basis for my forecasts with such clarity that my clients would understand not only the forecast but also the rationale supporting it. I recognized that it would be essential to study the relationships among various economic indicators over many decades and economic cycles.
The primary question in this endeavor would be were there consistent and repetitive cause-and-effect (i.e., predictive) relationships among these series in the past that might be used to forecast future developments? I soon discovered—with considerable excitement—that economic events are not as random and unpredictable as I had previously thought.
I will draw heavily on examples Ellis provides (examining the recession of 2000/02)
From there, I’ll apply his framework to today with variables such as Real GDP, Real PCE, Industrial Product and Capital Expenditure trends.
As an aside, I found the book very easy to read and exceptionally useful. Add it to your list of reading material.
Let’s start with Ellis’ 4 economic life-cycle stages and their characteristics:
- Stage 1 – The peak. This is typically characterised by strong Real GDP (e.g. 3.5%+) and healthy (rising) consumer spending. Corporate profits are showing strong gains, and the employment picture is universally strong as the market enjoys record highs. Interest rates are generally rising in response (or have risen a long way). Investors almost unanimously embrace a rosy business (and stock) outlook.
- Stage 2 – Modest slowing. At this stage, things still generally feel okay. Growth starts to show signs of slowing (e.g. around the long-term average of 2.0%). The bright outlook of Stage 1 gives way to a period of moderate slowdown in the rate of growth particularly in consumer spending at the front end of the cycle. Retail sales growth slows and there are calls for interest rate cuts. However, growth is strong enough to not upset business and investor optimism. Capital spending and employment would still be growing at a strong pace (accompanied with sentiment like a “full-employment economy” and “soft landing”). Few forecasters fear that a recession and the stock market continues its advance or maybe due to take a 5-10% breather.
- Stage 3: Intensifying worry. The economy enters a period of more intense worry, in which the calls for rate cuts become louder. The rate of growth in real consumer spending and real GDP had slowed from a peak to “moderate to muddle though” growth. Economists and others begin to contemplate the possibility that the economy could enter a recession (e.g. a 50/50 bet). And if it where to happen – conjecture grows about the timing and its depths. The stock market may have given up more than 10% – and there’s talk of a possible bear market (a drop of 20% or more). However, analysts will cite talk of strong capital spending and a very low unemployment rate (Remember: employment is a lagging indicator)
- Stage 4: Recession. The economy enters a recession. There’s a decline in real GDP, with corporate profits falling significantly, capital spending beginning to weaken, and—perhaps most alarmingly—the first major increases in the unemployment rate. Fears of a protracted decline would now become more widespread – with argument about when the recession actually began. During the early phases of this stage – stocks continue to decline (e.g., 20% to 50%) – as investors are paralyzed by fear. There is typically widespread pessimism (the opposite of the sentiment we find in Stage 1). However, at some point during the recession, when economic conditions are at their worst, stock prices start to advance as investors price in the inevitable recovery.
Ellis states by Stage 3, it was already too late for most companies to react to slowing business conditions.
“Investors, too, were faced with a dilemma by the time Stage 3 ran its course: the difficult choice of either waiting things out in the hopes that a recession could be avoided, or selling—to avoid further losses—at what could be the bottom“
He adds that it was Stages 2 and 3 that an unexpected slowdown in sales growth would begin to cause rising inventories, pricing weakness for businesses, falling profits, and declining stock prices.
Therefore, it’s prudent for an investor to examine where we are in the cycle (if choosing to add risk):
In cycle after cycle, the abilities of the business and investment communities to perceive the downturn as it occurred were typically so belated that there was little capacity for avoiding its damaging effects.
Much of the problem seemed to revolve around businesses’ and investors’ focus on recession—typically defined as two successive quarters of absolute decline in total economic output (real GDP) on a quarter versus-prior-quarter basis—as the key economic event to be feared, the big bad wolf of the economy, so to speak.
Businesses and investors seemed to feel that, if there were no recession, then everything was basically OK. But, repeatedly, business conditions, corporate profits, and the stock market appeared to suffer badly before recessions ever came into view.
He adds that in both the economy and market – Stages 2 and 3 represent the first half to two-thirds of the damage.
And by Stage 4—the recession—it’s the beginning of end of the harm.
The 2000-2002 Recession
Ellis details two previous recession cycles in his book to demonstrate how investors could have largely pre-empted the decline.
The following economic inputs / quarterly trends are leveraged:
- Real GDP
- Real consumer spending
- Industrial production
- Real capital spending
- S&P 500 earnings per share (representing corporate profits); and
- Unemployment rate.
Using this framework – Ellis shows the damage to business and the stock market occurs as the year-over-year rate of growth slows, well before the economy is in absolute decline (i.e., a recession).
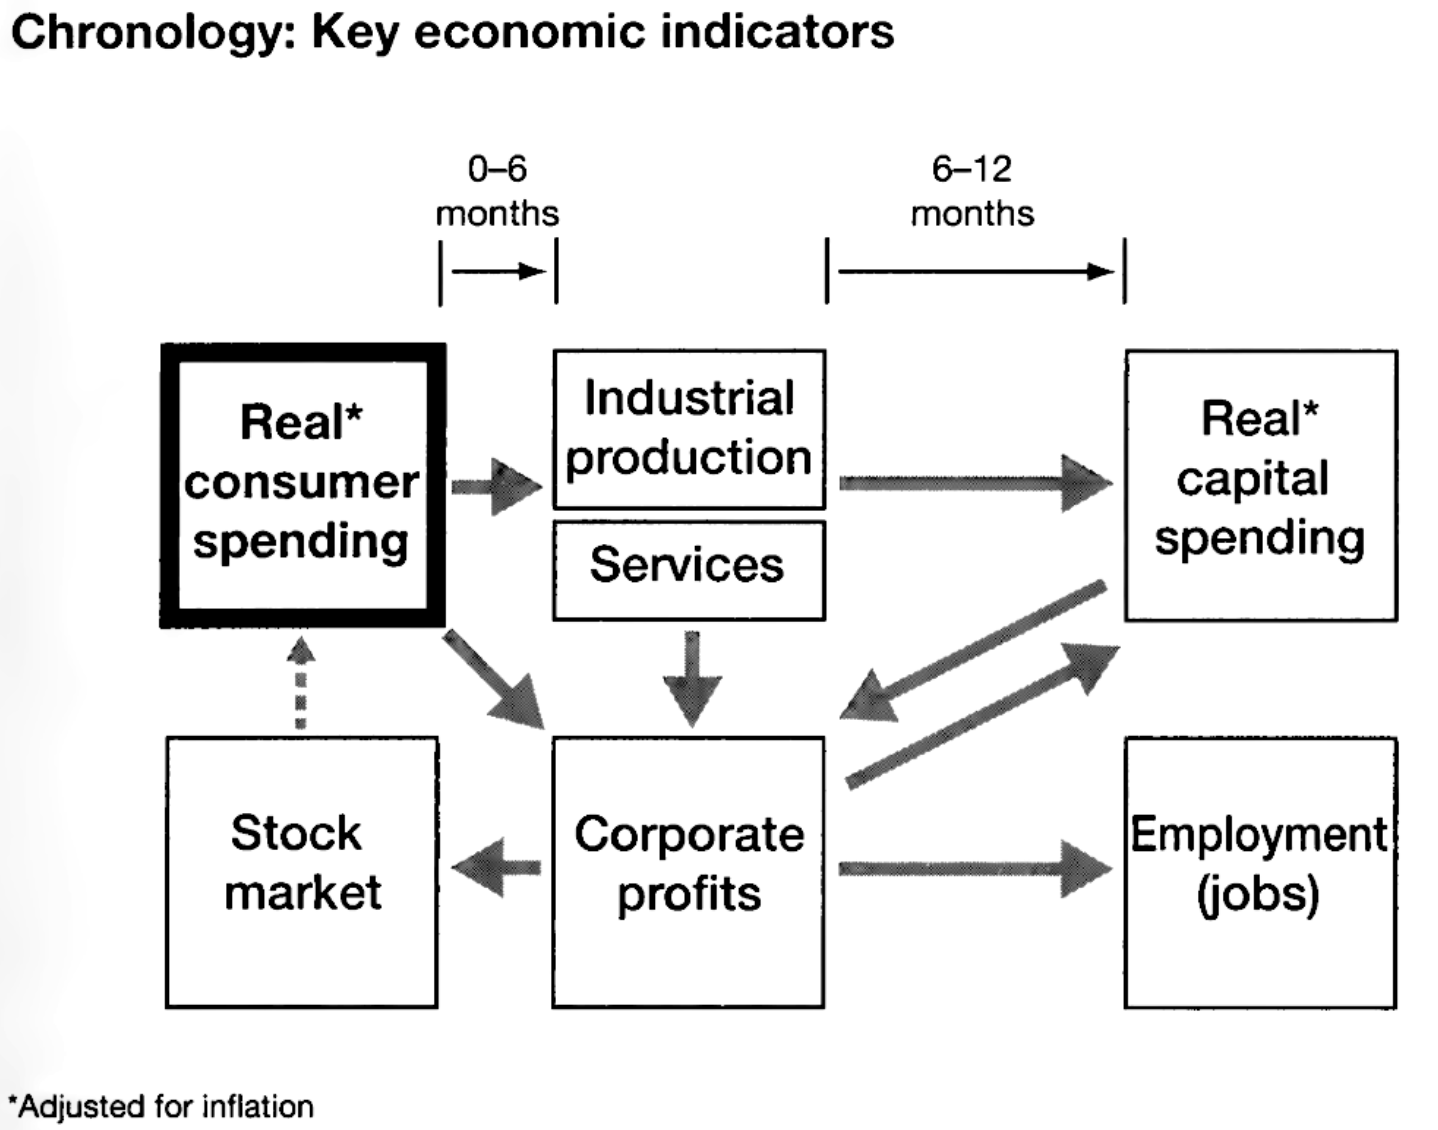
Below is the sequencing of events, key economic indicators and their approximate timing(s):
Let’s now explore the quarterly trends heading into the recession of 2001/02
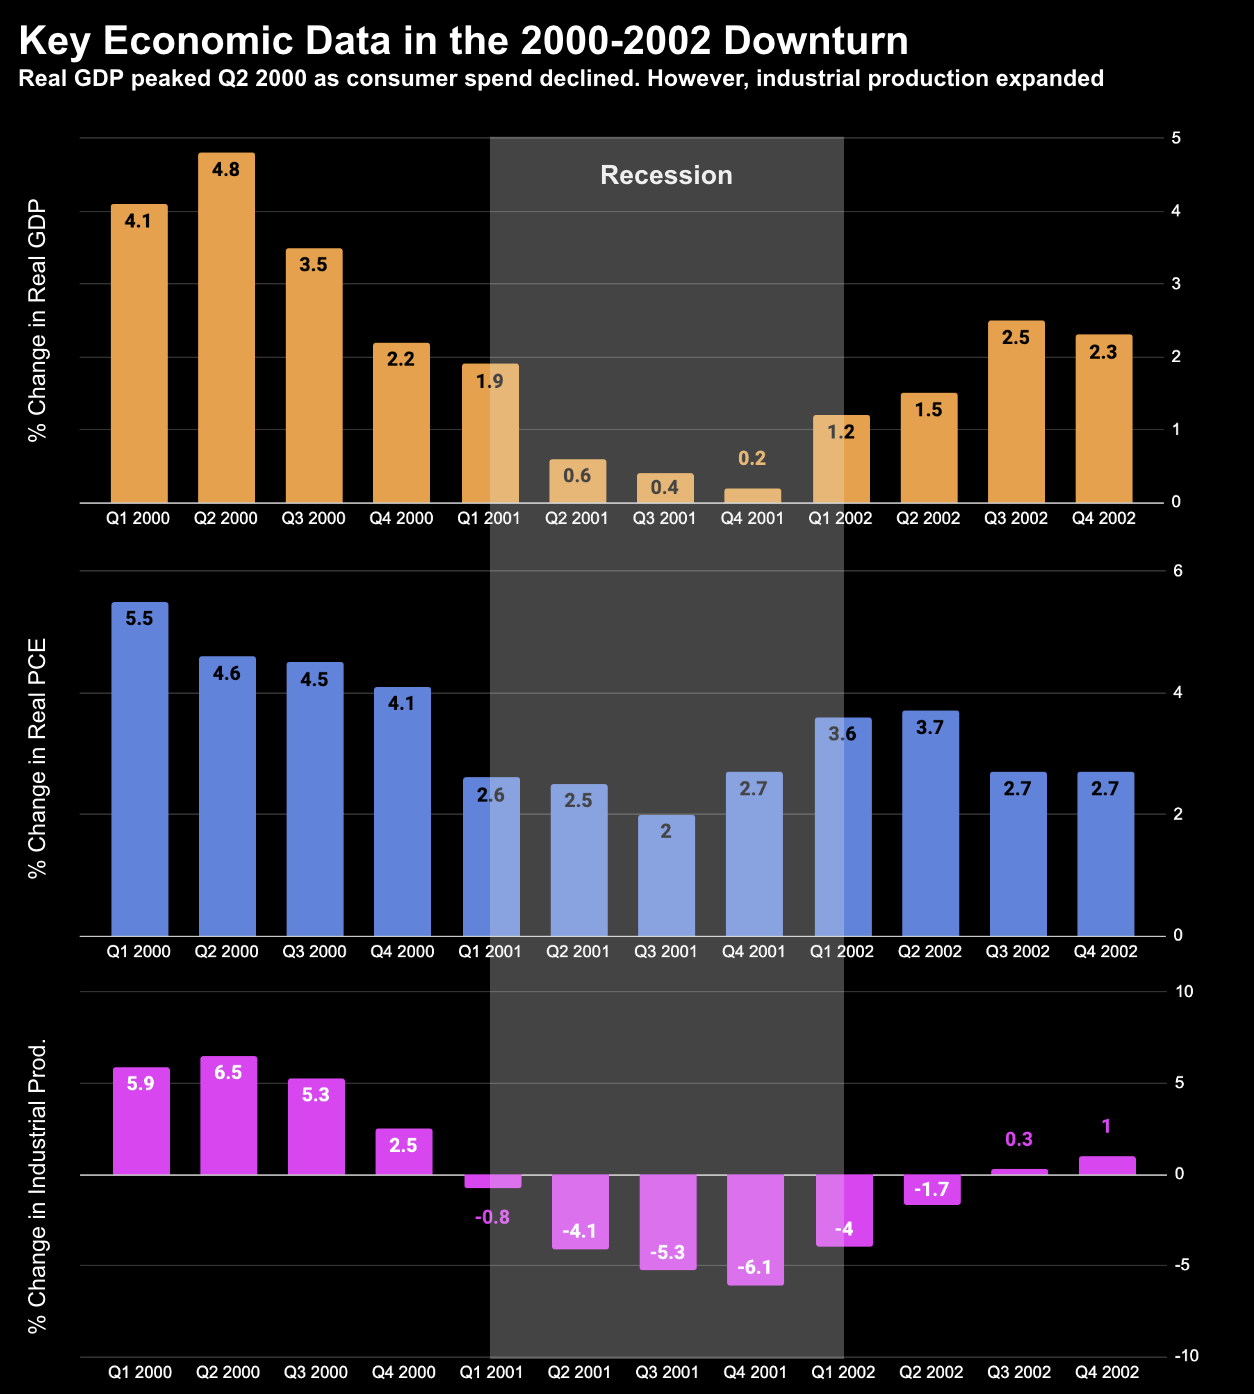
The first is what we saw with YoY percentage changes in:
(i) Real GDP; (ii) Consumer Spend (PCE); and (iii) Industrial Production
Real GDP expanded strongly through Q3 2000.
There was talk of a soft landing through Q4 2000 and Q1 2001 – with Real GDP slowing to 2.2% and 1.9% YoY
But what is most relevant is the declining growth trend in consumption (PCE).
Demand was falling despite industrial production rising – creating a mismatch in inventory (which would be subsequently cleared)
By Q4 2000 stocks had started to cool.
For example, at peak Real GDP, the S&P 500 traded around 1500 with EPS continuing to grow double-digits (as I will show below)
However, by Q4 2000 with Real GDP growth moderated to just 2.2% – earnings growth turned negative – and the S&P 500 traded lower by ~12%
Investors could have taken protection (or insurance) at this point with small losses (well ahead of the recession).
The subsequent ~50% fall in stocks was still to come – however the damage to the economy was already in place.
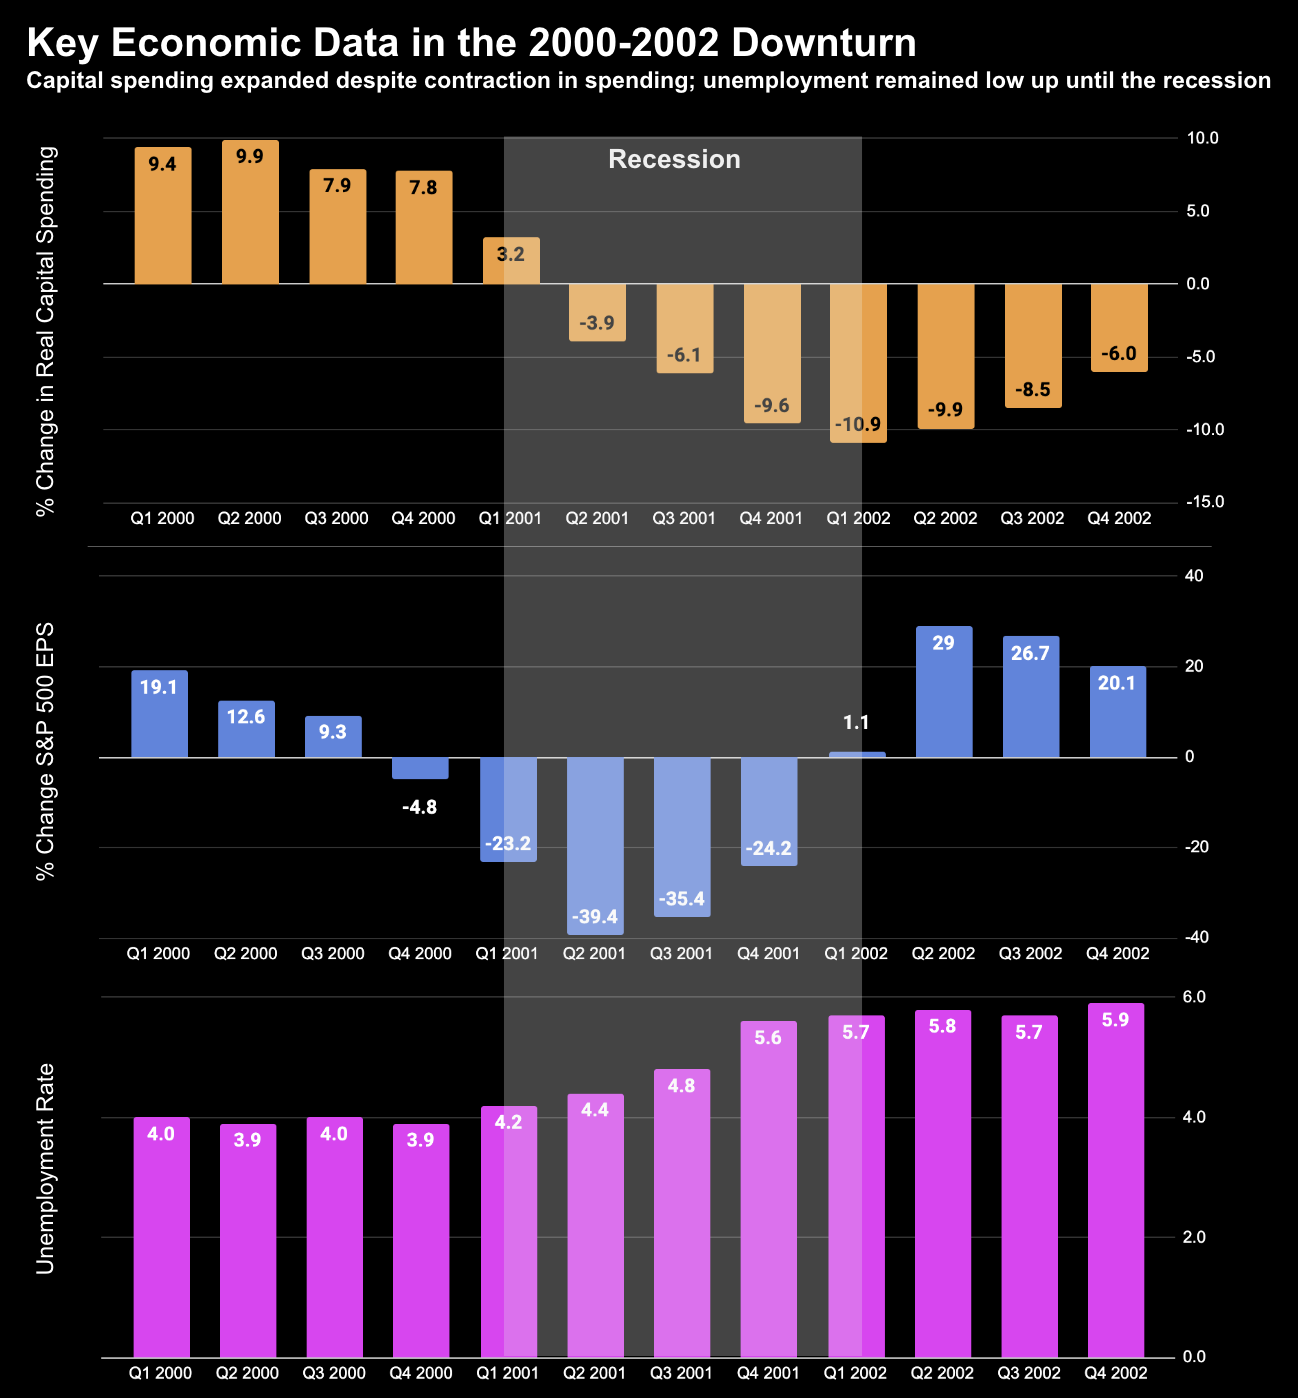
Let’s turn to the other three key trends over this period::
(i) real capital spending; (ii) S&P 500 EPS; and (iii) unemployment.
From mine, the key observation here is large expansion in capital spending through Q4 2000 (note – quite different to what we see today – where capex is slowing – which I will demonstrate further down).
Companies were late seeing the signals of weakening demand.
What’s more, note what we saw with unemployment. Not unlike today, there was full employment through Q1 2001.
I call this out as this is one the key arguments today for a soft-landing.
However, as the charts show above, unemployment is very much a lagging indicator.
When reviewing the downturn, Ellis states that although questions of impending recession began to be raised only in mid-2001 and later, a great deal of the setback to businesses and the stock market had already occurred in early and mid-2001.
He adds that mainstream debate as to whether it was going to be a recession or soft landing, came far too late to be of any use.
Investors were mostly caught off-guard.
The ‘real world’ was already feeling the impact of weaker consumer demand and business activity.
He adds that it was not until November 2002 that, evaluating newly restated economic data, the National Bureau of Economic Research determined that a recession of three quarters had, indeed, occurred during 2001.
The declaration of recession had value only as a post facto measurement of an absolute decline in the economy—the rather arbitrary “zero” dividing line between up and down.
Let’s now tune into today’s widely accepted “soft landing” narrative…
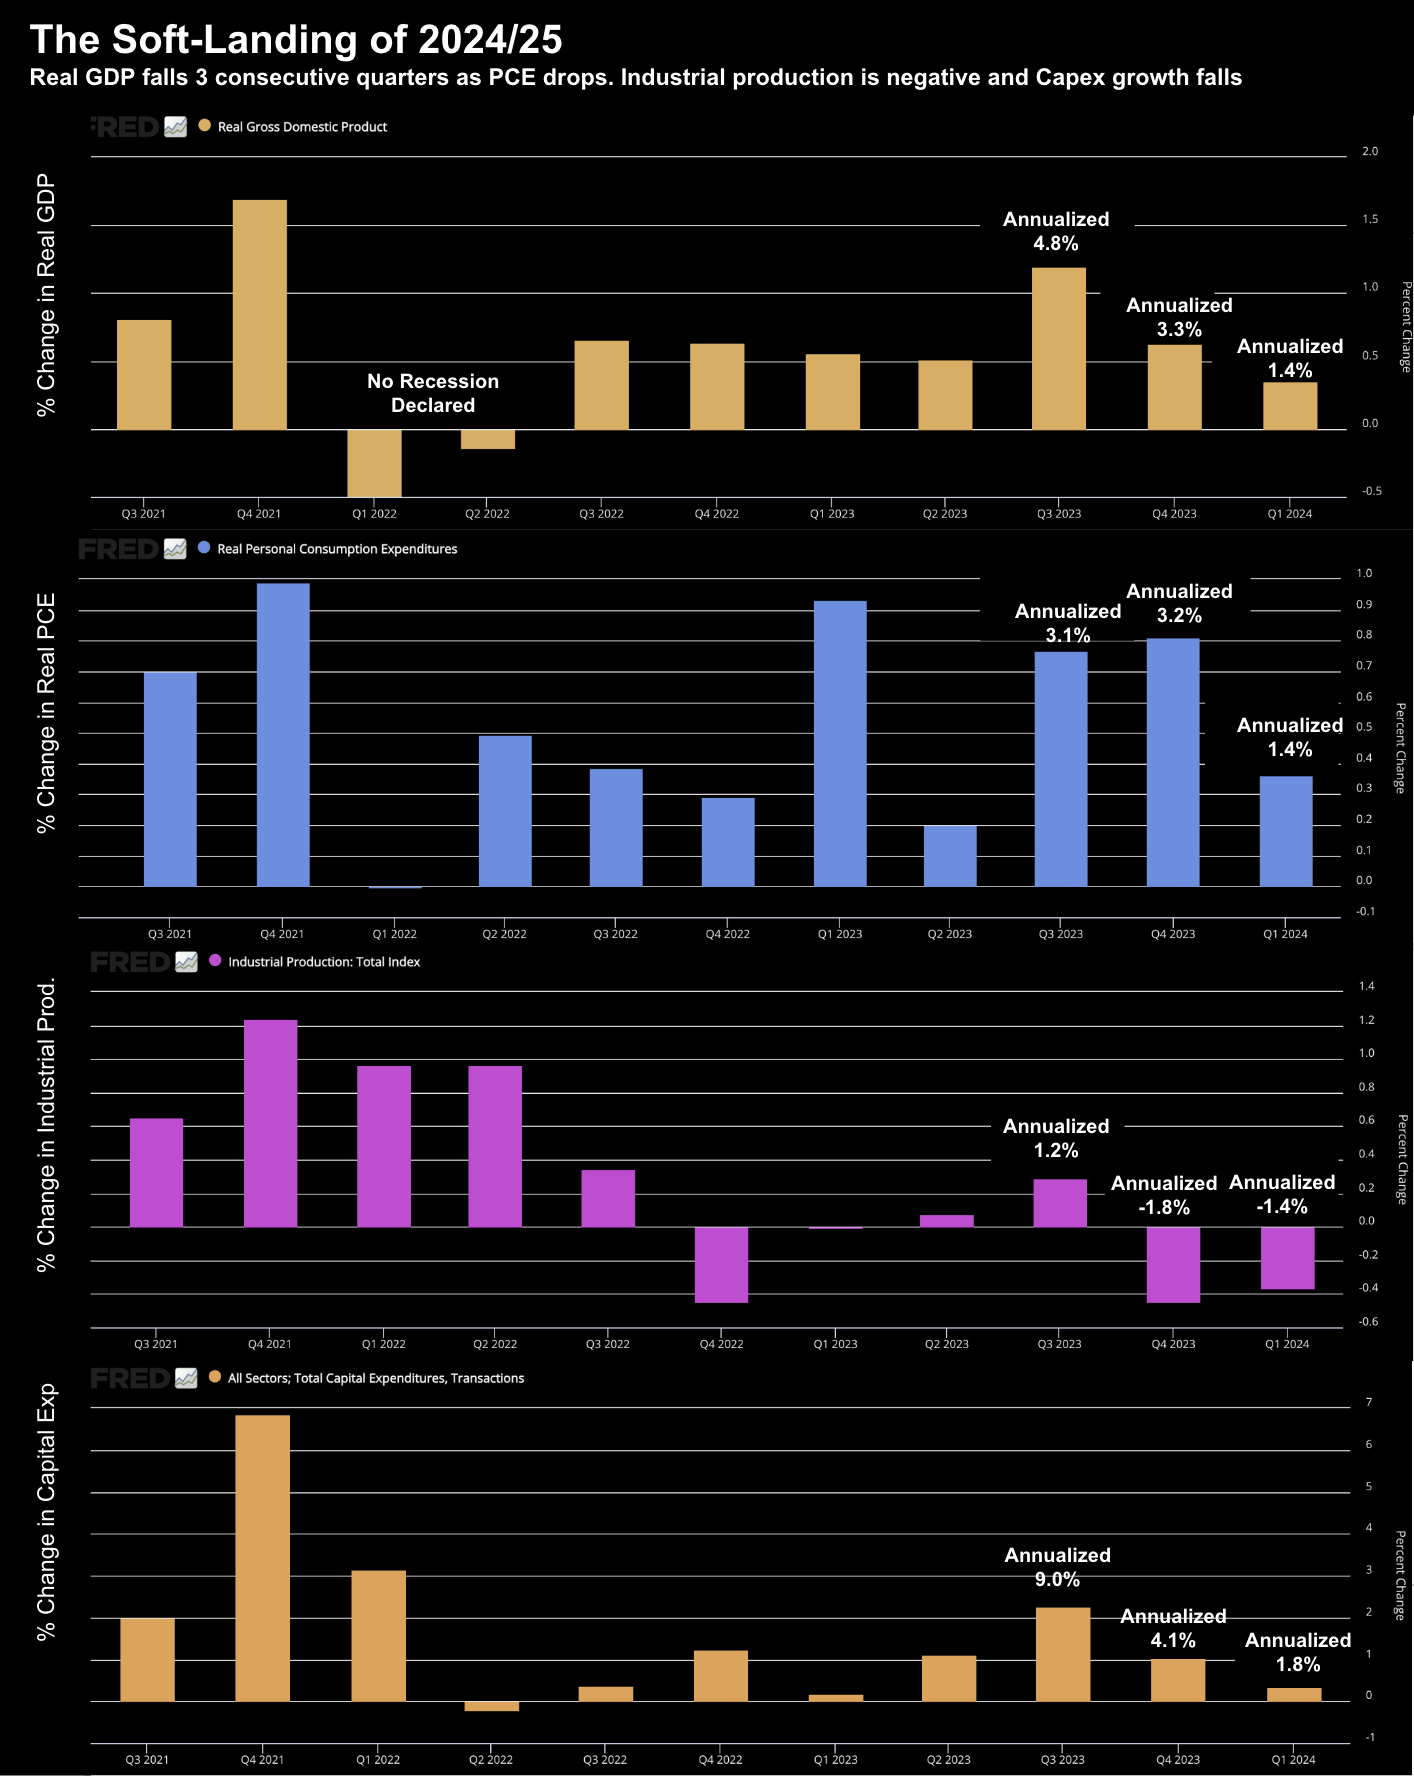
The Growth Slowdown of 2024/25
(i) Real GDP (first chart)
(ii) Real PCE (Personal Consumption Expenditures – second chart);
(iii) Industrial production (third chart); and
(iv) Capital expenditure (fourth chart)
July 4 2024
Note: you can obtain these real-time charts from the Fed. To replicate these charts:
- Change the reporting period to quarterly;
- Units to percentage change; and
- Change to “bar chart” in the format tab
From mine, the two most telling trends are what we see with Real GDP and PCE.
Real GDP dropped from 4.8% annualized in Q3 2023 – to 3.3% Q4 2023 – to just 1.4% Q1 2024
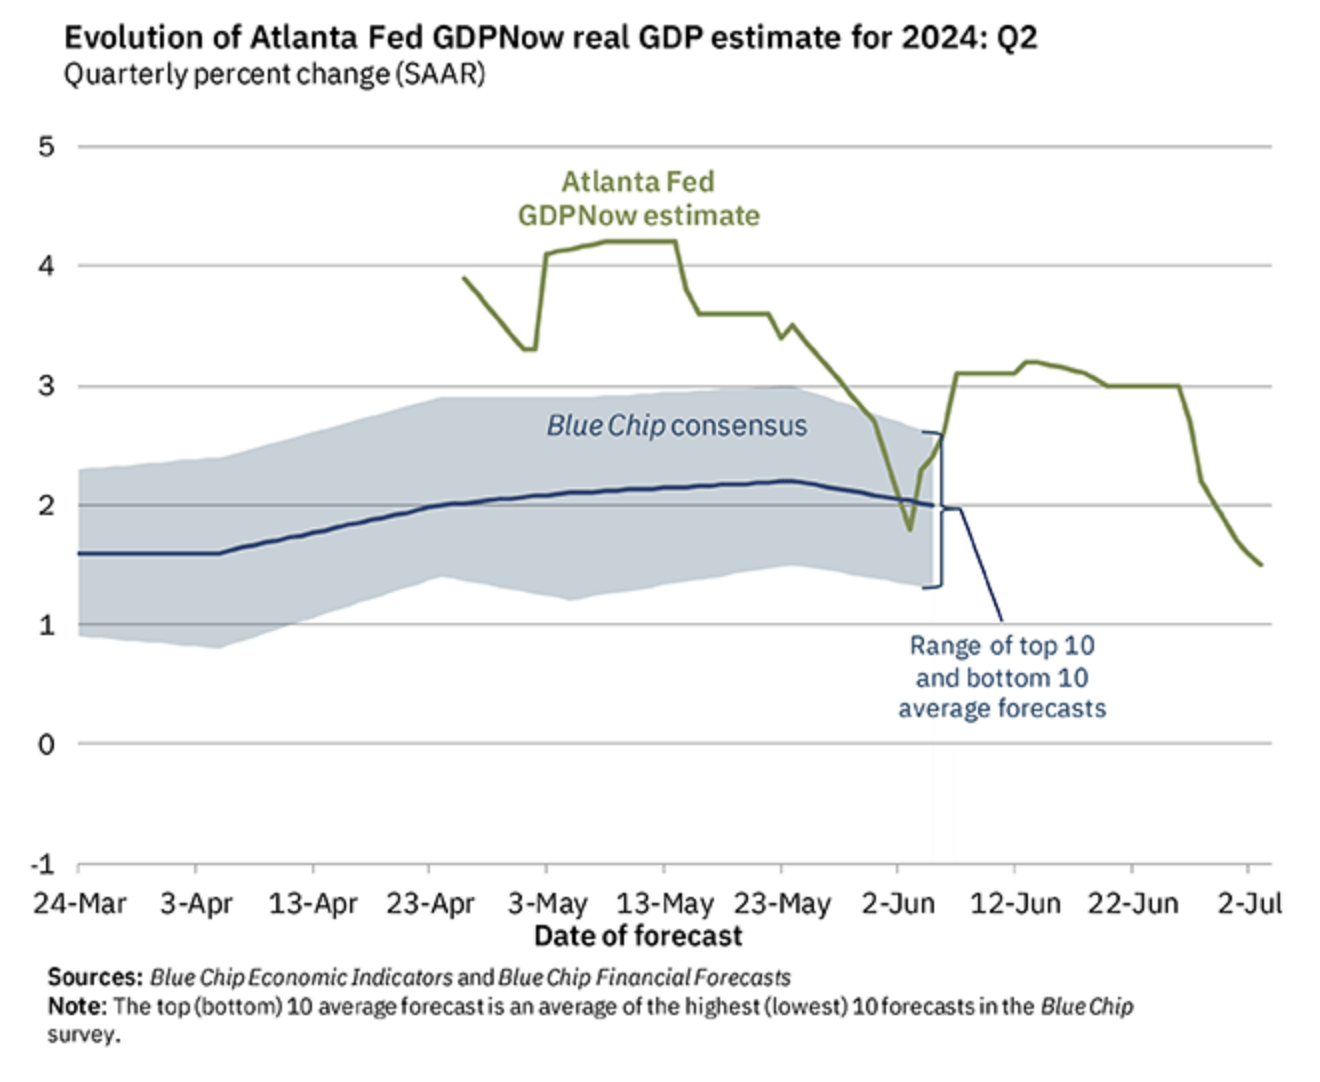
Fed forecasts for Real GDP Q2 are in the realm of just 1.5% (green line) – but note the trend from May.
With respect to the Real PCE – consumer spending – this has also dropped sharply at 1.4% annualized during the most recent quarter.
From mine, this echoes the caution we’ve heard from leading retailers such as Target, Walmart, Starbucks, Nike, Lowes and others.
Repeating some language from a previous post:
Walmart – their shares dropped over 2% this week after comments from CFO John Rainey at the Bank of America London Investor Conference spooked investors. Rainey warned that the current quarter’s sales won’t be as strong as those from the previous quarter and noted that the second quarter is the most challenging in terms of comparable sales. They added that shoppers are prioritizing buying food and health-related items over general merchandise, like home goods and electronics
Pepsi called out a weaker low-income consumer. They saw unit volume for its North American beverage business fall 5% in the quarter. “The lower-income consumer in the U.S. is stretched … [and] is strategizing a lot to make their budgets get to the end of the month,” CEO Ramon Laguarta told analysts on the company’s conference call in April.
Lululemon’s sales results lagged in its most recent quarter, which CEO Calvin McDonald attributed in consumers now being “more selective”
Starbucks announced a surprise decline in its U.S. same-store sales and lowered its full-year forecast, sending its shares tumbling. CEO Laxman Narasimhan gave a laundry list of factors explaining the weak quarter, including a more value-minded consumer
McDonalds – after three years of exceptional sales growth – said sales are normalizing. The Chicago burger giant said it expects its same-store sales — or sales at locations open at least a year — to rise 3% to 4% this year, which is in line with historical averages. That’s down from double-digit gains in 2021 and 2022 and 9% growth last year. Their CEO warned “consumers continue to be even more discriminating with every dollar that they spend as they face elevated prices in their day-to-day spending.”
Nike saw its worst trading day since its 1980 IPO – crashing 20% – as the CEO warned of a 10% decline in sales.
With respect to Industrial Production – this has been negative for the past two quarters.
This Index refers to the output of industrial establishments and covers sectors such as mining, manufacturing, electricity, gas, steam and air-conditioning.
One might argue this segment of the economy is already in recession.
Finally, with respect to Capital Expenditures, this too is declining perhaps in response to falling demand.
I think this augers for less output in subsequent years… however the positive is companies are responding with the falling demand signals.
This is a good thing as the adjustment of inventory is less painful.
So Where Are We?
Given we know most of the economic damage occurs in Stages 2 and 3 – where do you think we are in the economic cycle?
If you’re like me – I think we have moved beyond peak growth (Stage 1)
For clarity, that’s not to say:
- Earnings will not continue to expand (they most likely will)
- Capital spending could grow; and
- Unemployment to stay low.
As we have seen previously – these are likely during the second stage.
However, robust employment and earnings will only reinforce the soft-landing narrative.
But from mine, it would be remiss to ignore the pain being felt by the consumer and slow down in consumption.
Soft-landings can be damaging to portfolios… especially with valuations priced to perfection (e.g., north of 20x fwd PE’s).
And should a soft-landing deteriorate into a recession – if you’re not hedged or protected – the impact can be devastating.
Putting it All Together
- People feel okay about the economy (although consumer sentiment is at 3 year lows)
- Most people have jobs (but inflation is hurting middle to lower income cohorts)
- Corporate profits are expanding – with expectations of 13% growth next year; and
- GDP remains positive (although weakening)
Equally – this has also been an oversight for many who fail to forecast the impact of slowdowns.
This was the same script in the year 2000 and 2007.
My caution to investors here is paying forward PE in excess of 20x (where long-term risk free rates are north of 4.0%) doesn’t not leave much room for error.
By way of example, economic slowdowns that failed to reach recessionary proportions saw market declines of 15% or more in 1953, 1956-1957, 1962, 1966, 1984 and 2022.
We are yet to see a meaningful correction in speculative assets despite the clear slowdown in growth and personal consumption.
For what it’s worth – I am about 65% long and 35% cash.
This is about as defensive as I can be – as I will always have long exposure (even through the worst of times).
However, I’m not increasing my exposure to higher multiple names (specifically tech).
As I’ve explained in previous posts, I think there is better long-term risk reward in other areas.
But they are long-term (3-year) bets…
I would not be surprised to see all stocks in my portfolio suffer a 10-15% decline in the second half.

