- Why buying the VIX above 45 adds up to compelling long-term returns
- A challenging market to navigate… assessing my YTD performance
- Volatility far from over in 2022
Earlier this week (March 15) I issued a post which was likely to make me look foolish… not for the first time!
I said “markets look poised for a near-term bounce”.
We got it. Call it luck.
It’s impossible to know what markets will do from one week to the next – however a bottom felt ‘close’.
The very next day markets had their best day in months.
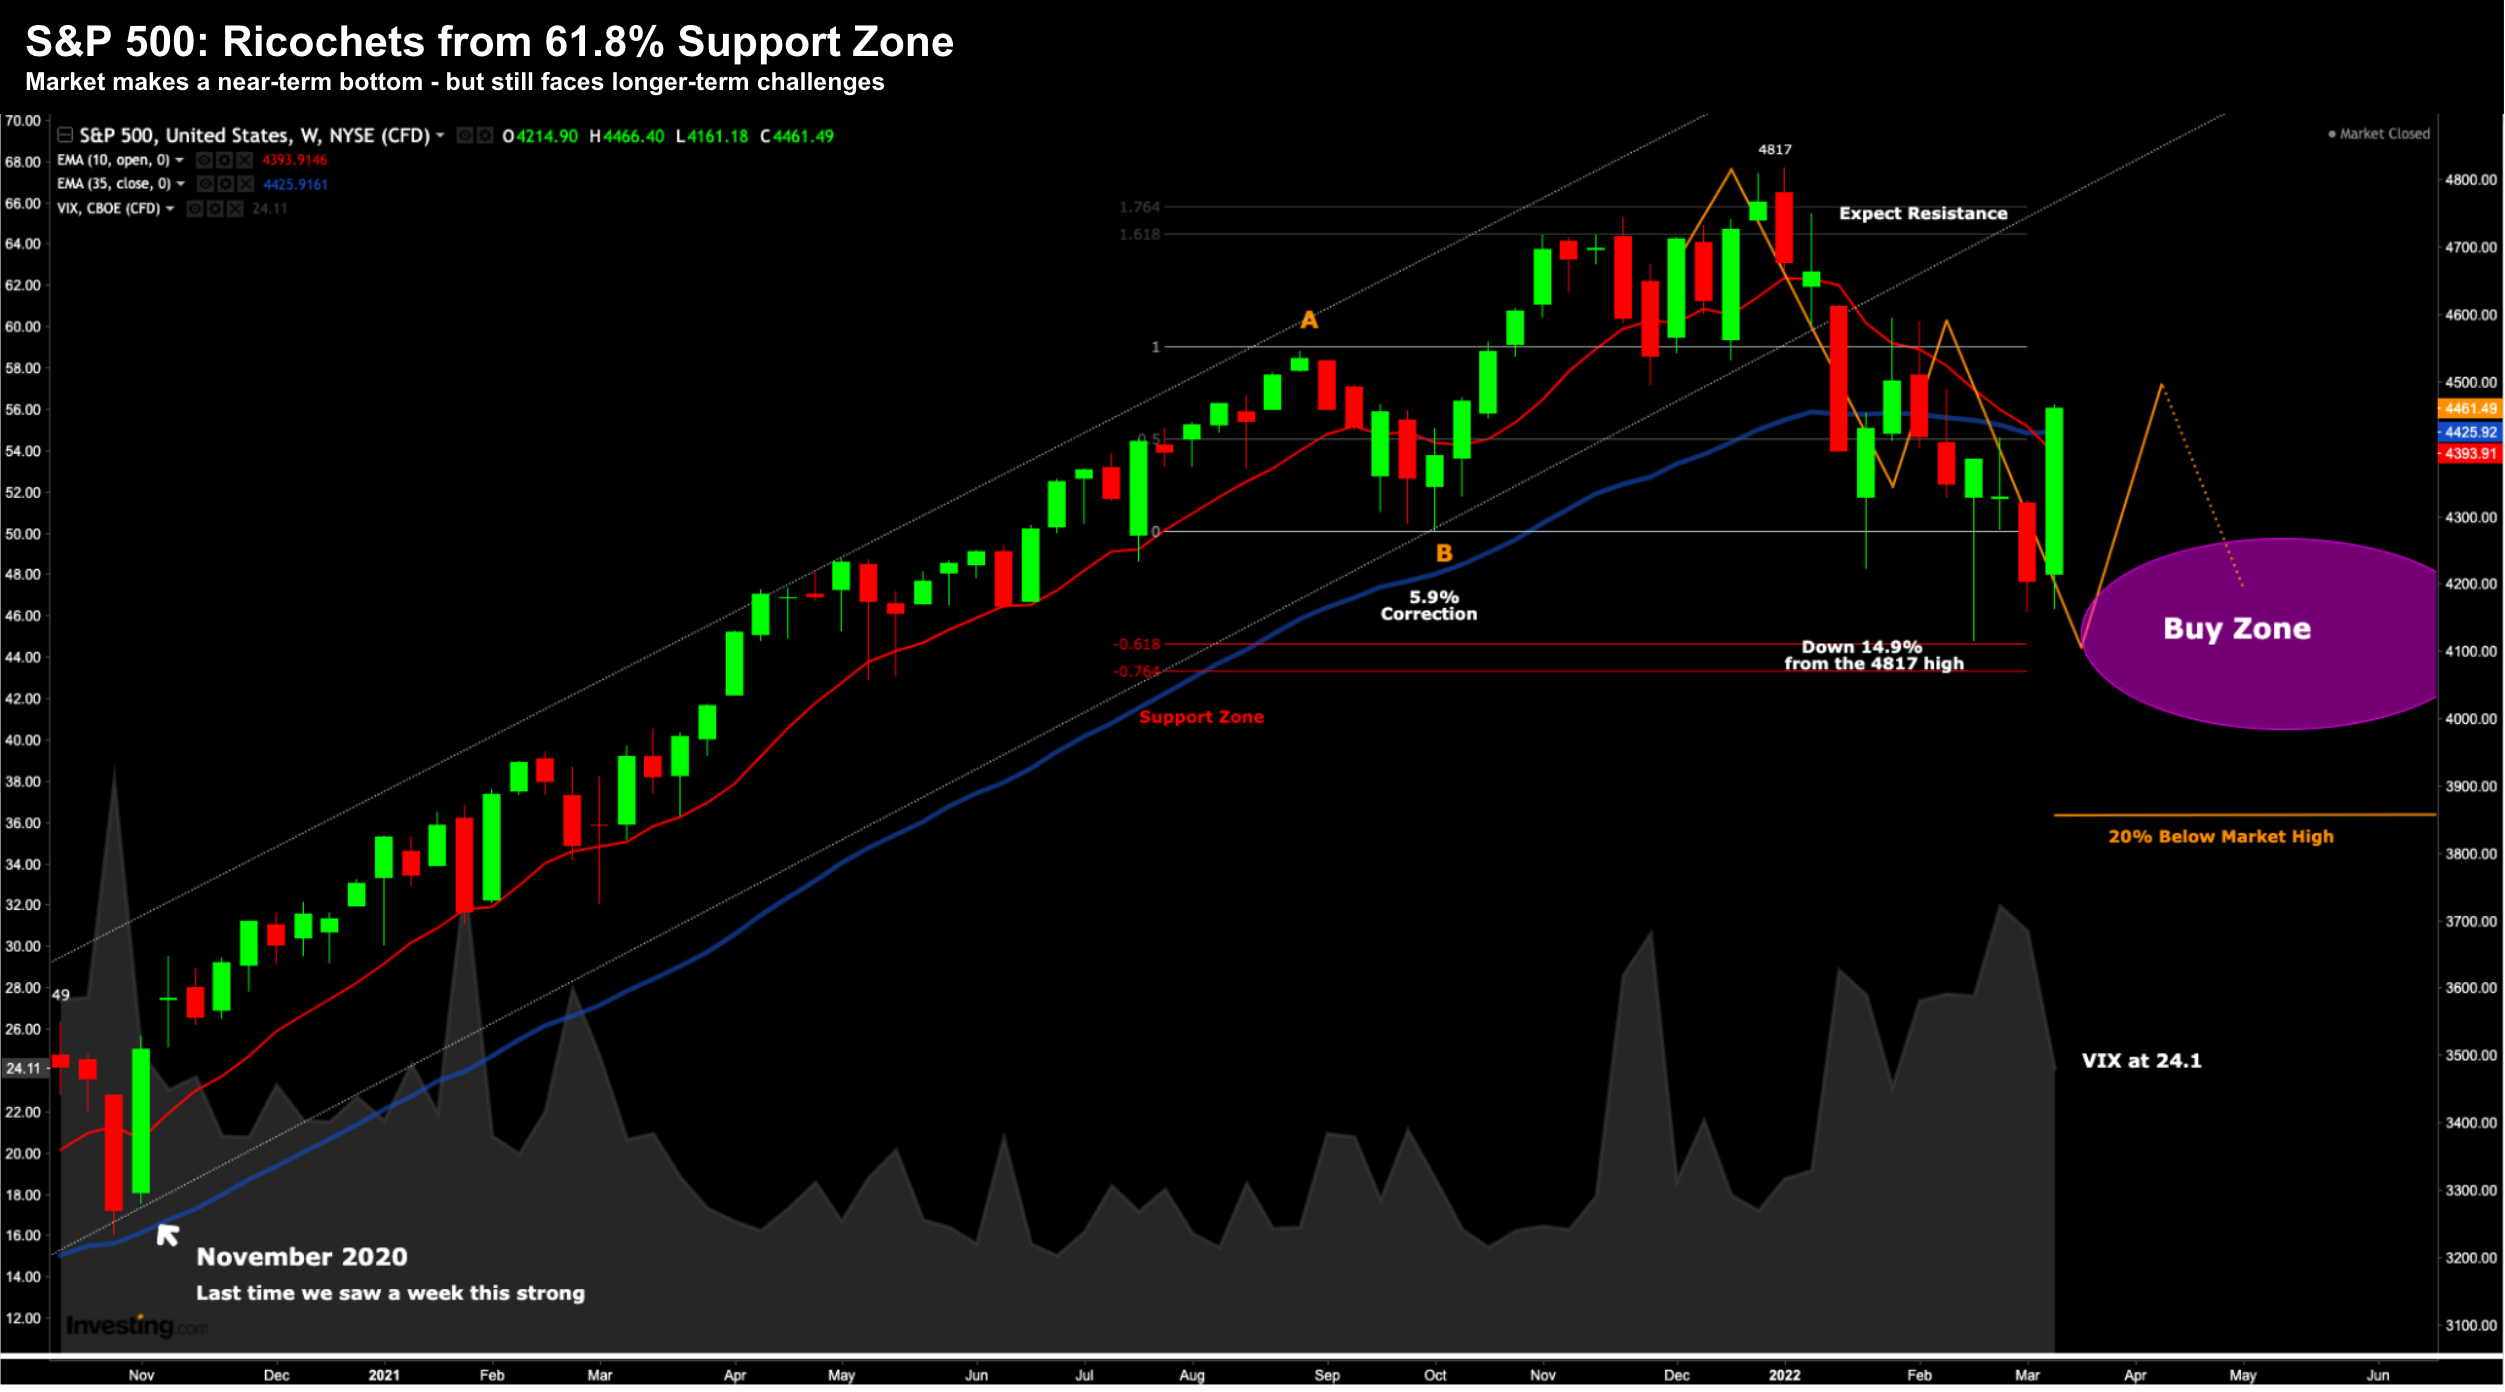
What’s more, this week was the S&P 500’s strongest week since November 2020
It was a massive week for the bulls – pushing the Index back above the all-important 35-week EMA.
It will be very important this level (4400) is sustained next week.
For example, another strong week will be very bullish.
Here’s the weekly chart:
March 18 2022
Things have been trading largely ‘per the script‘ since we closed 2021; i.e.,
- Q4 I was calling for expected resistance around 4800 (i.e., 61.8% outside our retracement A-B). My approach was to lighten positions opposite a likely (buyable) correction in early in 2022;
- Q1 saw a 14.9% correction – where I was targeting something in the realm of 10-15%;
- From there – I was looking for support around the zone of 4100 and a near-term rally…
So far so good…
The market ended 2021 at 4766. After this week’s close, the S&P 500 is down 6.4% year to date.
However, some sectors of the market have been hit a lot harder than others.
For example, many high-revenue-multiple / low-to-no earnings names are 50%+ off their 2021 highs.
I warned readers of these risks last year throughout Q3 and Q4 (see here)… repeating my language from Dec 20:
In this environment, the ability for companies to grow income streams will be critically important.
To that extent, those companies which have strong cash flows today will likely outperform stocks that “promise” cash flows in the future.
This will be the theme next year (and potentially beyond pending rates).
More speculative companies which have cash flows weighted to the future will come under a higher level of scrutiny; and from mine, many of these names still have a long way to fall.
In this case, a “long way to fall” has been anywhere 60% to 80% for some pre-pandemic darlings. For example, Cathie Woods’ ARKK ETF is still down more than 50% of its high…. despite catching a small bid this week.
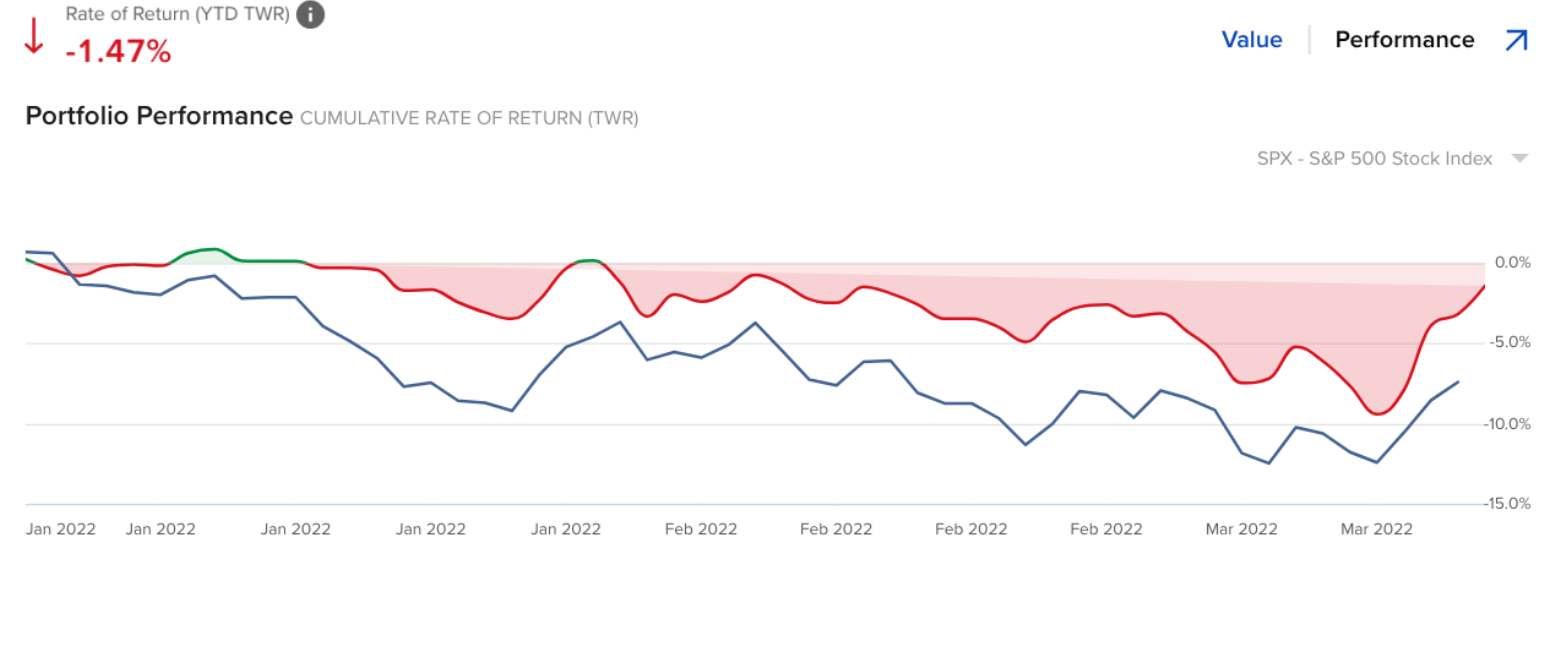
On a personal note, my own portfolio is down 1.47% (in red)… which is approx 5% better than the S&P 500 (in blue):
My performance is down due to exposure to large-cap tech (which remains well off its highs) – not to mention names like SNOW, DASH and PYPL also under pressure.
But the S&P 500 is always your benchmark.
As I was saying recently, if you can’t consistently beat the benchmark year-in-year out (e.g. 5+ years) – you’re better off just buying an Index ETF.
Now recent additions to my portfolio like Shopify (up ~49% since my entry); and Amazon (adding it at ~$2725) saw my portfolio get a small bump this week.
Tech was back in favour (for now).
But I don’t pay too much attention to week-to-week moves – as I view these as long-term (multi-year) holdings (on the basis they continue to grow revenue, earnings and free cash flow).
However, the past two-three weeks did have me asking a question…
When do you buy extreme volatility?
For example, I can tell you when things appear oversold (and overbought) – but they can last that way for months!
And when they are low… they tend to go even lower.
So what gives one the confidence to step in a “buy a Shopify” or simply the Index itself when things are falling like a knife?
A few answers came to mind (e.g. how to evaluate a company; the total addressable market; its free cash flow (my favourite metric); balance sheet; business model etc; or understand the technicals etc) — but I wanted to look at another potential contrarian indicator.
And it’s the VIX… otherwise known as the “fear index”
The results were surprising…
When to Buy Fear?
Warren Buffett is famous for saying “buy when others are fearful… sell when others are greedy”
Needless to say, when stocks lost 15% in the first quarter of 2022… yes… it was full of fear!
Not surprisingly – Buffett was buying – investing something like $6 Billion into Occidental Petroleum (OXY)
Again, I was also happy ‘holding my nose’ and adding to quality names (eg Amazon, Shopify, Meta to name a couple)
But let’s talk to my contrarian indicator…
I decided to run a backtest from 1991 – buying the S&P 500 when the VIX hit the either (a) 35; and (b) 45
The greater the VIX – the higher the fear.
From there, I wanted to measure cumulative returns (and CAGRs) over the following four durations:
- 6-months; 1-year; 2-years and 3-years.
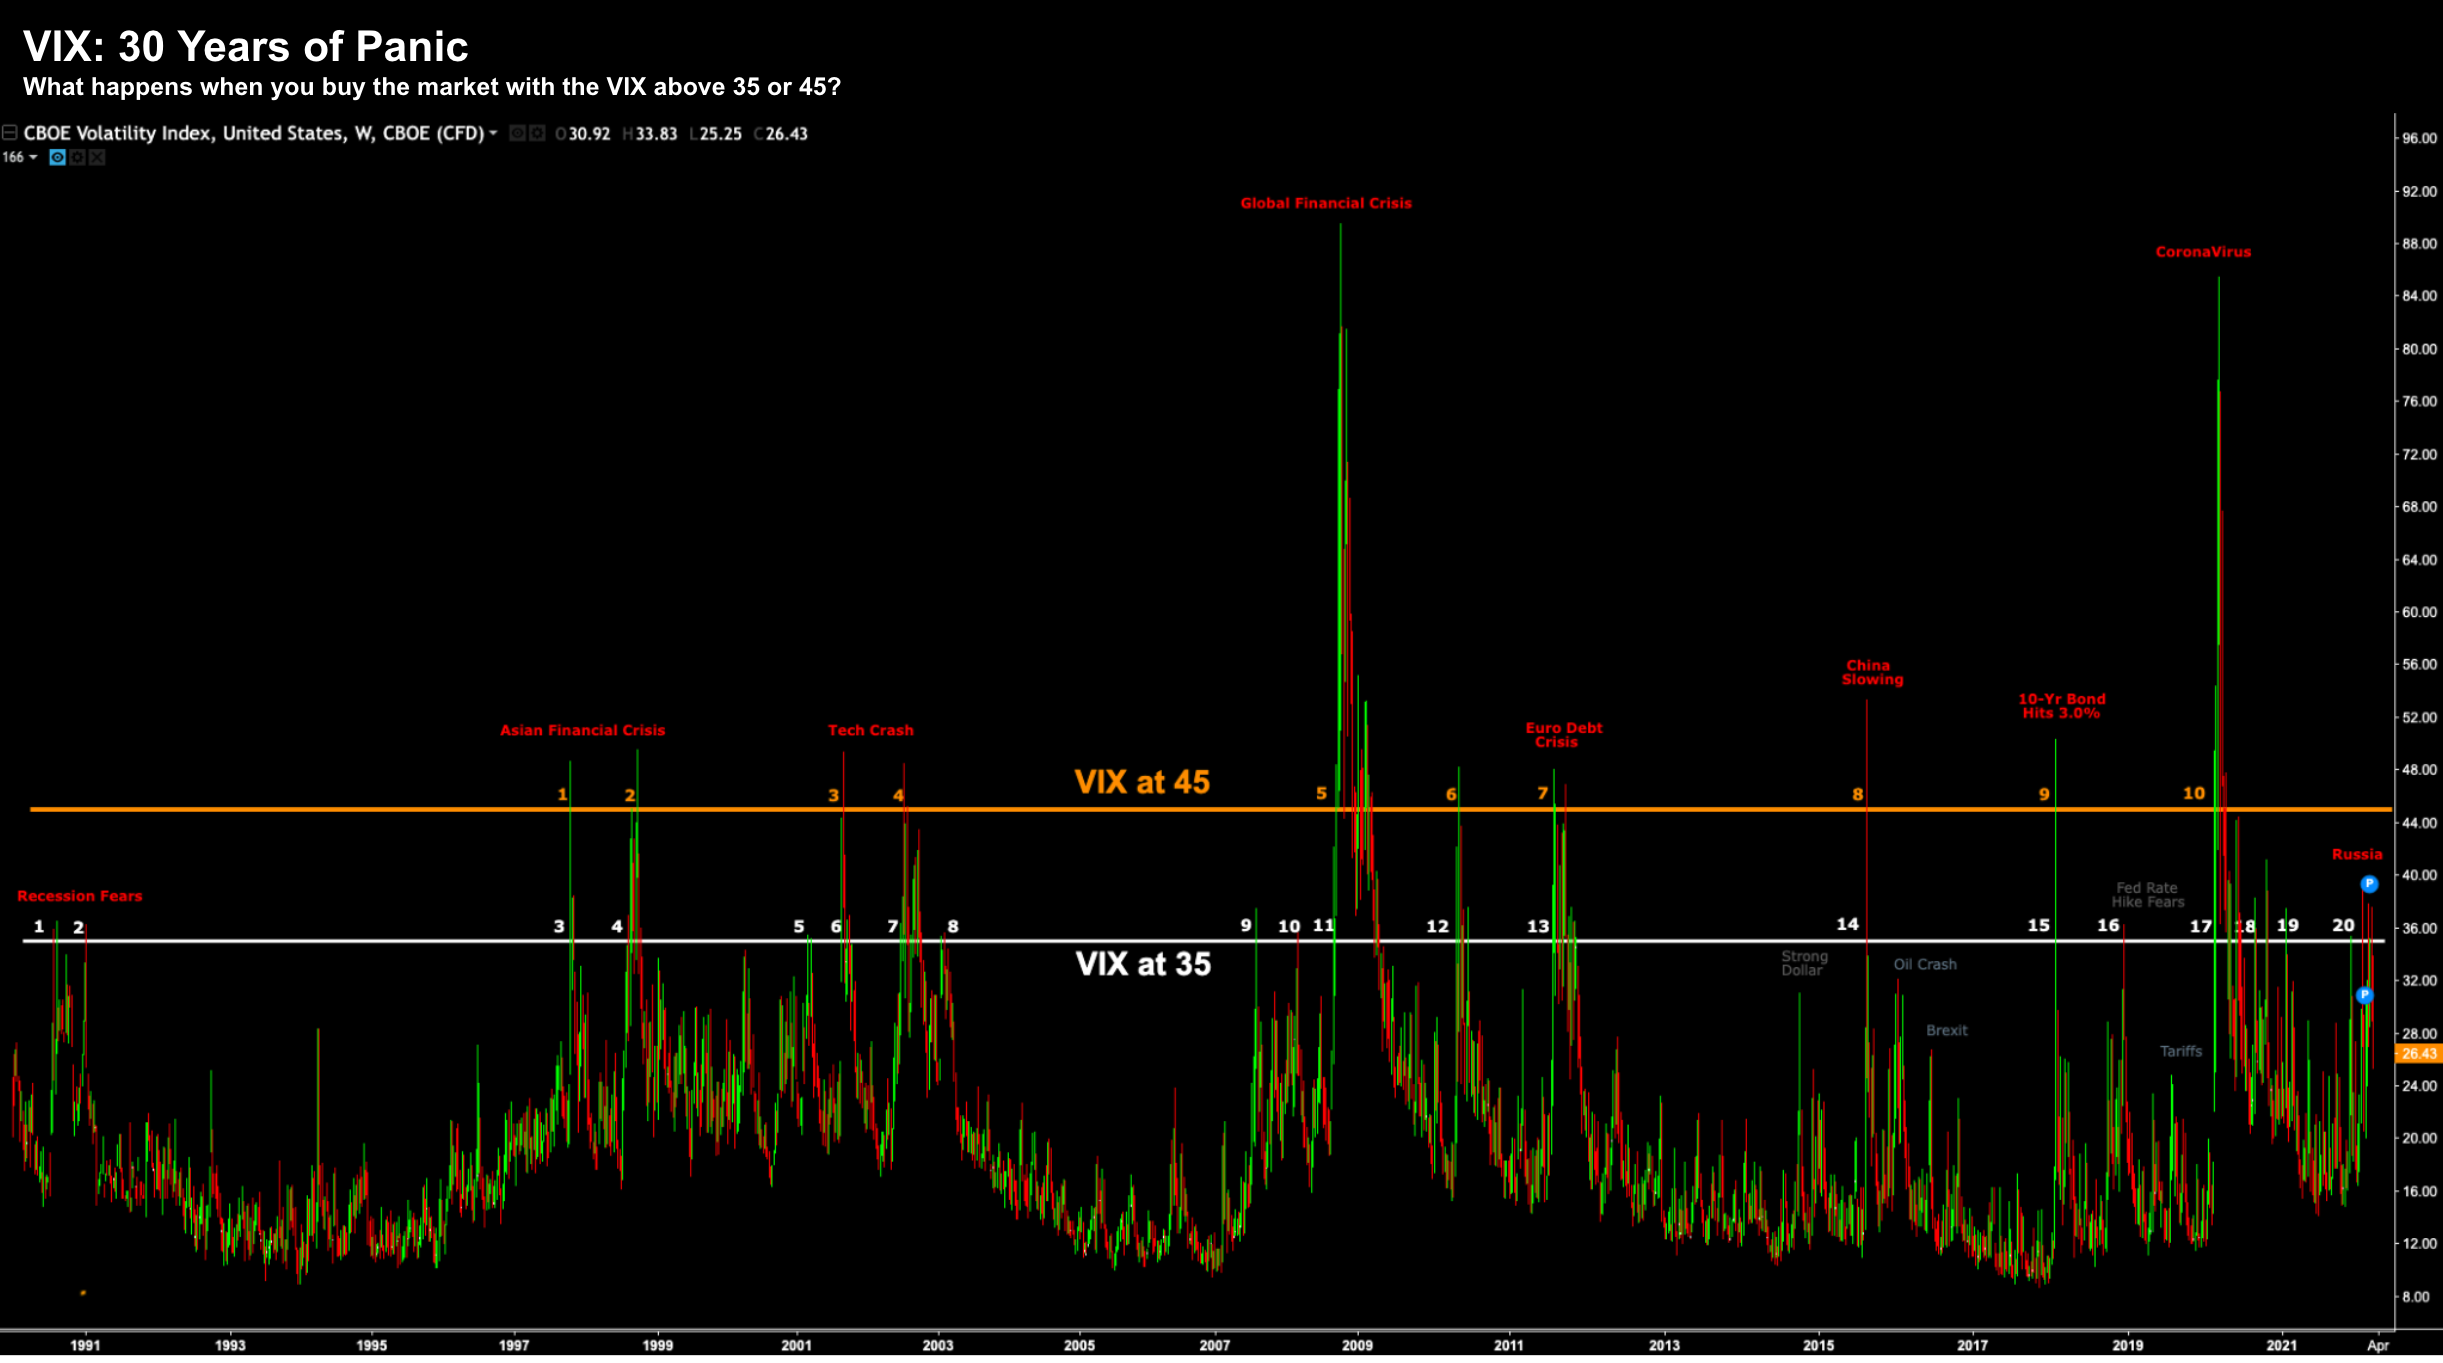
But first, let me share an annotated weekly chart of the VIX over the past 30 years (click to enlarge):
March 18 2022
I’ve labelled the 9 major crisis to grip markets from 1991:
- Recession of 1990/91
- Asian Financial Crisis of 1997
- Tech Crash of 2000/01
- Global Financial Crash of 2008/09
- European Debt Crisis of 2011
- Fears of China Slowing in 2015
- US 10-Year Bond Yields exceeding 3.0% in 2018
- Global Pandemic of 2020; and most recently
- Russia’s invasion of the Ukraine and Oil Shock
Other minor panics included (but not limited to):
- Stronger US Dollar late 2014
- Oil Crashing in 2016
- Brexit in 2016/17
- Fed Rate Hike Fears in 2018
- Trump’s Tariffs in 2018
All of these events saw the VIX surge beyond a level of at least 35.
When the VIX trades above this level (most of the case for Q1 2022) – the S&P 500 typically moves at least 2% in any one day.
Now labelled on this chart are two horizontal lines:
- White – where the VIX exceeded 35
- Orange – where the VIX exceeded 45
Let’s now review what happens if you “held your nerve” and bought when almost everyone else was liquidating.
Buying S&P 500 with the VIX at 35
First, let’s review the results buying the S&P 500 when the VIX crosses above 35.
Here we find 21 occasions:
(Note: at least 3 months time needs to pass between each trade to avoid short VIX whipsaws)
March 18 2022 – Click Chart for a Larger View
The first three columns show the date and S&P 500 value when the VIX exceeded 35.
From there, I have grouped the various durations (with CAGRs for Years 2 and 3).
On average, returns were generally higher over each of these periods.
However, highlighted in red are exceptions (notably #5 and #9 over 3 years – both negative)
For example, during the two big recessions of 2000 and 2008 – it paid to wait until we saw greater capitulation (which overlaps with the second test of waiting for the VIX to trade at 45)
For example, if buying in 2001 with the VIX at 35 (entry #5) – returns were still slightly negative 3 years later.
And if buying at #9 (entry Aug 13 2007) – the return over 3 years were -25.7%
On both of these occasions – it paid to wait.
However, entry #9 was the exception. If we look at the averages (bottom rows) – they were quite positive:
The Ultimate Contrarian Signal: VIX at 45
Here’s where things get more interesting…
When the VIX is trading at 45 – it’s generally outright panic.
Typically people are selling in fear – worried they will lose everything.
Stocks are in free fall…
To give you an example, the VIX has “only” traded around 39 this crisis… close to panic but not quite at 45.
Let’s review the results over the same durations:
March 18 2022 – Click Chart for a Larger View
“Peak fear” is less common – only 10 occasions the past 30 years.
But on average, it’s a ‘buy signal’ every 3 years.
And personally, I think we will get another entry at some point in 2022 (with the catalysts such as consistent high inflation; aggressive Fed hikes; and the onset of quantitative tightening)
But let’s compare the returns (summarized below):
TL;DR is buying during “peak fear” (VIX > 45) has proven to be very profitable across every timeframe.
For example:
- After 6-months – average return was 9.4%
- After 1-year – average return was 14.2%
- After 2-years – average return was 29.9% or a 13.7% CAGR exc. dividends.
- After 3-years – average return was 39.8% or a 11.5% CAGR exc .dividends.
Let me illustrate one example:
If buying during the Euro Debt Crisis (Aug 08 2011) – the 3-year CAGR was a 20% exc dividends.
Just for fun…
And if you held that position through to today – your CAGR would be 14.1% exclusive of ~2.5% dividend.
Where CAGR = (4463 / 1119) ^ (1 / 10.5) – 1
- 4463 – S&P 500 close today
- 1119 – S&P 500 close at Aug 08 2011
- 10.5 – number of years holding the position
By way of comparison, the CAGR for Berkshire Hathaway (BRK) over the same period (i.e. Aug 2011 to today) is 16.9%
BRK famously doesn’t pay a dividend…
That’s what I consider a pretty solid contrarian indicator.
Which Brings us to Today…
During the first quarter of 2022 – we saw the VIX hit a level of around 39
March 18 2022
As mentioned in my preface, I was adding to some quality positions the further the VIX went up.
Some traders could not want to offload these (strong cash flow and revenue) stocks… I was there picking them up.
This week – those positions rallied hard (e.g. Shopify 43.3%; Amazon 10.8% and Meta 15.4%)
The question is whether the volatility is finished?
I don’t think so…
In fact, I still think the market is somewhat (long-term) complacent on the risks coming down the pike.
And whilst I am quite long – I maintain a reasonable amount of cash waiting for greater panic.
If I am to guess… that panic will come in the form of sustained unwanted inflation and aggressive Fed tightening.
Putting it all Together
“Buy when others are fearful and sell when others are greedy”
That’s Buffett’s motto.
There was ample fear this quarter given the horrific war in Europe; fears of aggressive tightening from the Fed and uncomfortable levels of inflation.
Two weeks ago, it was the highest we’ve seen the VIX since November 2020.
The S&P 500 Index lost almost 15% in quick time.
However, it meant certain quality stocks were on sale (if your view is longer-term).
From mine, this long-term analysis proves that if held over the long-term (e.g. a minimum of 2-years) – buying “peak fear” has its rewards.
For example, a CAGR anything north of 10% plus dividends exceeds that of the 50-year S&P 500 average (i.e. 10.5% inc dividends).
And if we are lucky enough to see the S&P 500 fall below 4,000 – there’s a good chance the VIX will be trading near this level (where I will be a buyer for the long-term).
Before I close, if you wish to follow a sample portfolio I’ve put together (30 stocks) – I have made it available here (as part of my overdue website refresh)
As of March 4 – I will be tracking these positions week-to-week against the Index for a year.
Each quarter I will make amendments to the position sizing / allocation (i.e. only 4 updates per year). It’s meant for demonstration purposes – illustrating how I go about portfolio position sizing (very important) and what I consider quality stocks.
After two weeks, my sample portfolio is up 6.24% vs the S&P 500 up 3.12%
The goal is to beat the S&P 500 for the year.
Let’s see where we are after 52 weeks… it promises to be fun!


