- Bond yields are surging – but do you buy now?
- One key signal to potentially help time your entry; and
- Is the long-term correlation b/w bonds and gold broken?
Treasury yields are surging…
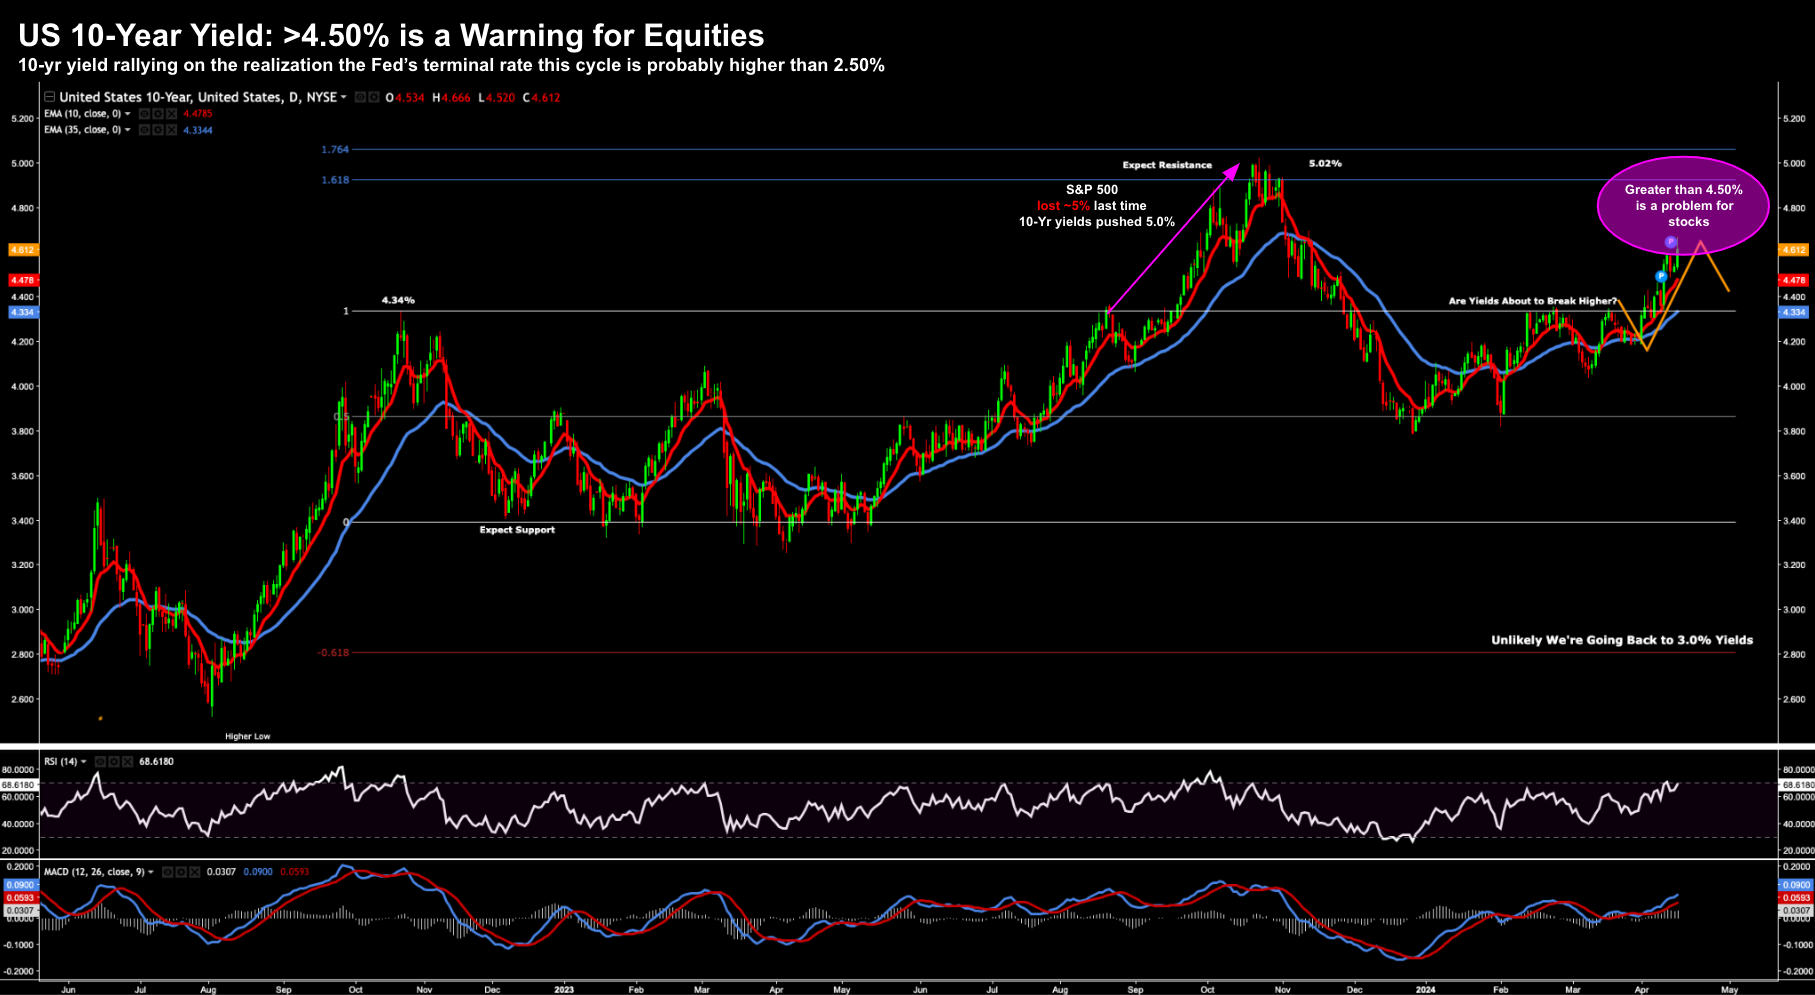
The U.S. 10-year treasury – a rate which every financial asset is tied to – has ripped back above 4.60%
Credit card rates, home loans, auto loans… you name it… have all increased.
The last time UY.S. 10-year yields traded above 4.60% – the S&P 500 was ~20% lower.
From mine, the divergence is a head-scratcher… but here we are.
However, what I can say is risk assets have a tougher time advancing when yields push beyond this zone.
So why is the 10-year rising?
Some quick thoughts:
- prospect of stronger than expected economic growth;
- a torrent of government debt to be financed (~$1.6T more this year);
- higher than expected inflation; and
- the Fed less likely to cut rates three times this year (the market expects two at most)
All of these are valid reasons for higher yields.
But from mine, the primary reason the market is now pushing up yields is the expectation of a higher terminal rate (vs what was previously expected)
In other words, where rates ultimately find their floor.
For example, for sometime that rate was expected to be around 2.5%
But given the data of late (e.g., employment, inflation, spending asset prices) – reality is that number if likely to be higher – perhaps closer to 2.75% or 3.00% (at a guess).
Powell just doens’t like to admit (as he’s a closet dove)
This is the question markets now find themselves wrestling with.
Let’s look in more detail… as it could spell opportunity for investors.
U.S. 10-Year Yield Surges
Below is the weekly chart for the 10-year yield over the past two years:
April 15 2024
The last time 10-year yields traded at 4.60% was October last year.
At the time, the S&P 500 retreated from levels of around 4600 back to 4200.
However, equities were able to catch a bid when yields retreated.
But here’s the thing:
Despite the 10-year rallying back to 4.60% – equities are now valued at 20% more.
Why?
As I say, this is unusual.
Call it the “AI” bubble… who knows?
When yields rise this much – generally future cash flows of companies are discounted.
But this is not what we have seen.
In fact, what we’ve seen is strong multiple expansion.
In other words, investors are paying up (handsomely) for risk assets (especially anything with “AI” in its remit).
To that end, this puts a lot of pressure on earnings.
For example, with earnings expect to grow between 11% and 12% this year (e.g., $245 per share for the S&P 500) – it suggests a forward PE of ~21x
That’s not cheap. Quite the opposite.
But today’s exam question is not whether equities are a good bet around 5100… I don’t think they are.
The question is where should investors think about adding bond exposure given the attractiveness of long-term yields?
From mine, the answer could rest with the yield curve.
The “Un-inversion” of the Yield Curve
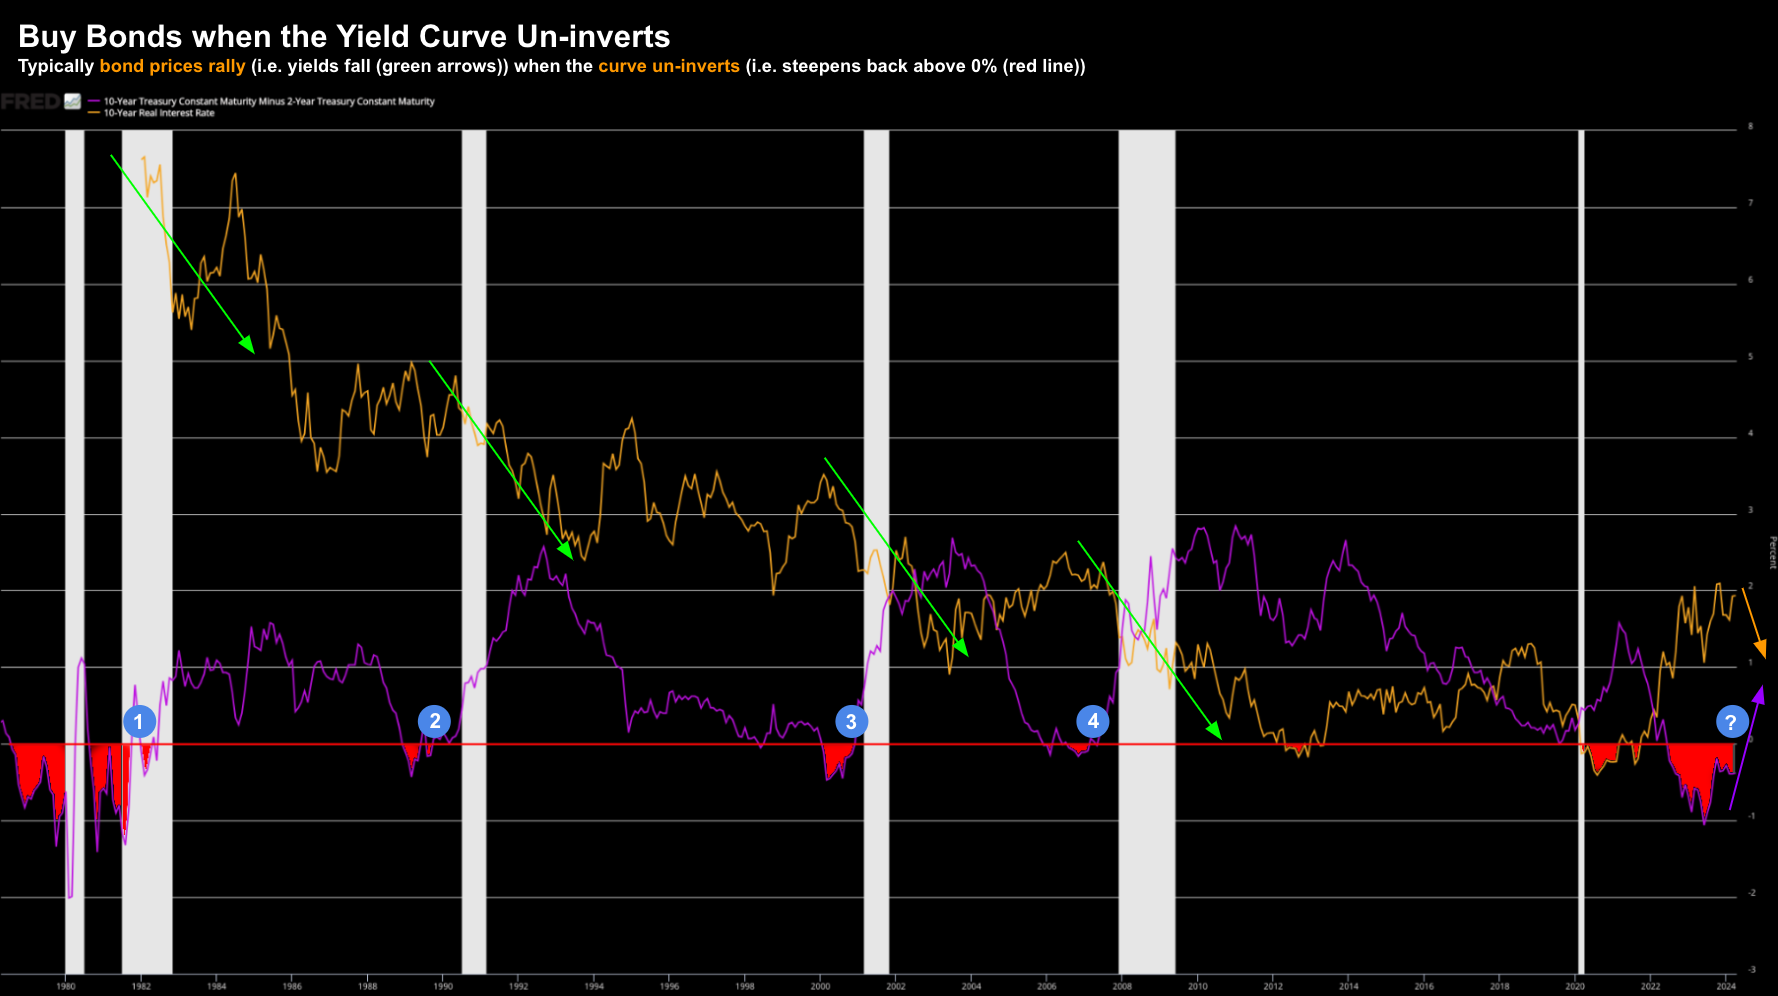
Let’s start with a 50-year chart showing:
- 10-year less 2-year yield (“yield curve”) – purple; and
- The real 10-year yield – orange.
April 15 2024
- Red shaded areas – where the yield curve is said to “invert” from 1979 (i.e., it falls below the zero line);
- Blue circles (labelled 1 to 4) denoting where the curve un-inverted (i.e., traded above zero); and
- Green arrows showing where real yields fell (i.e., bond prices rallied)
First up, this timeline shows how rare yield curve inversions are.
For example, we’re working through the 5th inversion in five decades.
Most of the time, the yield curve trades in positive territory (i.e., where the 10-year yield is greater than that of the 2-year)
That’s considered a healthy (financial) environment.
However, what we’ve seen over the past two years is unusual (in many ways)
For example, when the Fed was forced to tame unwanted inflation (by aggressively raising rates) – this saw the 2-year yield rally sharply.
The short-term rate subsequently exceeded that of longer-term yields – putting the “2/10” spread into negative territory.
We saw a similar thing in 1979, 1989, 2000 and 2006.
However, the inversion of 2022 is particularly deep (and extended).
So What’s the Impact?
In each of the previous four times we’ve seen inversion – a recession followed.
Obviously we’re yet to see it post the inversion of 2022 (for various reasons) – however that’s not to say we won’t in the next 12-24 months.
That’s something the market is still trying to figure out.
But let’s talk more to what happens when yields invert…
Typically a prolonged (deep) yield curve inversion prompts banks to favor short-term lending due to its higher interest rate returns over long-term lending.
Banks tend to buy short and lend long.
The reason is lending over a longer-term comes with far more risk.
The Fed is aware of this and typically wants to see a positively shaped curve (as it makes for a more robust financial system).
Therefore, to combat yield curve inversion, generally the central bank will adjust monetary policy to be more accommodative.
And from there, the curve would tend to “un-invert” and (more profitable) lending grows.
But…
Over the past two years the Fed had limited monetary ‘flexibility’ due to persistent unwanted inflation.
They could not simply slash rates.
Now when (not if) the Fed moves to be more accommodative – generally this marks the start of a new bond bull market
Lower short-term yields help drive up the prices of bonds.
Let’s go back to the chart and the blue circles…
These show when the yield curve turns from negative to positive.
As the green arrows highlight – this is where yields fall (and bond prices rally)
Bond prices trade inversely to yields.
And as the yield curve continues to steepen – it also sends a signal to the Fed to ease policy – enhancing liquidity.
From there, the cycle continues until the spread starts to decline (e.g., as we saw in March 2021) – meaning interest rate dynamics shift again and bond prices fall.
So What’s the Play?
Investors should be watching the long-term bond market closely the next few months.
The 10-2 yield curve has been inverted for ~22 months (likely to be 23 months at the end of April)
We saw something similar in the early 80’s.
Now when (not if) the Fed starts to reduce its quantitative tightening (as Powell indicated) and cut rates – it’s likely the yield curve will steepen further and un-invert.
Based on what we’ve seen the past 50 years – that’s a good entry point for bond ownership.
There are multiple ways you can gain exposure to bonds – which I’ve outlined here.
In this post, I talk to the advantages (and disadvantages) for each of:
- Treasury Bonds (long and short)
- Muni Bond Market (very tax effective)
- High Yield Market; and
- Investment Grade Corporate Debt
From mine, a 10-year yield yielding close to 5.0% could set up to be very good (longer-term) risk reward entry – especially with the Fed approaching its inevitable easing cycle.
Putting it All Together
Before I close, one more chart which could auger for lower yields.
However, as a preface, I think the (inevitable) un-inversion of the yield curve is a more compelling case.
Below is the large divergence we’ve seen between gold and real (inflation adjusted) US 10-year yield since 2022.
April 15 2024
Gold has soared this year – up ~20% YTD – on concerns over geopolitical risk, unwanted inflation, and fiscal recklessness.
And all good reasons to own some gold!
Now generally, this would also see bond prices rally (i.e., yields decline)
But as I described above, yields are rallying.
This chart shows the correlation between gold and real US 10-year yields (inverted).
This (formerly close) relationship broke down in early 2022 and has continued to widen.
The question some are asking is whether these two once again converge?
Will real yields fall? Or could the gold price fall? Or both?
Or maybe the relationship between these two safe-havens is now broken (due to actions of the Fed and unprecedented fiscal policy)?
I don’t know (but I do think there is weight to that).
For example, maybe there is such strong demand for physical gold, it’s broken its ‘shackles’ to U.S. treasuries for good?
Many seem to think so.
That’s possible – demand has never been stronger for the shiny yellow metal. Heck – you can even buy gold bars at Costco (they can’t sell them fast enough!)
But if I were to guess, I would wager these two safe-havens once again converge over time (i.e., however it will be years… not months)


