- AI chip stocks get crushed (again)… it’s not done
- Employment is slowing… soft-landing?
- 10/2 Yield Curve un-inverts – recession warning?
Last weekend I questioned whether markets could break out to the upside; or perform what trader’s refer to as a “back and fill”
My best guess was the latter.
In turns out, things traded ‘per the script‘, where the S&P 500 suffered its worst week since March 2023 – giving back 4.20%.
The Nasdaq fared far worse – shedding ~6% – led by large losses in popular AI chip stocks.
Whilst not an exhaustive list – here’s a small example of the weekly losses in popular chip names:
- Nvidia (NVDA) down 13.9%
- Broadcom (AVGO) down 15.9%
- Intel (INTC) down 14.3%
- Applied Material (AMAT) down 11.4%
- Micron (MU) down 10.2%
- Qualcomm (QCOM) down 9.8%
Regular readers will recall my previous reservations with NVDA.
Those paying ~$140 per share in mid-June (at ~50x earnings) – were making a high risk bet. They’re now down ~30% on the trade.
It’s easy to overpay for the highest quality names (commonly known as ‘FOMO’) – this is a good example.
So why are market’s worried?
After all, isn’t the Fed scheduled to cut rates up to four times before the end of the year?
Whilst I’m sure the rate cuts are welcomed – they are worried it will be too little too late – where participants fear a sharper than expected slowdown.
That’s a problem when you have a market trading close to ~22x forward earnings – expecting YoY EPS growth of 11%
22x forward earnings is not consistent with a ‘slowdown’ scenario… it’s a market priced for accelerating growth (implying a strong and spending consumer).
Let’s start with the all-important jobs print… as the devil is always in the detail.
And whilst the headline was slightly lower than expectations… there were some sharp revisions lower to previous months.
Employment & Job Openings are Slowing
The market’s focus has moved beyond inflation to what we see with employment.
In fact, I would argue next week’s inflation report on both CPI and PPI will be a barely a footnote.
Expect CPI to be in the realm of 2.60 to 2.80% YoY – with energy prices coming down sharply. However, Core CPI (which removes energy) is likely to be closer to 3.0% YoY.
Expectations for August payrolls were around 161K job additions.
The print came in at 142K jobs (where a solid 17% were government jobs – a cost to taxpayers)
But here’s the kicker:
Whilst 142K job additions was fewer than expected – it was made worse by 86K fewer jobs the past two months.
That sent chills through the market… given the previous months were already weak prints.
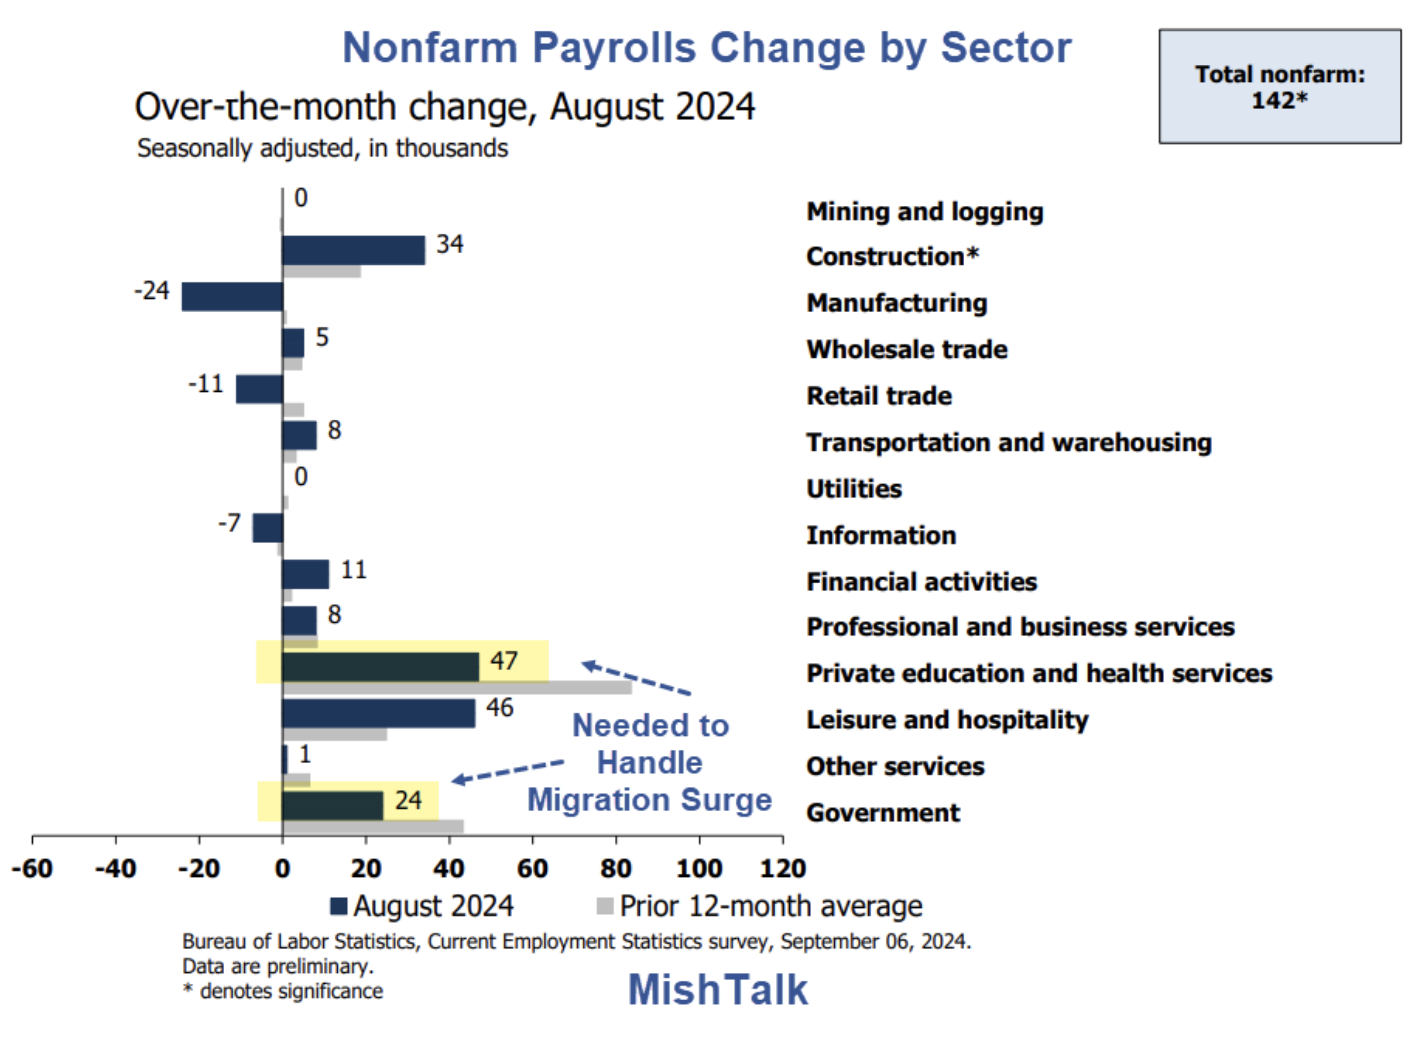
Here’s a sector summary from Mike Shedlock’s ‘Mishtalk‘ (who provides the best employment summary of any analyst)
As an aside, note the 24,000 jobs lost in manufacturing.
I called out the manufacturing recession during the week – talking to the five consecutive contracting months with ISM (and 21 of the past 22 months)
And whilst some politicians are constantly telling us that U.S. manufacturing is “doing very well” (e.g., in strong manufacturing states like Pennsylvania, Michigan and Wisconsin)… they’re certainly not looking at either the declining employment trends or ISM survey data.
To try and answer why manufacturing continues to contract – Charlie Munger offers this:
Incentives are what drive human behavior. Understanding incentives is the key to understanding people. Conversely, failing to recognize the importance of incentives often leads us to make major errors.
I digress…
So here’s today’s exam question(s):
- Will the weakening unemployment (and far fewer job openings) be enough for the Fed to cut 50 basis points in just over a week’s time?
- If they do decide to cut 50 bps – what signal will that send to the market? and third
- Will it make any difference?
The talking heads on Bloomberg and CNBC will offer different opinions on why the Fed should (or should not) cut rates by 50 bps.
In addition, you will hear contrasting views of whether the economy is headed for a soft landing or something much worse.
The honest answer is none of us know… all we have are probabilities.
Are the Odds of a Soft-Landing Slipping?
Whilst most can agree the economy is slowing – mainstream consensus is we’re likely in for a soft-landing.
Now we heard a similar narrative in 1999 and 2007… with Real GDP travelling around 3.0% and unemployment low… so the call is not unusual.
Typically you will get a soft-landing narrative until proven otherwise.
And at that point, everyone is quick to say “oh yeah – we saw the recession coming”
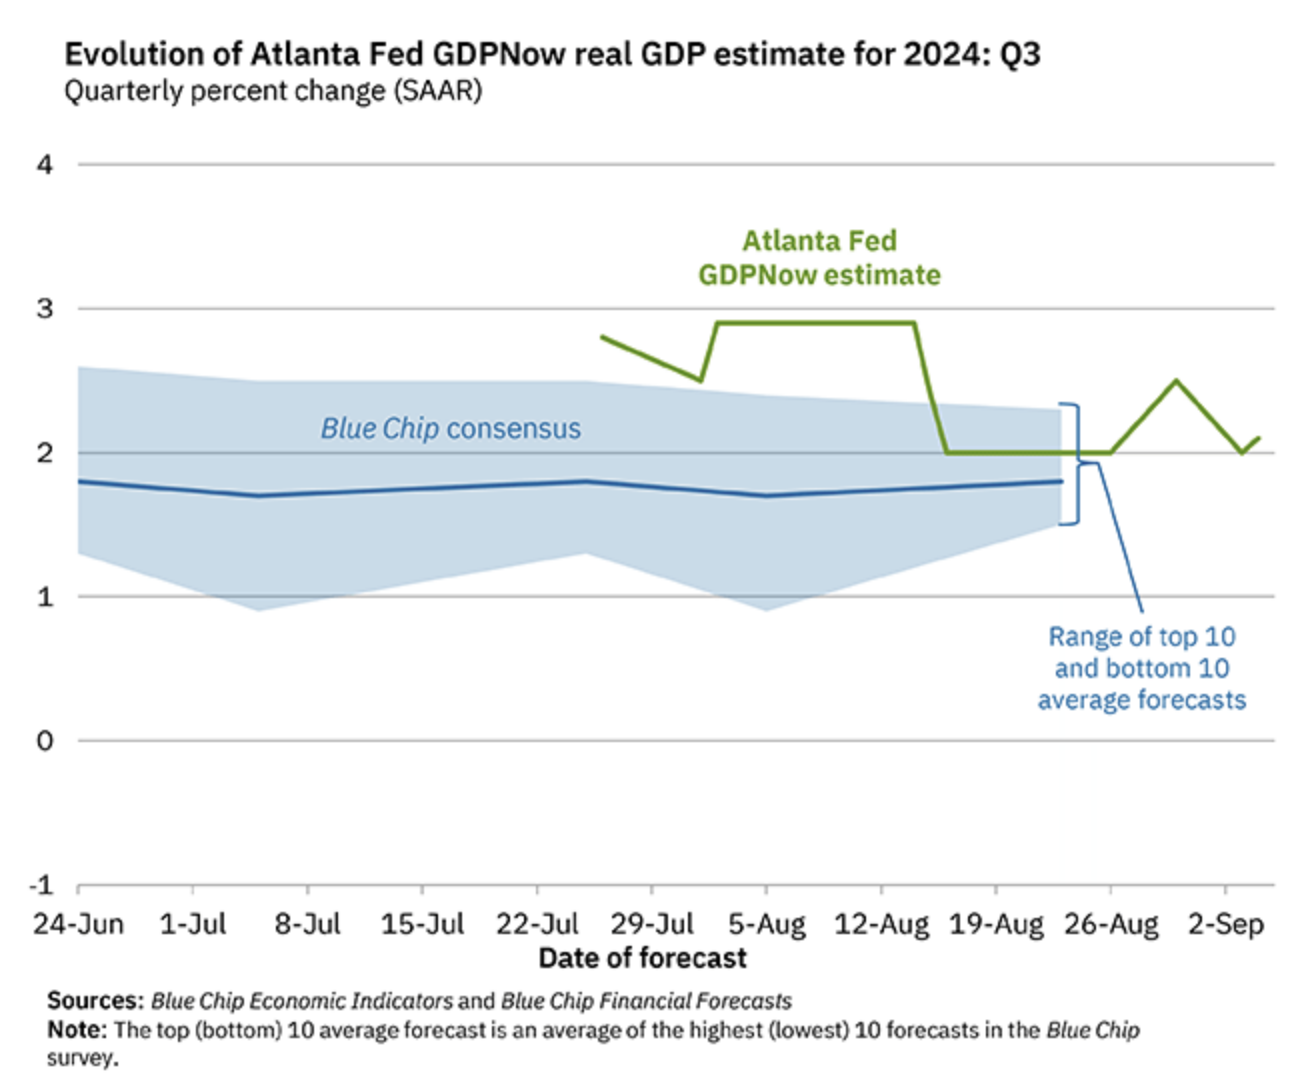
If we start by looking at the Atlanta Fed’s GDPNow – they tell us:
The GDPNow model estimate for real GDP growth (seasonally adjusted annual rate) in the third quarter of 2024 is 2.1 percent on September 4, up from 2.0 percent on September 3.
After this morning’s releases from the US Census Bureau, an increase in the nowcast of third-quarter real gross private domestic investment growth from -0.6 percent to 0.0 percent was slightly offset by a decrease in the nowcast of third-quarter real personal consumption expenditures growth from 3.3 percent to 3.2 percent.
And if we’re to see Real PCE growth in the realm of 3.2% going forward – this would be a consistent with a soft-landing.
However, questions are being raised.
Coming back to Mike Shedlock’s terrific analysis on employment trends – he developed his own indicator – suggesting probabilities of a recession have risen sharply.
Using a combination of three well-documented methods – Mish integrated these models to remove both negative values (Sahm Rule) and false positives.
- McKelvey recession indicator (former Goldman Sachs economist) – which takes the current value of the 3-month unemployment rate average, subtract the 12-month low, and if the difference is 0.30 percentage point or more, then a recession has started
- Sahm’s Rule – which copies the earlier work of McKelvey – however uses a 0.50 percentage indicator – and is only applied post 1960 (as many false signals were generated prior to 1960); and
- Pascal Michaillat & Emmanuel Saez – which leverages McKelvey – however integrates job vacancy rates (JOLTS) with the Unemployment Rate.
With respect to the Michaillat & Saez’s approach – they take the minimum of either McKelvey or JOLTS.
If either one is below 0.3 percent, there is no recession.
Note: With respect to the widely-cited Sahm Rule – Michaillat notes “this indicator is sometimes negative. This is strange given that—by definition—a variable cannot be lower than its minimum over the past 12 months. Our indicators are never negative”
The reason (as explained by Mish) is Sahm’s Rule does not include the current month in the 12-month look-back period – which can give negative results.
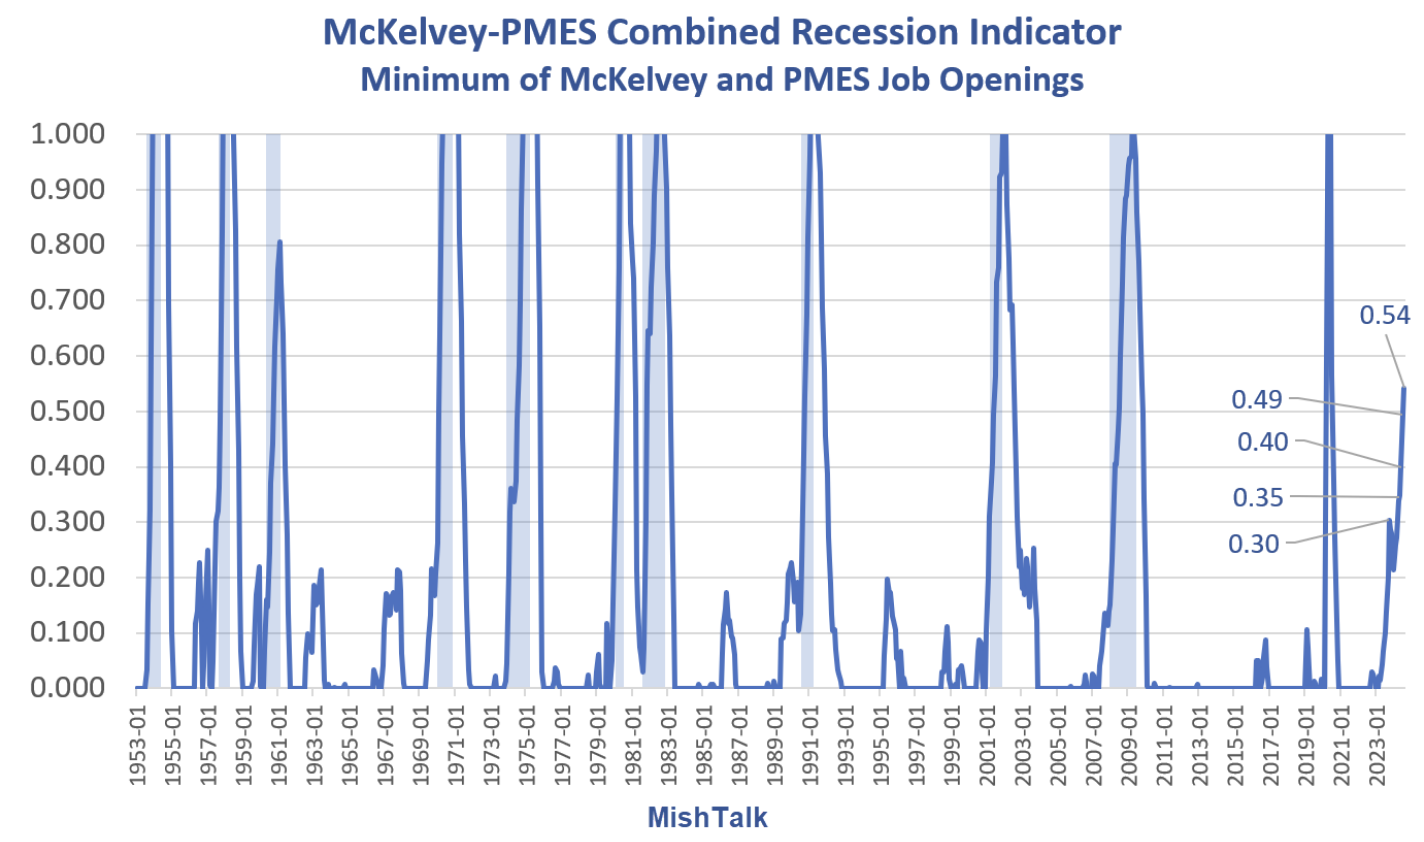
Therefore, to eliminate both negative and false positives – Mish combines (i) McKelvey; (ii) Michaillat & Saez; and (iii) JOLTS – and applies a trigger of 0.40 – to produce the following:
As we can see, this has (a) no negative values (Sahm’s Rule); and (b) no false positives back to 1953
Mish’s indicator has now triggered at 0.54 – suggesting we’re now likely in recession.
We won’t know if this is true for ~6 months – given we need two consecutive quarters of negative GDP (e.g., Q3 & Q4 2024)
But it’s something to keep an eye on….
What I like with Mish’s combined model is the integration of job openings (JOLTS).
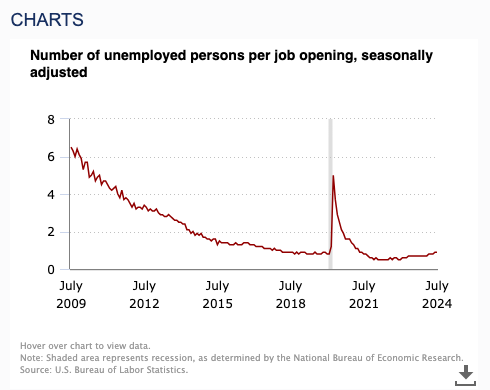
For example, separate to the monthly payrolls print, during the week the BLS told us job vacancies dropped to its lowest since the pandemic year of 2020.
If you combine JOLTS with the (ongoing) increase in the number in the workforce but unemployed – there is now only about 1.1 vacancy per person looking for work.
In short, jobs are getting harder to find.
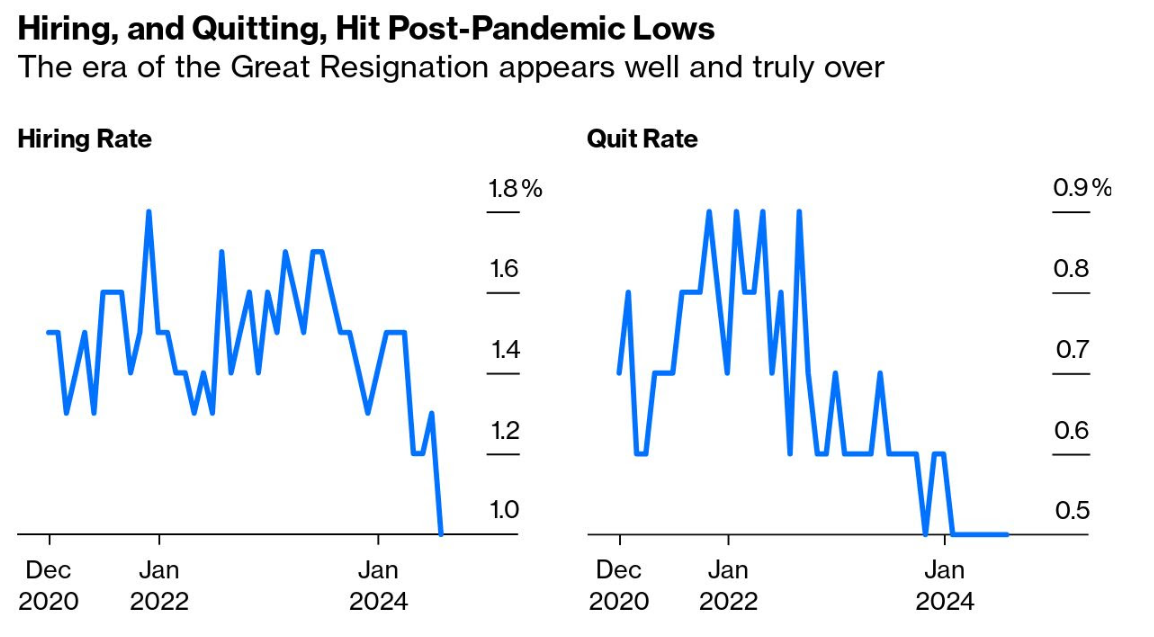
Therefore, it’s not surprising to see the “quit rate” at 0.5% – much lower than the “Great Resignation” of 2022
See below from Bloomberg:
Echoing the work of Mish and his recessionary indicator – the downtrend in JOLTS is concerning.
And from mine, this suggests we are likely to see further weakness in employment in the months ahead.
In this case, I will be very happy to be wrong.
10/2 Yield Curve Un-inverts… A Warning?
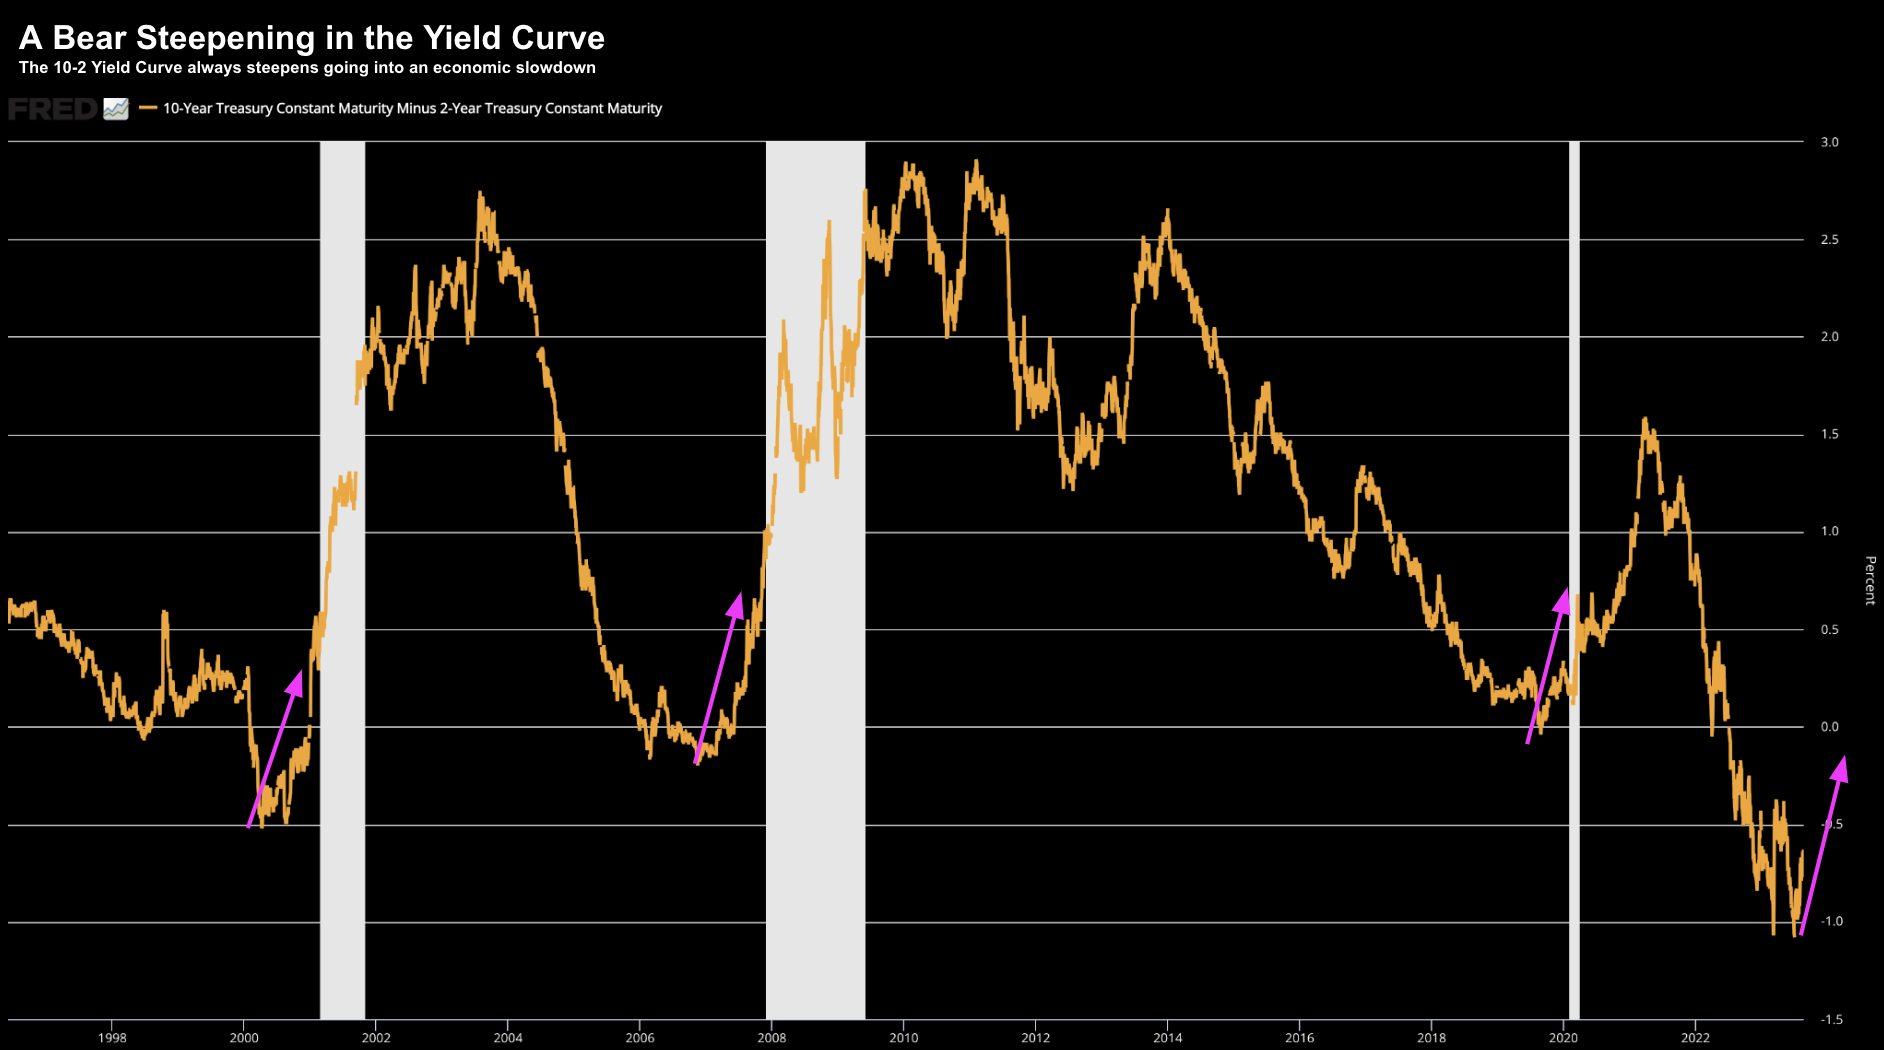
This time last year I issued this post: “Beware the Bear Steepening of the Curve“
In short, I said stocks are not worried about an inverted curve. Typically they do perform well over this period
However, markets start to get worried when the yield curve uninverts.
For example, I offered this chart showing what could be ahead for the closely watched “10/2 Year Yield Curve”
August 2023
However, the pink arrow I pencilled suggested this was likely to accelerate towards 0% (un-inversion).
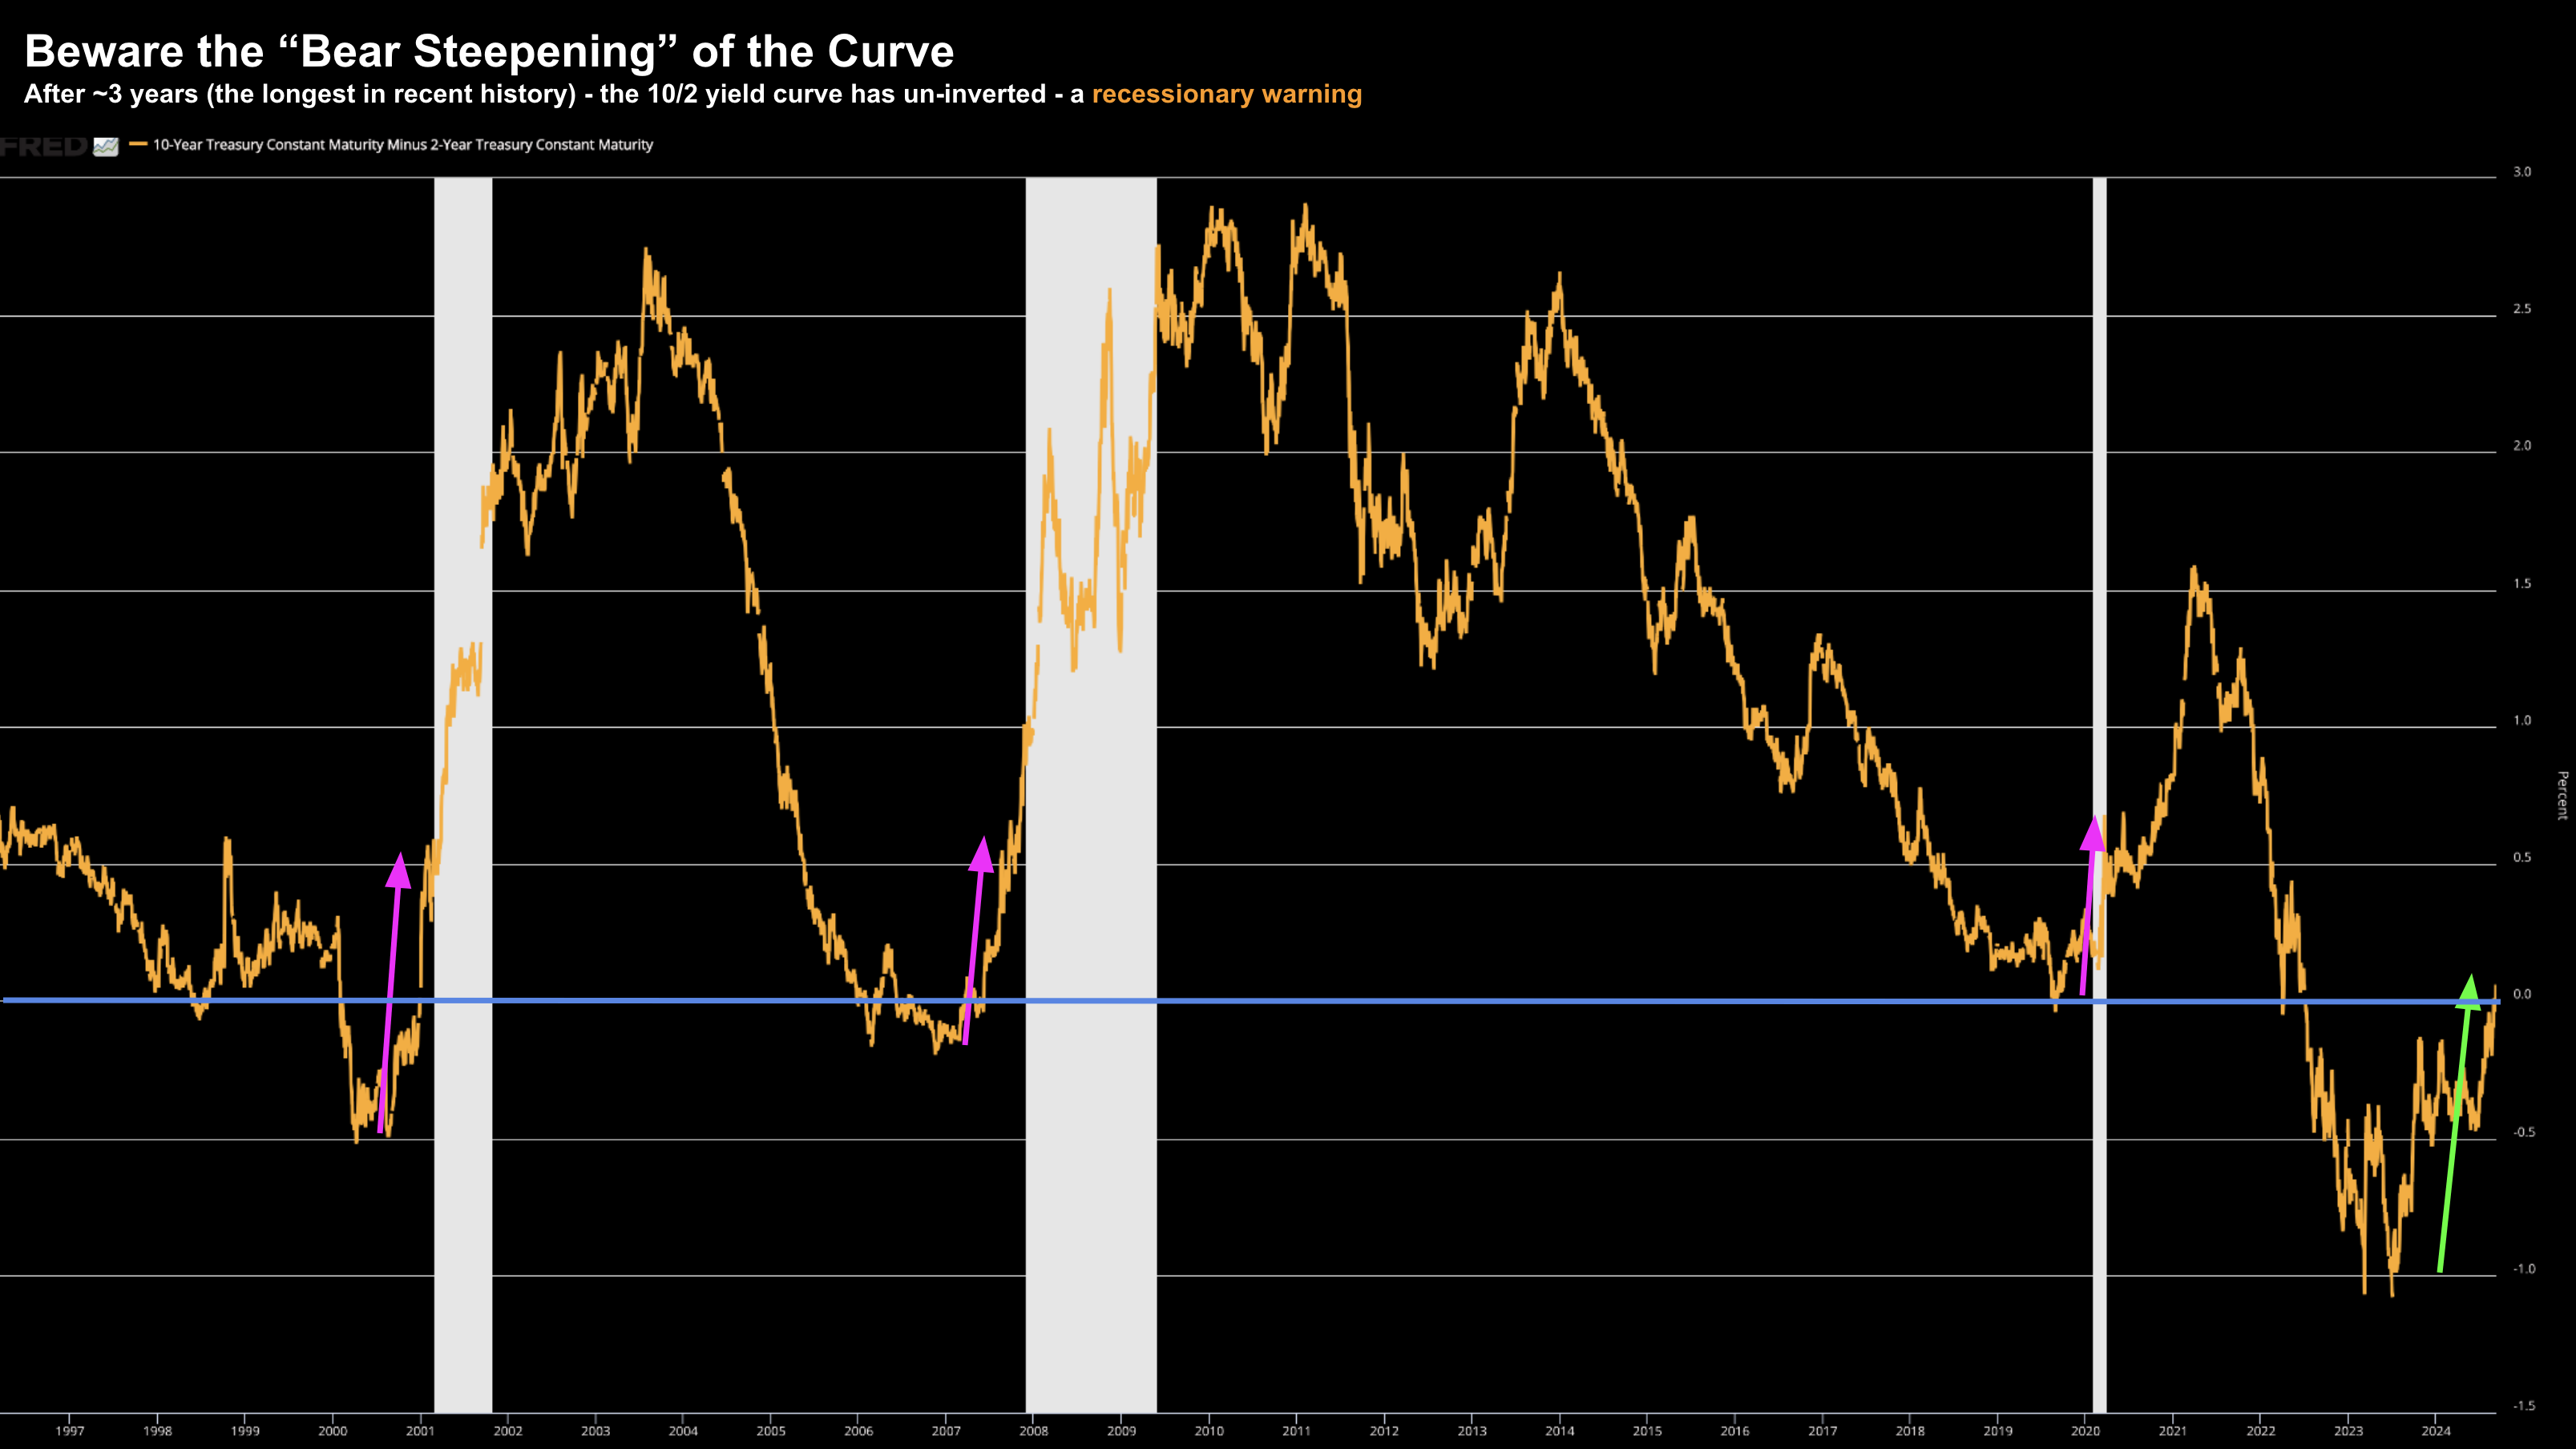
Let’s update the chart for the past 12 months (and if that forecast was accurate):
Sept 07 2024
Whilst it didn’t happen in a straight line (nothing ever does) – our 10/2 curve is now back above the zero-line.
Repeating my language from ~12 months ago – this is problematic for both the economy and stocks:
Generally this steepening (from inversion) doesn’t bode well for the economy. The reason this happens is investors tend to avoid the long-end of the curve (i.e., they sell longer duration bonds) – seeking more attractive returns at the shorter-end (which comes with less duration risk). This has the effect of pushing long yields higher. It’s not typical to see this. However, they do tend to occur prior to recessions.
As an aside, I recently took half profits on my EDV trade (i.e., selling longer term bonds) – which was a bet on the 10-year yield falling (note: when yields fall – bond prices rise)
With the US 10-year now trading ~3.70% – I don’t think long-term bonds are an attractive bet (especially given the fiscal situation – where both Democrats and Republicans likely to expand deficit spending)
If this thesis is true (where trillion dollar plus deficits continue well into the future) – this will likely have the impact of pushing 10-year yields higher – bringing down bond prices.
In other words, a vehicle like EDV or TLT will decline with lower bond prices / higher yields.
If you have large exposure to the long-end – I would either take full or partial profit with the 10-year around 3.70%
It’s my view we see the 10-year well above 4.0% next year – as the yield curve continues to steepen.
S&P 500: Back & Fill
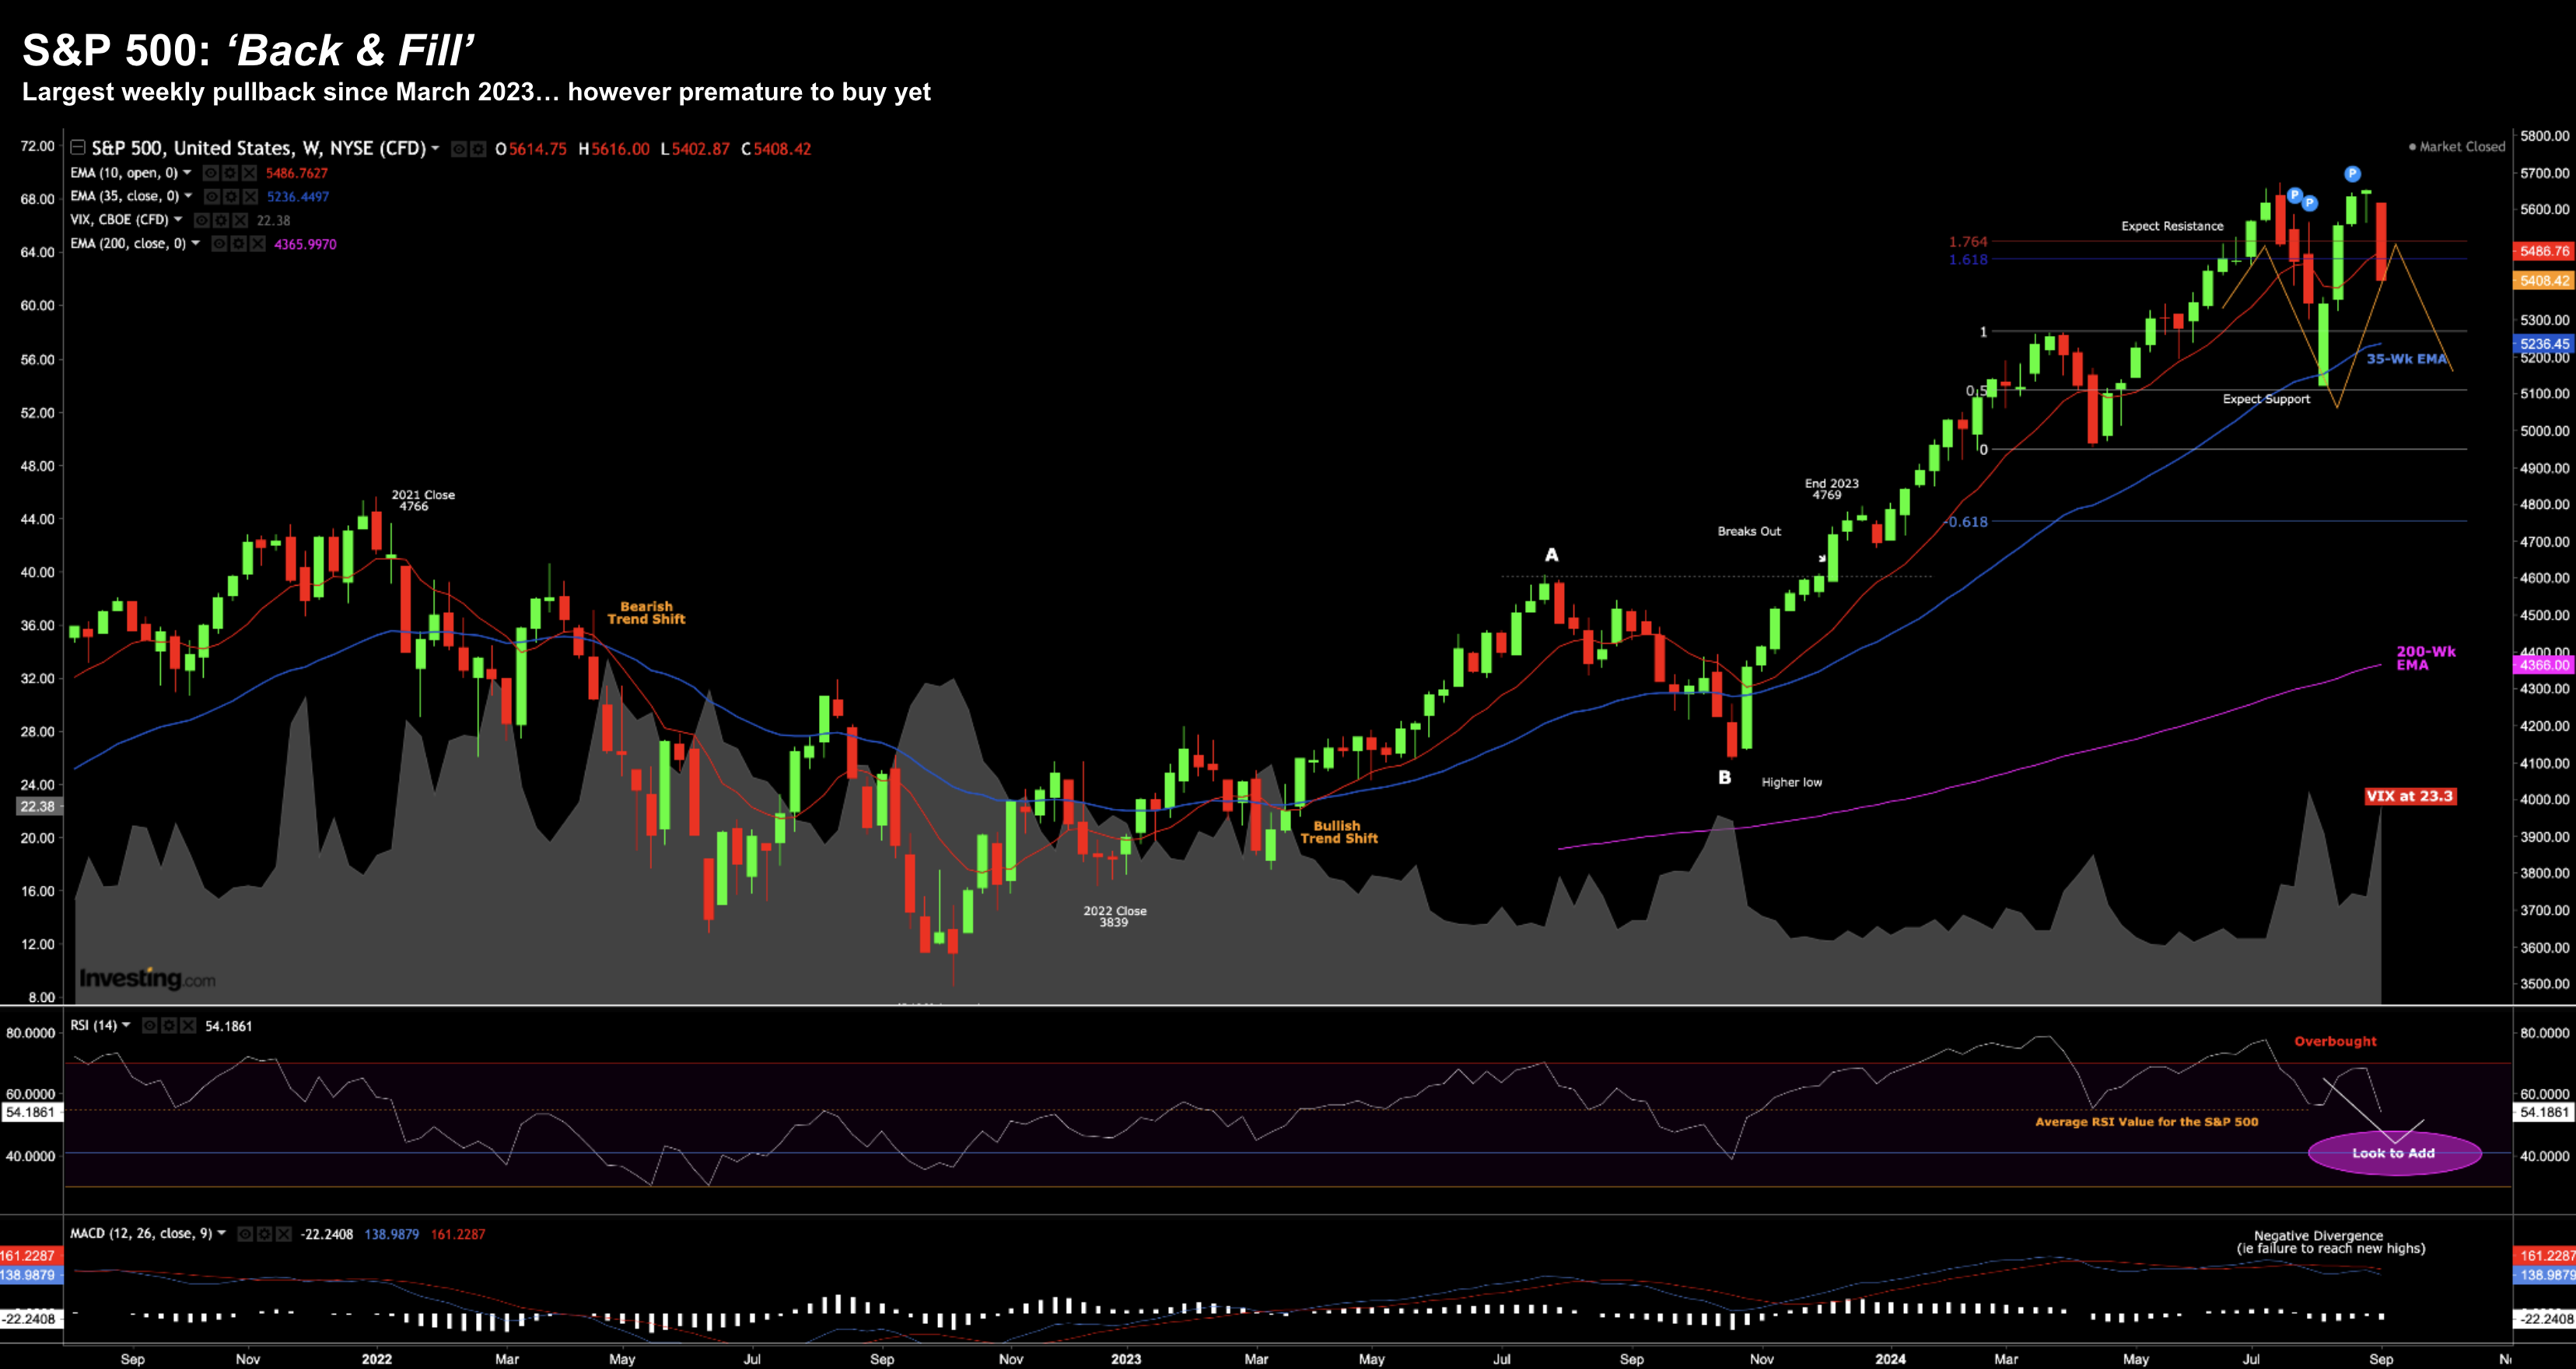
Let’s close with a look at the weekly chart for the S&P 500.
I mentioned to readers last week I remain “cautiously invested” – with ~65% long exposure.
My best guess was the market could meet stiff resistance at the all-time high; and then retrace.
Sept 07 2024
- Expect overhead resistance around the zone of 5500 (it traded ~3% higher)
- Expect a 7-10% pullback (see this post from July) – with buying support in the 35-week EMA zone;
- Stocks to catch a bid from that zone (typical of a bullish trend – however it was a sharper retrace than I expected); and finally
- Perform a ‘back and fill’ – as market uncertainty increases
Now if I’m correct (and I may not be – as these things are very hard to predict) – the S&P 500 will face more selling pressure in the near-term.
For example, my best guess is we will re-test the 35-week EMA support zone of around 5200
I think what we do from there will depend on how bad the economic news continues to be. For example:
- Quarterly year-over-year percentage change in Real PCE (e.g., are consumers still spending)?
- Trend in the Unemployment Rate (as a lagging indicator) and JOLTS; and
- Are analysts revising down their earnings estimates (as they did this quarter)?
For the market to continue to rally – it does not want to see bad news.
Four rate cuts (100 bps) this year are fully priced in. What’s more, the market sees a further 50 bps early into next year (based on the 2-year yield).
However, more important than rate cuts – it needs to see the economic data firm.
Monetary policy suffers from long and variable lags.
Therefore, no amount of rate cuts will change what we see with consumers over the next 6-9 months
Putting it All Together
In closing, next week all attention turns back to Jay Powell.
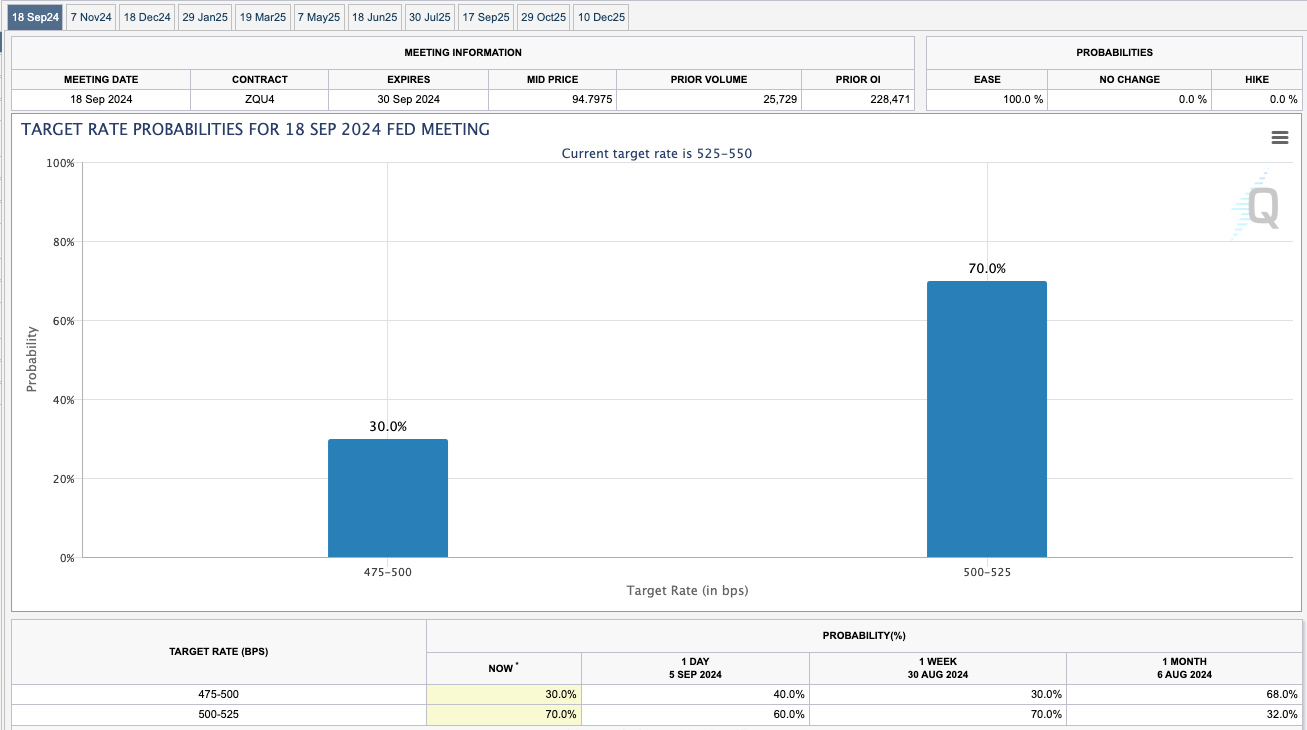
Expectations for a September 50 bps cut fell 10% to 30% following the August’s payrolls. However, the probabilities of 25 bps remain at 100%
From mine, the fate of markets now squarely hinge on (lagging) employment.
Pending its strength (or lack of) over the next two months – it’s possible the Fed may panic into deeper than expected rate cuts.
After all, they were (very) late raising rates… will they be late cutting them too?
It would not be the first time.
Strap in for a bumpy ride… and trade safe.

