- Why consumer spend holds the key to forecasting the economy
- More companies cite a more ‘selective’ or ‘cautious’ consumer
- Understanding the 4 stages in the market cycle…
Yesterday I shared the most recent year-end analyst forecasts for the S&P 500 and 10-year yield.
They range from 4200 to 5600 for equities; and 3.00% to 4.75% for 10-year yields.
My guess is we will land somewhere in between these zones.
On the whole, I think it’s fair to suggest Wall Street feels ‘comfortable’ with holding equities.
Consensus year end targets average 5400 – which tells me most don’t expect stocks to do much between now and year’s end.
More important – they don’t expect stocks to lose any ground.
Recapping their year-end targets:
| Company | S&P 500 EOY 2024 | 10-Year Yield EOY |
|---|---|---|
| Goldman Sachs | 5600 | 4.0% |
| UBS Global | 5200 | 4.0% |
| Wells Fargo | 5100 to 5300 | 4.25% to 4.75% |
| Barclays | 5200 | 4.25% |
| JP Morgan | 4200 | 3.75% |
| BoA | 5400 | 4.25% |
| Deutsche | 5500 | 4.60% |
| Citigroup | 5600 | 4.30% |
| HSBC | 5400 | 3.00% |
| Oppenheimer | 5500 | NA |
My thinking is if the market is to hold onto its ~15% YTD gains – we need the following:
- Unemployment to remain well below 4.50%
- The Fed’s ability to engineer a ‘soft landing’; and
- Inflation cools (e.g., 3.0% or below) without pushing the economy into recession.
All of these things are possible if the consumer continues to spend.
And that could be a big if.
From mine, everything hinges on the consumer and their capacity to spend.
And spending (for the most part) is a function of having a job.
This is why I think employment is critical.
Should this unexpectedly rise from today’s level of around 4.0% – forecasts for the S&P 500 finishing the market around 5400 will be missed.
But this had me thinking last night…
What does JPMorgan’s Marko Kolanvic – consistently rated as one of the best equity analysts – see that others potentially don’t?
According to Bloomberg – he has a target of 4200 by year’s end – implying a whopping 23% correction.
He is not on the same page as any of his Wall Street peers.
The question is why not?
Consumer Spending and the Market
From mine, I believe Kolanvic is concerned about the ongoing health of the consumer.
Put another way, he is likely less concerned about the November US election result (which won’t move the market either way), geopolitical events like what we see in Gaza and Ukraine, fiscal policy and/or capital investment.
I believe he’s looking at risks to ~70% of GDP.
Let me explain…
Given the causal relationship of consumer spending to corporate profits, it goes without saying the market responds to rates of change in consumption.
Put another way, the market – as a predictive indicator – it will react to what happens with changes in spend.
Therefore, Kolanvic could be of the view that any possible slowdown in consumer spending poses a major risk to earnings.
And I think there is weight to this view.
For example, consider what we’ve heard recently from leading S&P 500 companies with respect to sales guidance when it comes to the consumer:
- Walmart – their shares dropped over 2% this week after comments from CFO John Rainey at the Bank of America London Investor Conference spooked investors. Rainey warned that the current quarter’s sales won’t be as strong as those from the previous quarter and noted that the second quarter is the most challenging in terms of comparable sales. They added that shoppers are prioritizing buying food and health-related items over general merchandise, like home goods and electronics
- Pepsi called out a weaker low-income consumer. They saw unit volume for its North American beverage business fall 5% in the quarter. “The lower-income consumer in the U.S. is stretched … [and] is strategizing a lot to make their budgets get to the end of the month,” CEO Ramon Laguarta told analysts on the company’s conference call in April.
- Lululemon’s sales results lagged in its most recent quarter, which CEO Calvin McDonald attributed in consumers now being “more selective”. They see sales growth in the US being ‘flat’.
- Starbucks announced a surprise decline in its U.S. same-store sales and lowered its full-year forecast, sending its shares tumbling. CEO Laxman Narasimhan gave a laundry list of factors explaining the weak quarter, including a more value-minded consumer
- McDonalds – after three years of exceptional sales growth – said sales are normalizing. The Chicago burger giant said it expects its same-store sales — or sales at locations open at least a year — to rise 3% to 4% this year, which is in line with historical averages. That’s down from double-digit gains in 2021 and 2022 and 9% growth last year. Their CEO warned “consumers continue to be even more discriminating with every dollar that they spend as they faced elevated prices in their day-to-day spending.”; and finally
- Nike saw its worst trading day since its 1980 IPO – crashing 20% – as the CEO warned of a 10% decline in sales (see yesterday’s post where I assess the long-term trade opportunity).
This list of companies citing weaker demand is not meant to be exhaustive.
I’ve heard similar sentiment from the likes of Dollar Tree, 3M, Newell Brands and Colgate... it’s a growing list.
Again, it’s not hard to explain…
Persistently high inflation from late 2021 – especially with non-discretionary items – is hitting low-to-middle income earners particularly hard.
It’s a poor man’s tax.
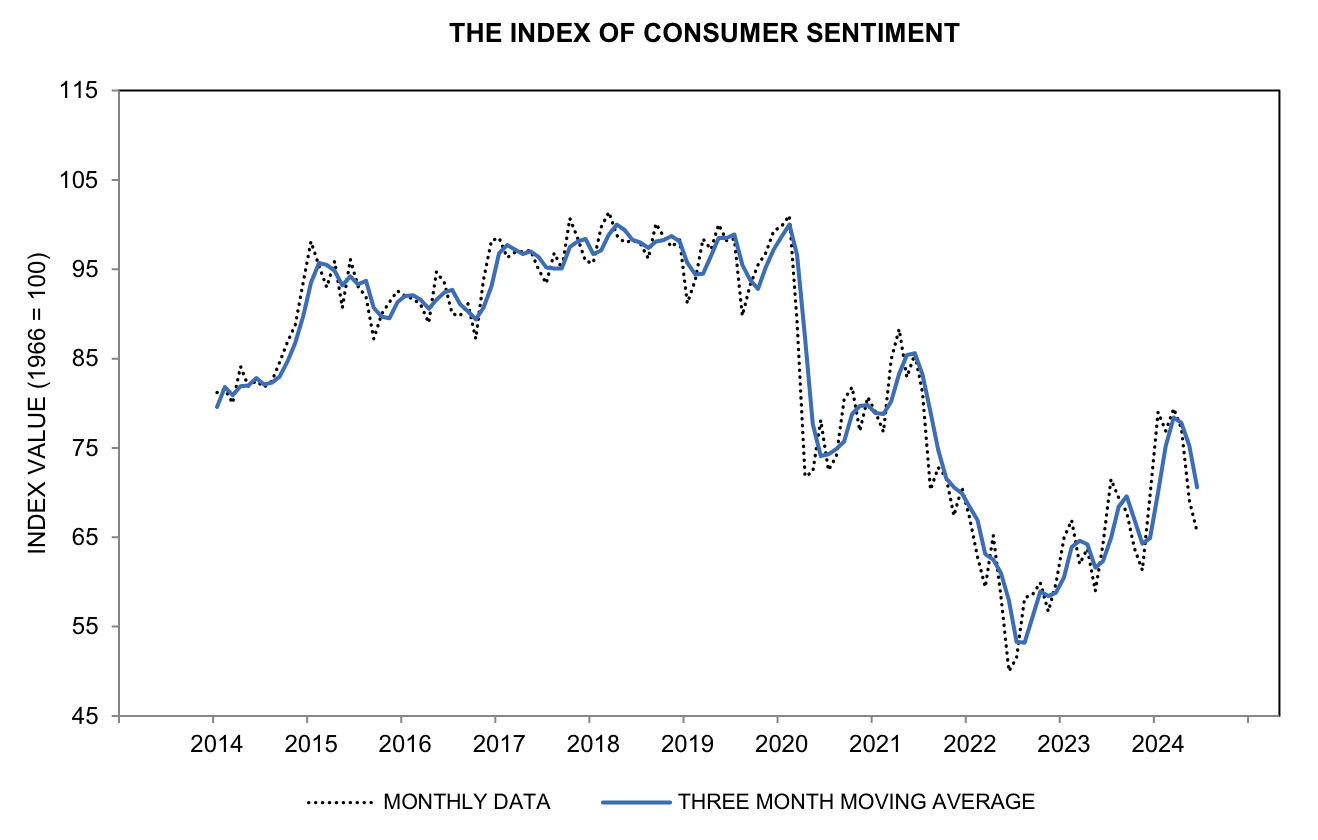
By way of example, recently I reported how consumer confidence hit its lowest level since mid-2022 as high prices remained top of mind
And whilst nominal worker pay has risen – it has not kept pace with inflation since the onset of the pandemic.
With prices of energy, food, health, insurance and rent (things we cannot do without) are all up over 20% to 30% in most cases – the same cannot be said for wages.
My question is whether most analysts are ignoring this with their forecasts?
Here’s another way of framing it.
If consumer spending (A) drives the economic and corporate-profit cycle (B) and if the stock market (C) is a sensitive predictor of (B) – then doesn’t it follow that (A) and (C) are causally linked.
One would assume.
And whilst it’s reasonable to think this logic is sound – I also recognize it’s not the only factor at play in determining market prices.
Bullish and bearish markets are also driven by myriad other psychological and valuation factors.
For example, the FOMO trade we see in ‘all things AI’… with investors paying extreme multiples (above 40x fwd PE’s in some instances).
Nevertheless, from mine, most major stock market advances and declines have a consistent relationship to increasing and decreasing rates of change in consumer spending.
It continues to be the dominant force in the economy as a whole.
Because if we don’t have a confident, spending consumer – then the subsequent effects will be felt across the entire economic chain.
For example – profits will fall; capital investment will be reduced; layoffs will follow etc.
For me, consumer spending is at ‘the front of the curve’ (with unemployment the other end – a lagging indicator).
Therefore, if we are able to understand (and possibly forecast) the direction of consumer demand—it will act as the key to unlock effective forecasting for most other developments and sectors in the economy.
This is what Kolanovic might be giving greater weight than his peers.
What to Watch
If you’re like me and believe that consumer spending is the key driver of the rest of the economy – then it pays to track its direction and velocity.
For example, when I listen to the most recent round of quarterly earnings calls – there were a number of red flags (as I highlighted earlier)
But there are two critical (consumer) metrics I like to monitor:
- Real average hourly earnings — this reflects the unit purchasing power of the majority of the population. Real (vs nominal) average hourly earnings has proven to be an excellent leading indicator of consumer spending over many cycles.
- Employment — whilst a lagging indicator – employment is still a key factor in the wages that contribute a significant portion of consumer spending power.
Yes, there are other macro variables to be mindful of – but these are the leading two.
Let’s now go to the charts to evaluate what we see…
With respect to real hourly earnings – the US government website www.bls.gov/ces provides us with an update.
Real average hourly earnings for all employees increased 0.5 percent from April to May, seasonally adjusted, the U.S. Bureau of Labor Statistics reported today.
This result stems from an increase of 0.4 percent in average hourly earnings combined with no change in the Consumer Price Index for All Urban Consumers (CPI-U).
Real average weekly earnings increased 0.4 percent over the month due to the change in real average hourly earnings combined with no change in the average work week.
Real average hourly earnings increased 0.8 percent, seasonally adjusted, from May 2023 to May 2024.
The change in real average hourly earnings combined with a decrease of 0.3 percent in the average workweek resulted in a 0.5-percent increase in real average weekly earnings over this period.
Whilst helpful – we can give this more value when assessed as a long-term trend.
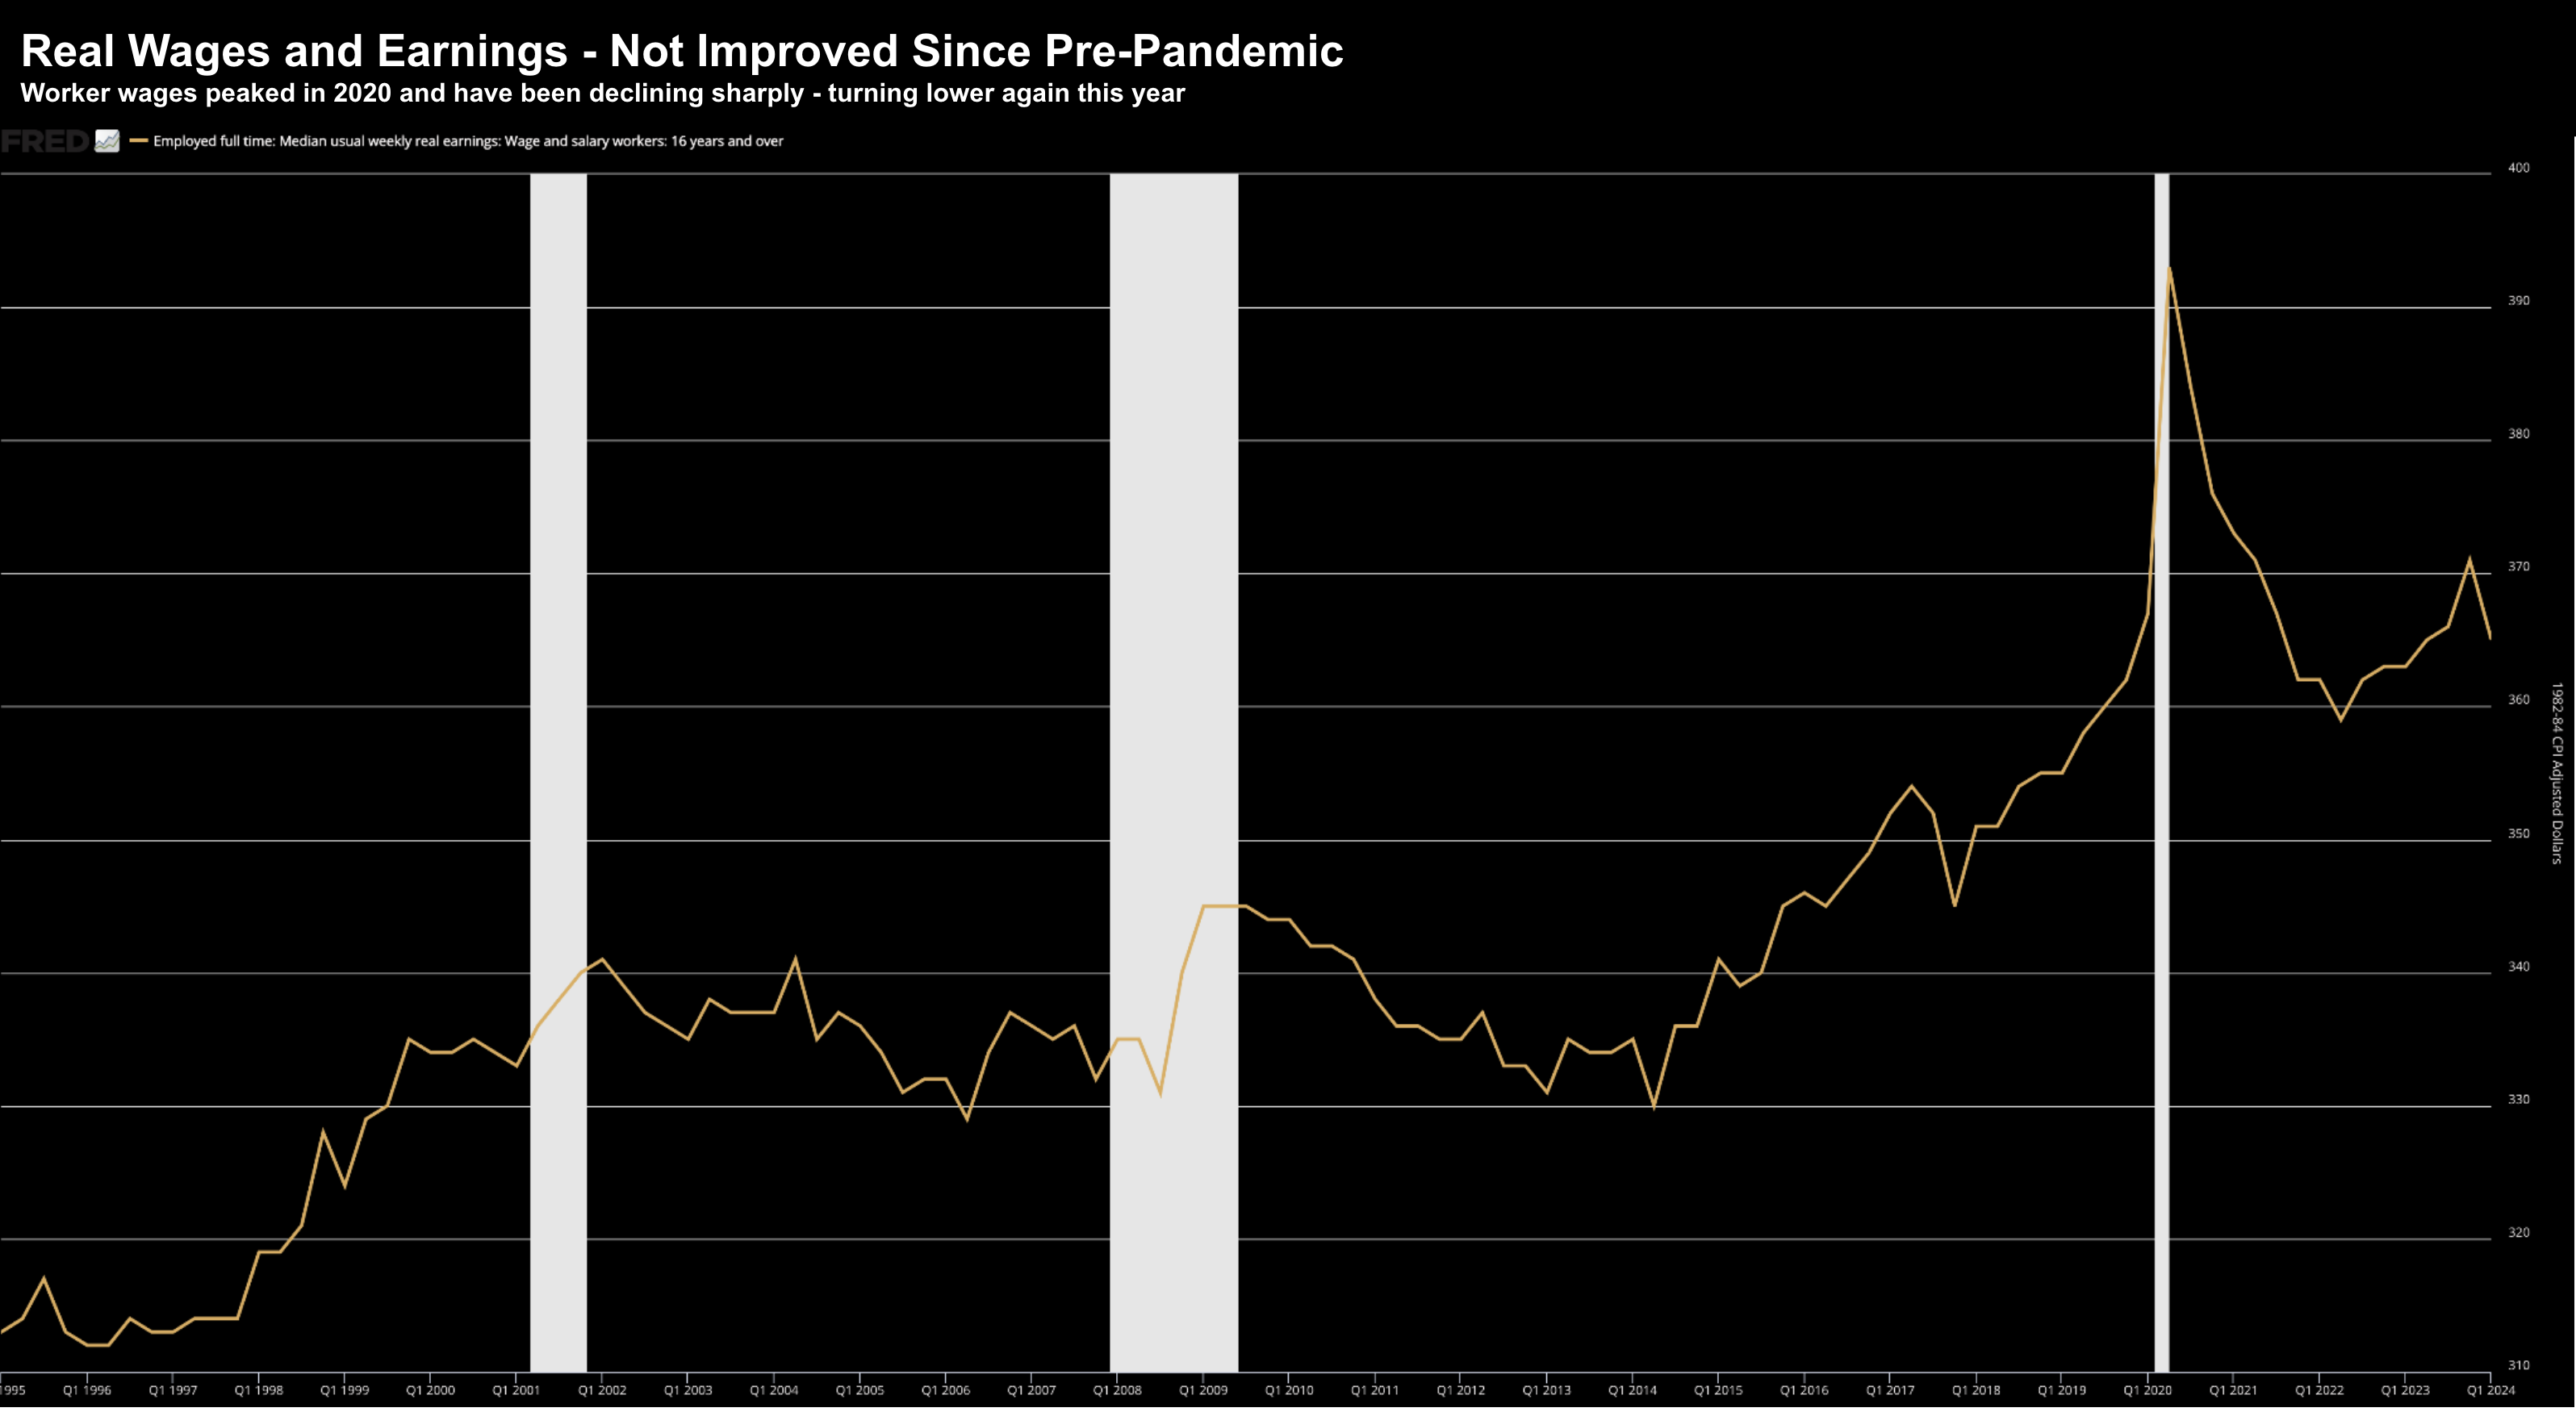
For example, are consumers better off in terms of the real wages (those after inflation) from say 4 years ago?
As an aside, this is what mainstream media typically fail to do.
What’s far more useful is not the single data point – but instead – a chart which shows the decade long trends and any potential causal relationships.
Without that – it’s not much more than a data point.
To that end, this is what we find:
June 29 2024
This chart shows the pain being felt by consumers. Their wage gains are back at levels we saw pre-pandemic.
There was slight improvement between late 2022 and 2023 – however this year it’s turned negative.
And from mine, this is why we will most likely see a change in government come November. Elections tend to flip when people feel worse off.
With respect to employment – for now it appears strong – with unemployment said to be ~4.0% (largely influenced by unprecedented levels of immigration)
However, we should be mindful that employment is a lagging indicator.
Remember: unemployment was only around 4.0% late 2007 – where almost everyone saw the economy as ‘healthy’ – with no sign of recession for 2008
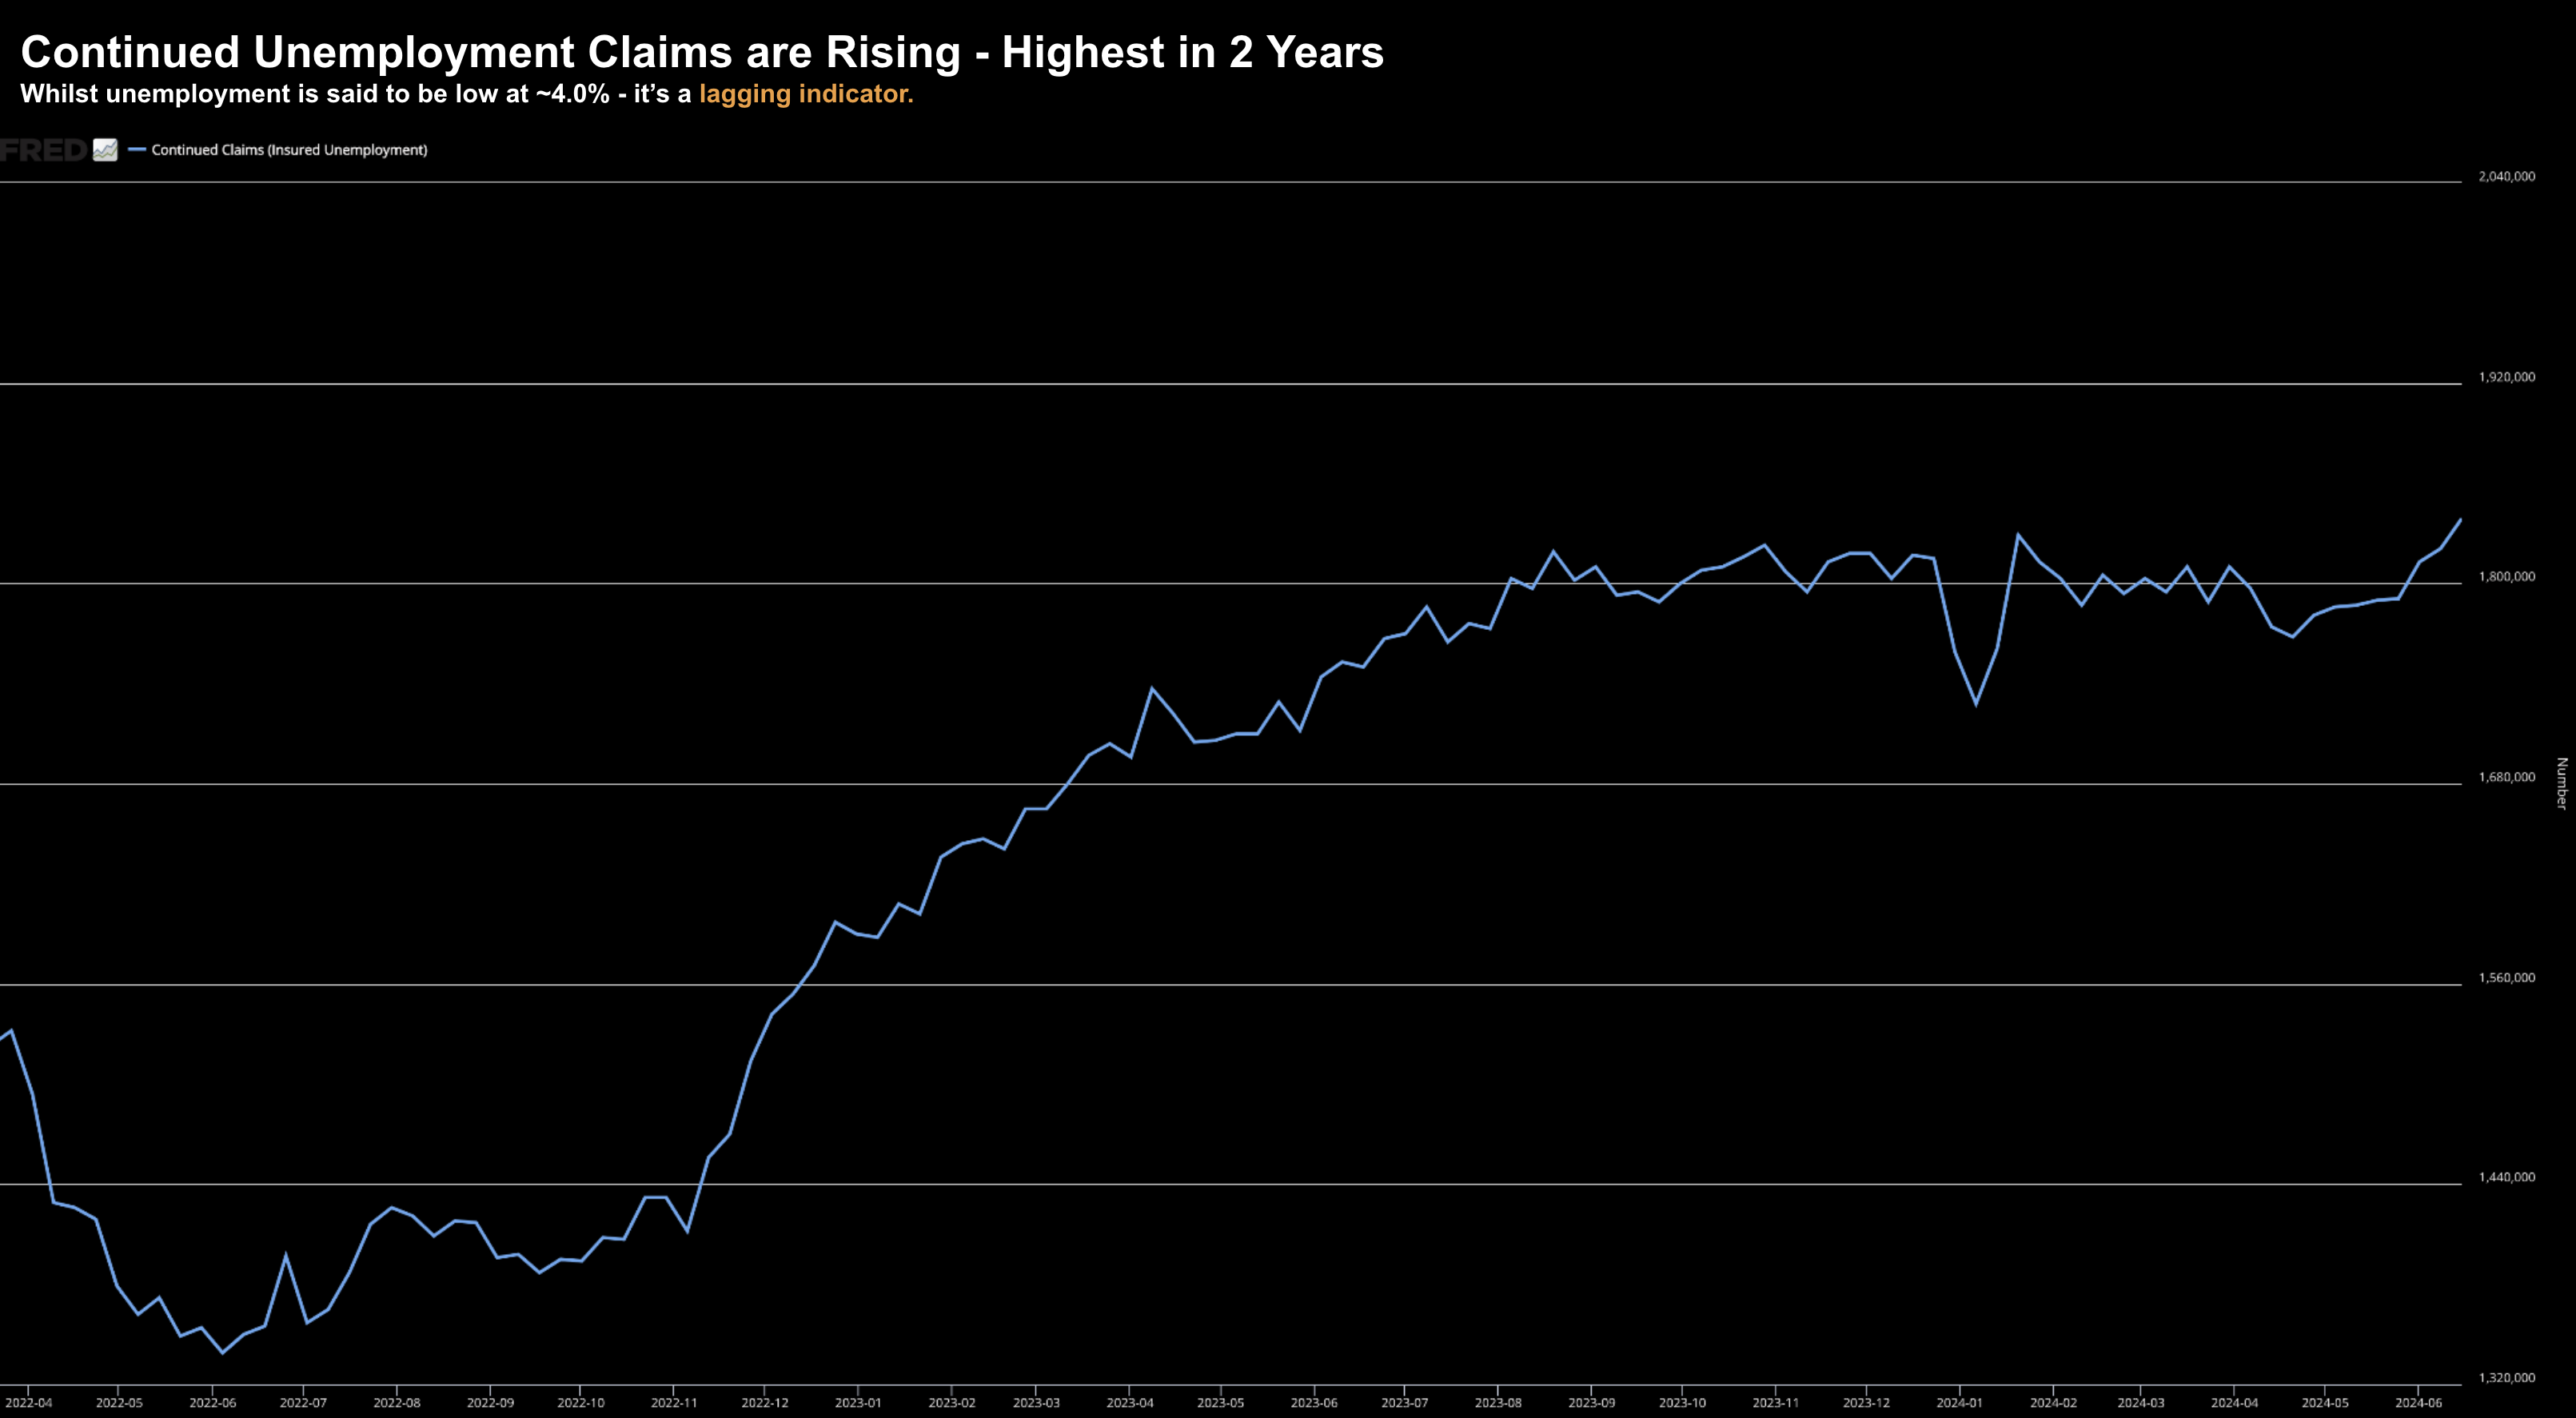
Now if take a look at continual unemployment claims, they have hit a new 2-year high:
June 29 2024
What this chart means is it’s now getting harder to find a job if you lose one.
Understanding the Cycle
My assumption (which could be wrong) is Kolanovic is observing the early negative trend(s) in consumer spend, wages and employment.
What’s more, he has the awareness to understand this also happens at the front end of the cycle.
Consumer spend is leading – not lagging.
For example, what happens with consumption will subsequently flow through to industrial production and capital investment.
Personal income— wages and salaries—is the primary driver of consumer spending and the largest sector of the economy (70% of GDP)
This is why the Fed leans in Personal Consumption Expenditures (PCE) as its preferred measure of inflation.
And whilst forces such as credit and borrowing play a role – wages are far more important.
From there, what we find with consumption trends will drive behaviour (or investment) in manufacturing and services.
In turn, the capital spending sector of the economy (spending on plants and equipment) follows.
These three sectors of economic activity— consumer spending, industrial production and services, and capital spending—represent the core of corporate profits produced.
Therefore, it follows that the equity market – as measure of future corporate profits – is dependent on what we see with consumer spending.
How much of this is priced into the market today?
From Kolanvic’s perspective – it isn’t – perhaps blinded by the “AI trade”?
As I said earlier, the market’s short-term direction is often heavily influenced by a myriad other psychological and valuation factors.
The takeaway here is consumption patterns leads the economy (it doesn’t lag)
My guess is Kolanovic is working to be ‘ahead of the curve’.
Putting it All Together
There are typically four stages to an economic cycle.
The key to long-term successful investing is knowing where we are in this cycle (and hence – when to speculate).
For example:
Stage 1 – The peak. This is best characterised by strong Real GDP (e.g. above 3.0%) and consumer spending. Corporate profits are showing strong gains, and the employment picture is universally strong as the market enjoys record highs. Interest rates are generally rising in response. Investors almost unanimously embrace a rosy business outlook.
- Stage 2 – Modest slowing / Things feel “ok”. Growth starts to show signs of slowing (sub 2.0%). The bright outlook of Stage 1 gives way to a period of moderate slowdown in the rate of growth particularly in consumer spending at the front end of the cycle. Retail sales growth slows and there are calls for interest rate cuts. However, growth is still strong enough to not upset business and investor optimism. Capital spending and employment would still be growing at a strong pace (accompanied by much happy talk about a “full-employment economy” and “soft landing”). Few forecasters fear that a recession and the stock market continues its advance or maybe due to take a 5-10% breather.
- Stage 3: Intensifying worry. The economy enters a period of more intense worry, in which the calls for rate cuts become loud. The rate of growth in real consumer spending and real GDP had slowed from a peak to “moderate growth” (e.g., sub 2-3%) and economists and others would begin to contemplate the possibility that the economy could enter a recession. Conjecture grows about the depths of a possible recession. The stock market may have given up more than 10% – and there’s talk of a bear market. However, analysts will cite talk of strong capital spending and a very low unemployment rate (Remember: employment is lagging)
- Stage 4: Recession. The economy enters the recession. There’s a decline in real GDP, with corporate profits falling significantly, capital spending beginning to weaken, and—perhaps most alarmingly—the first major increases in the unemployment rate. Fears of a protracted decline would now become more widespread – with argument about when the recession actually began. During the early phases of this stage – stocks continue to decline (e.g., in the realm of 20% to 50%) – as investors are paralyzed by fear. There is typically widespread pessimism – the opposite of the sentiment we find in Stage 1. However, at some point during the recession, when economic conditions were at their worst, stock prices start to advance as investors price in the inevitable recovery.
My best guess is we are somewhere in Stage 2.
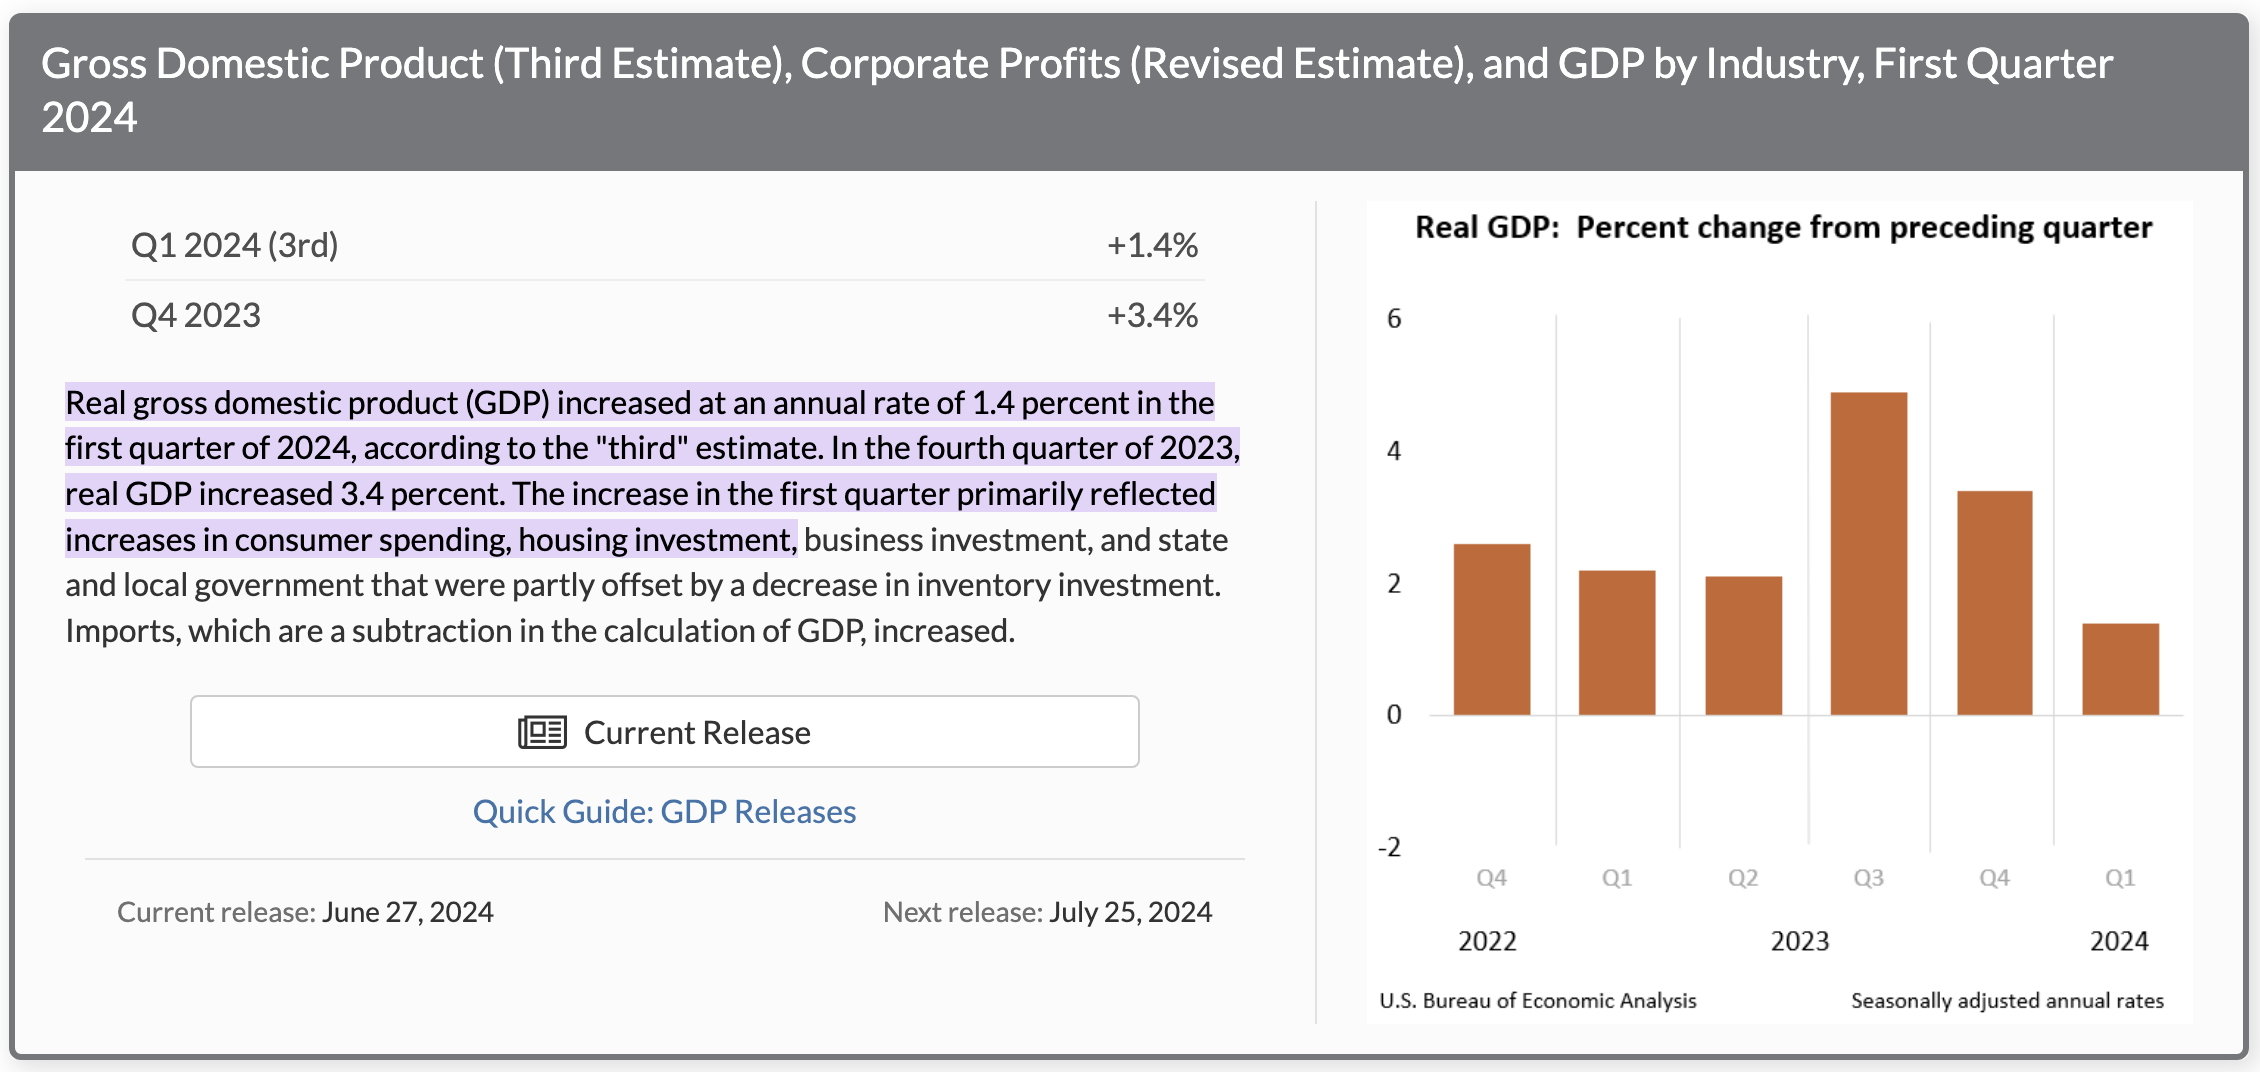
For example, we find Real GDP below-trend at 1.4% and consumer spend is slowing sharply.
And whilst capital spending remains strong (e.g., AI chip demand) and unemployment remains low at 4.0% – they are far less consequential.
The narrative from most analysts is for a “soft landing”
From here, we will enter Stage 3.
If correct, over the next 6-9 months (or thereabouts) we will hear a growing chorus for rate cuts and conjecture start to grow about the depths of a possible recession.
That’s why Kolanovic is forecasting the S&P 500 to trade some 23% lower over the next 6 months.
He is of the view Stage 3 will be here by the end of the year.
I would not be too quick to dismiss his forecast… there are definitive signs of growth slowing. The consumer is feeling the pinch of higher prices.
They are clearly becoming far more cautious.
What you need to ask yourself is whether you think the risk is to the downside?
And if you think it is – it would be prudent to take insurance.


