- More Fed to equal more volatility
- Another positive year for stocks… but not a repeat of ’21
- Buying opportunity in H1 on Fed worries
It’s the first trading day of 2022.
I hope you all had a great New Year’s.
Markets are off to a flying start… creating yet another record close.
Will 2022 echoe 2021?
That’s a question I will explore below.
Beforehand, the so-called ‘Santa Rally’ looks intact.
The final five trading sessions of December plus the first two in January is said to average a 1.40% gain.
So far we stand at 1.50%.
A positive close tomorrow will seal the deal.
This missive will look at what I think will be the most important (or influential) charts for this year.
Spoiler alert: much of this centers on inflation, rates and of course the Fed.
For shits and giggles, I will offer a zone I think the S&P 500 will finish the year.
Last year (for example) I felt the market would deliver gains of around 12%… we more than doubled that number (which shows I’m not much of a forecaster!)
5 Most Important Charts for 2022
#1. WTI Crude
The first chart I think that could have a major bearing on how both the economy and financial markets perform is WTI Crude.
Let’s start with the monthly chart:
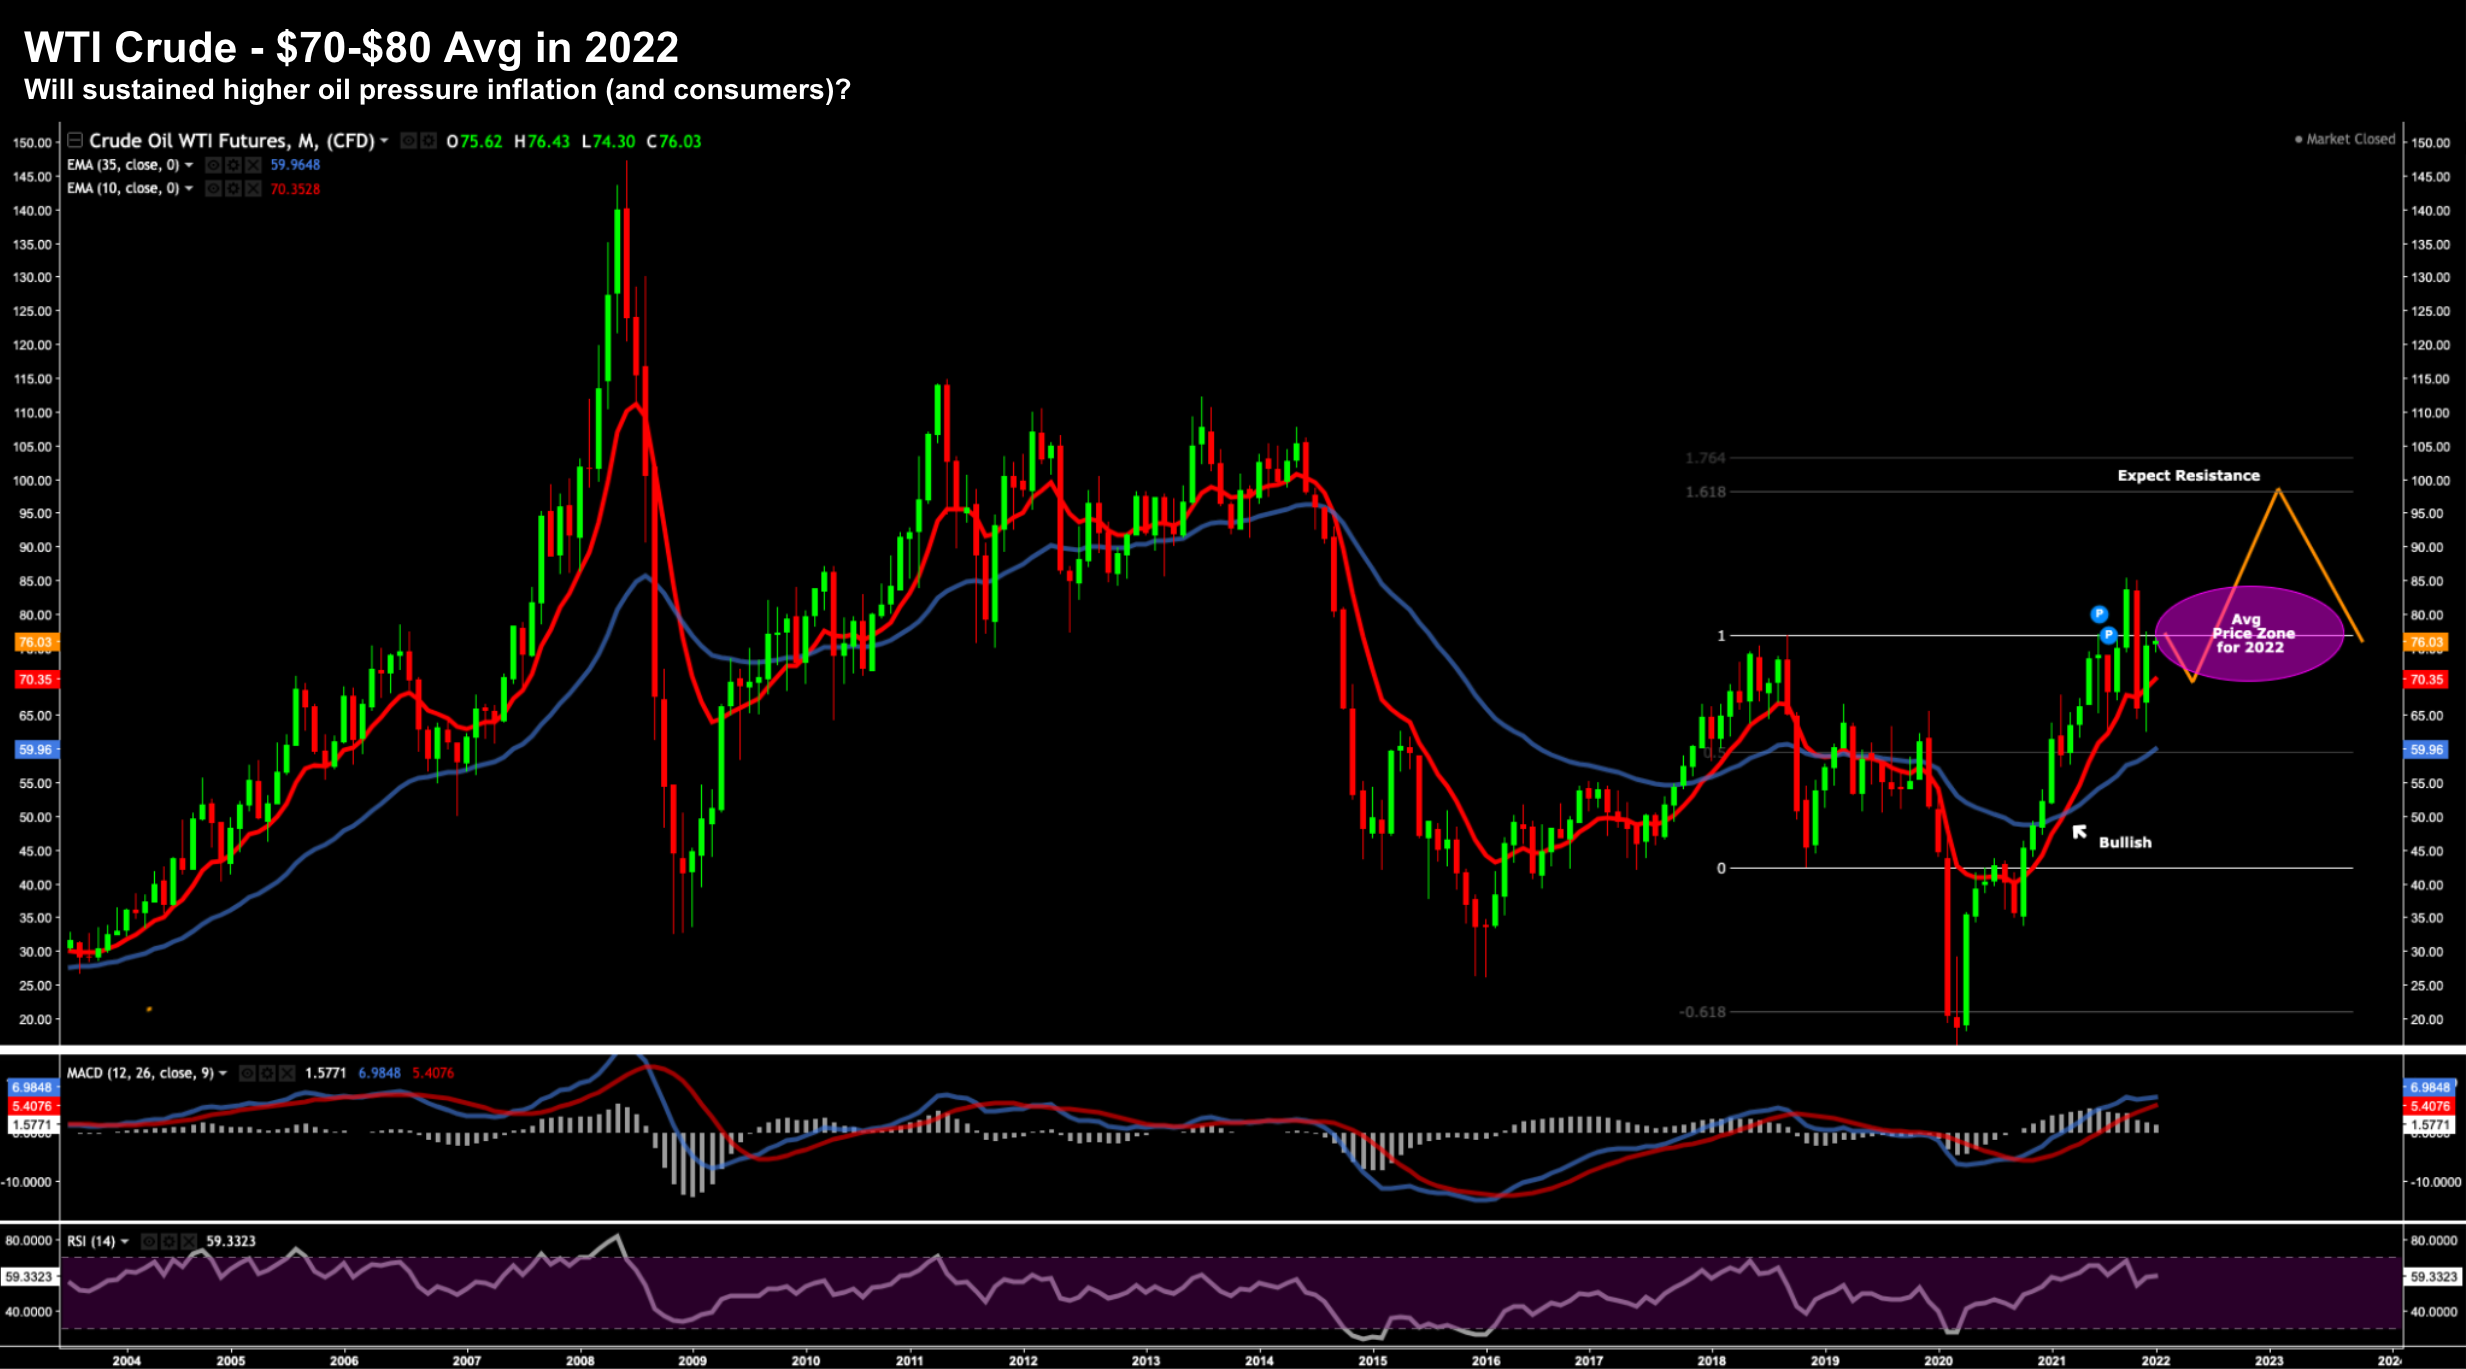
WTI Crude – Heading Higher in 2022
My best guess here is to expect sustained higher prices.
For example, technically I expect WTI Crude to test (and likely exceed) $100.
However, I think WTI will mostly trade in the zone of $75 to $85.
Technically, the monthly trend remains bullish (turning in March 2021) with the 10-month EMA trading well above the 35-month EMA.
Furthermore, we saw crude revert to the 35-month EMA – where it found expected support and rallied.
Beyond the bullish technical setup – the fundamental picture also looks bullish.
For example, it’s looking more likely we will experience significant capacity-led shortfalls.
We’re already seeing a substantial decline out of US production (mostly opposite the US government’s policy on fossil fuels) – but we’re also likely to see less supply from OPEC+
The Organization of the Petroleum Exporting Countries (OPEC) and its allies (e.g. Russia) are once again a price maker – and they will most likely restrain supply.
What’s more, global demand for oil is only likely to increase (especially if we see a cold winter) in turn driving up prices.
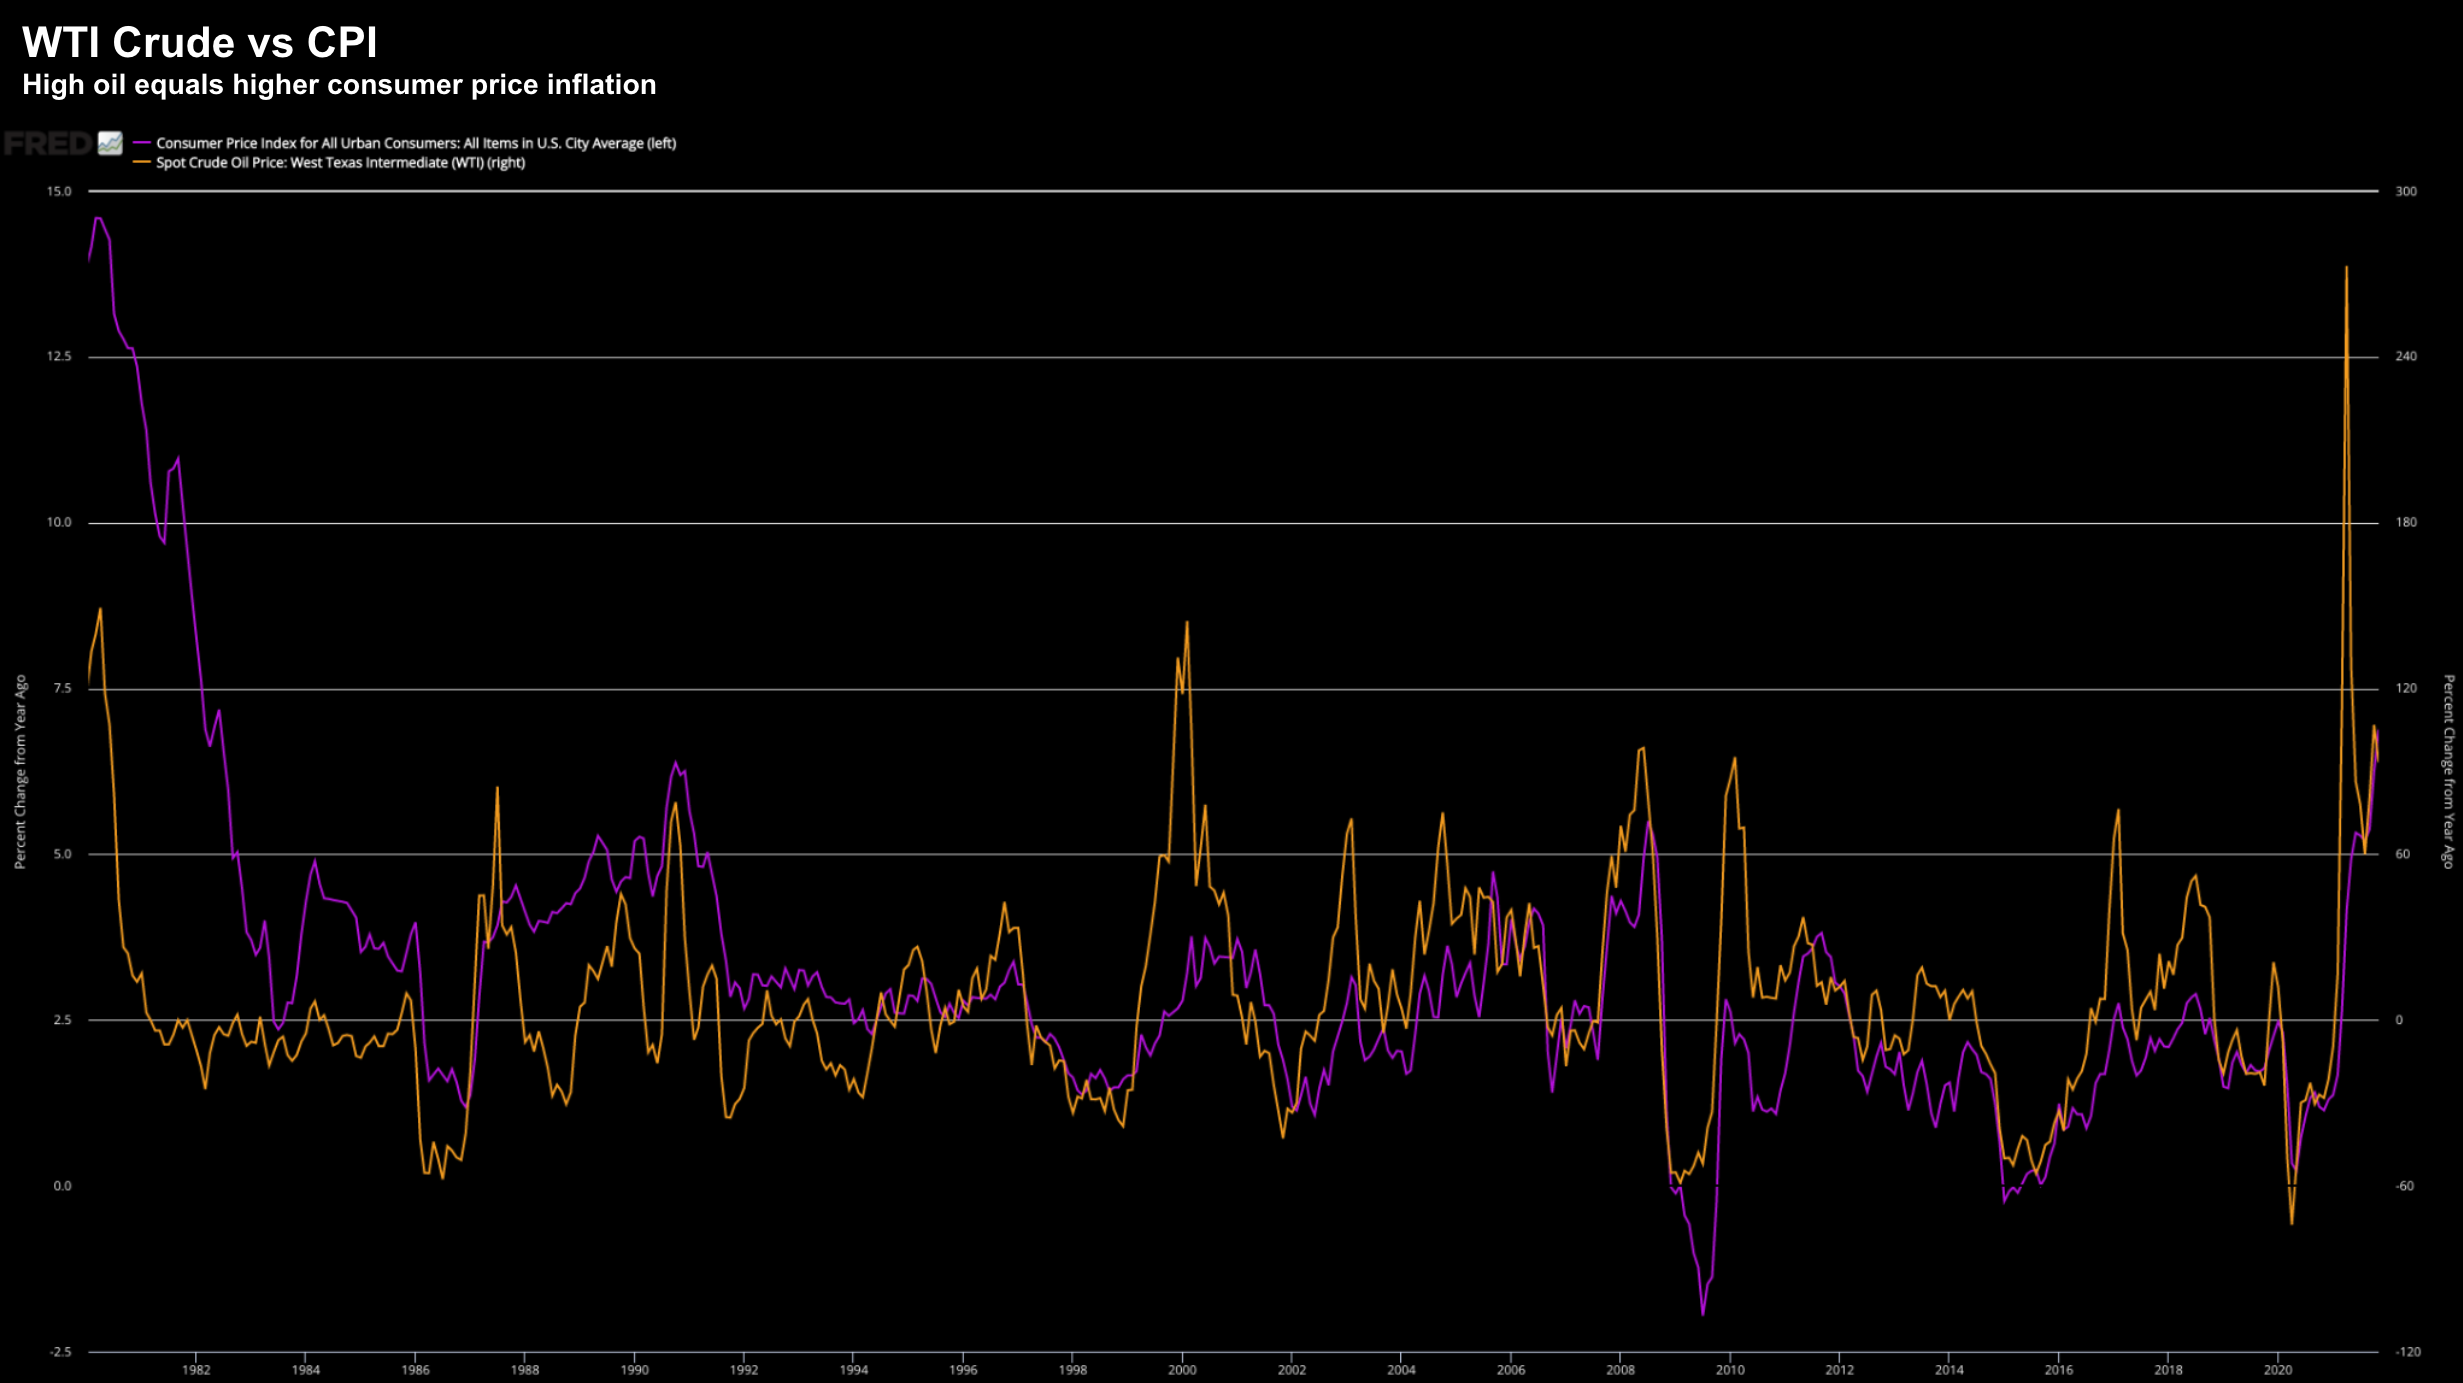
Higher oil prices will not be a welcomed development for US consumers and/or the current Administration (as a “price taker”).
This will only further compound inflationary pressures (in turn pressing the Fed) — acting as yet another ‘tax’ on those who can least afford it (another discussion).
WTI Crude vs CPI
#2. 10-Year Treasury Yield
My second chart is US Treasury yields.
And specifically the 10-year.
Today these bonds sold off sharply – which sent longer-term yields sharply higher.
Now last year I felt we would see the US 10-year trading closer to 2.00%
It didn’t happen… not even close.
These yields were unable to exceed 1.80% before crashing.
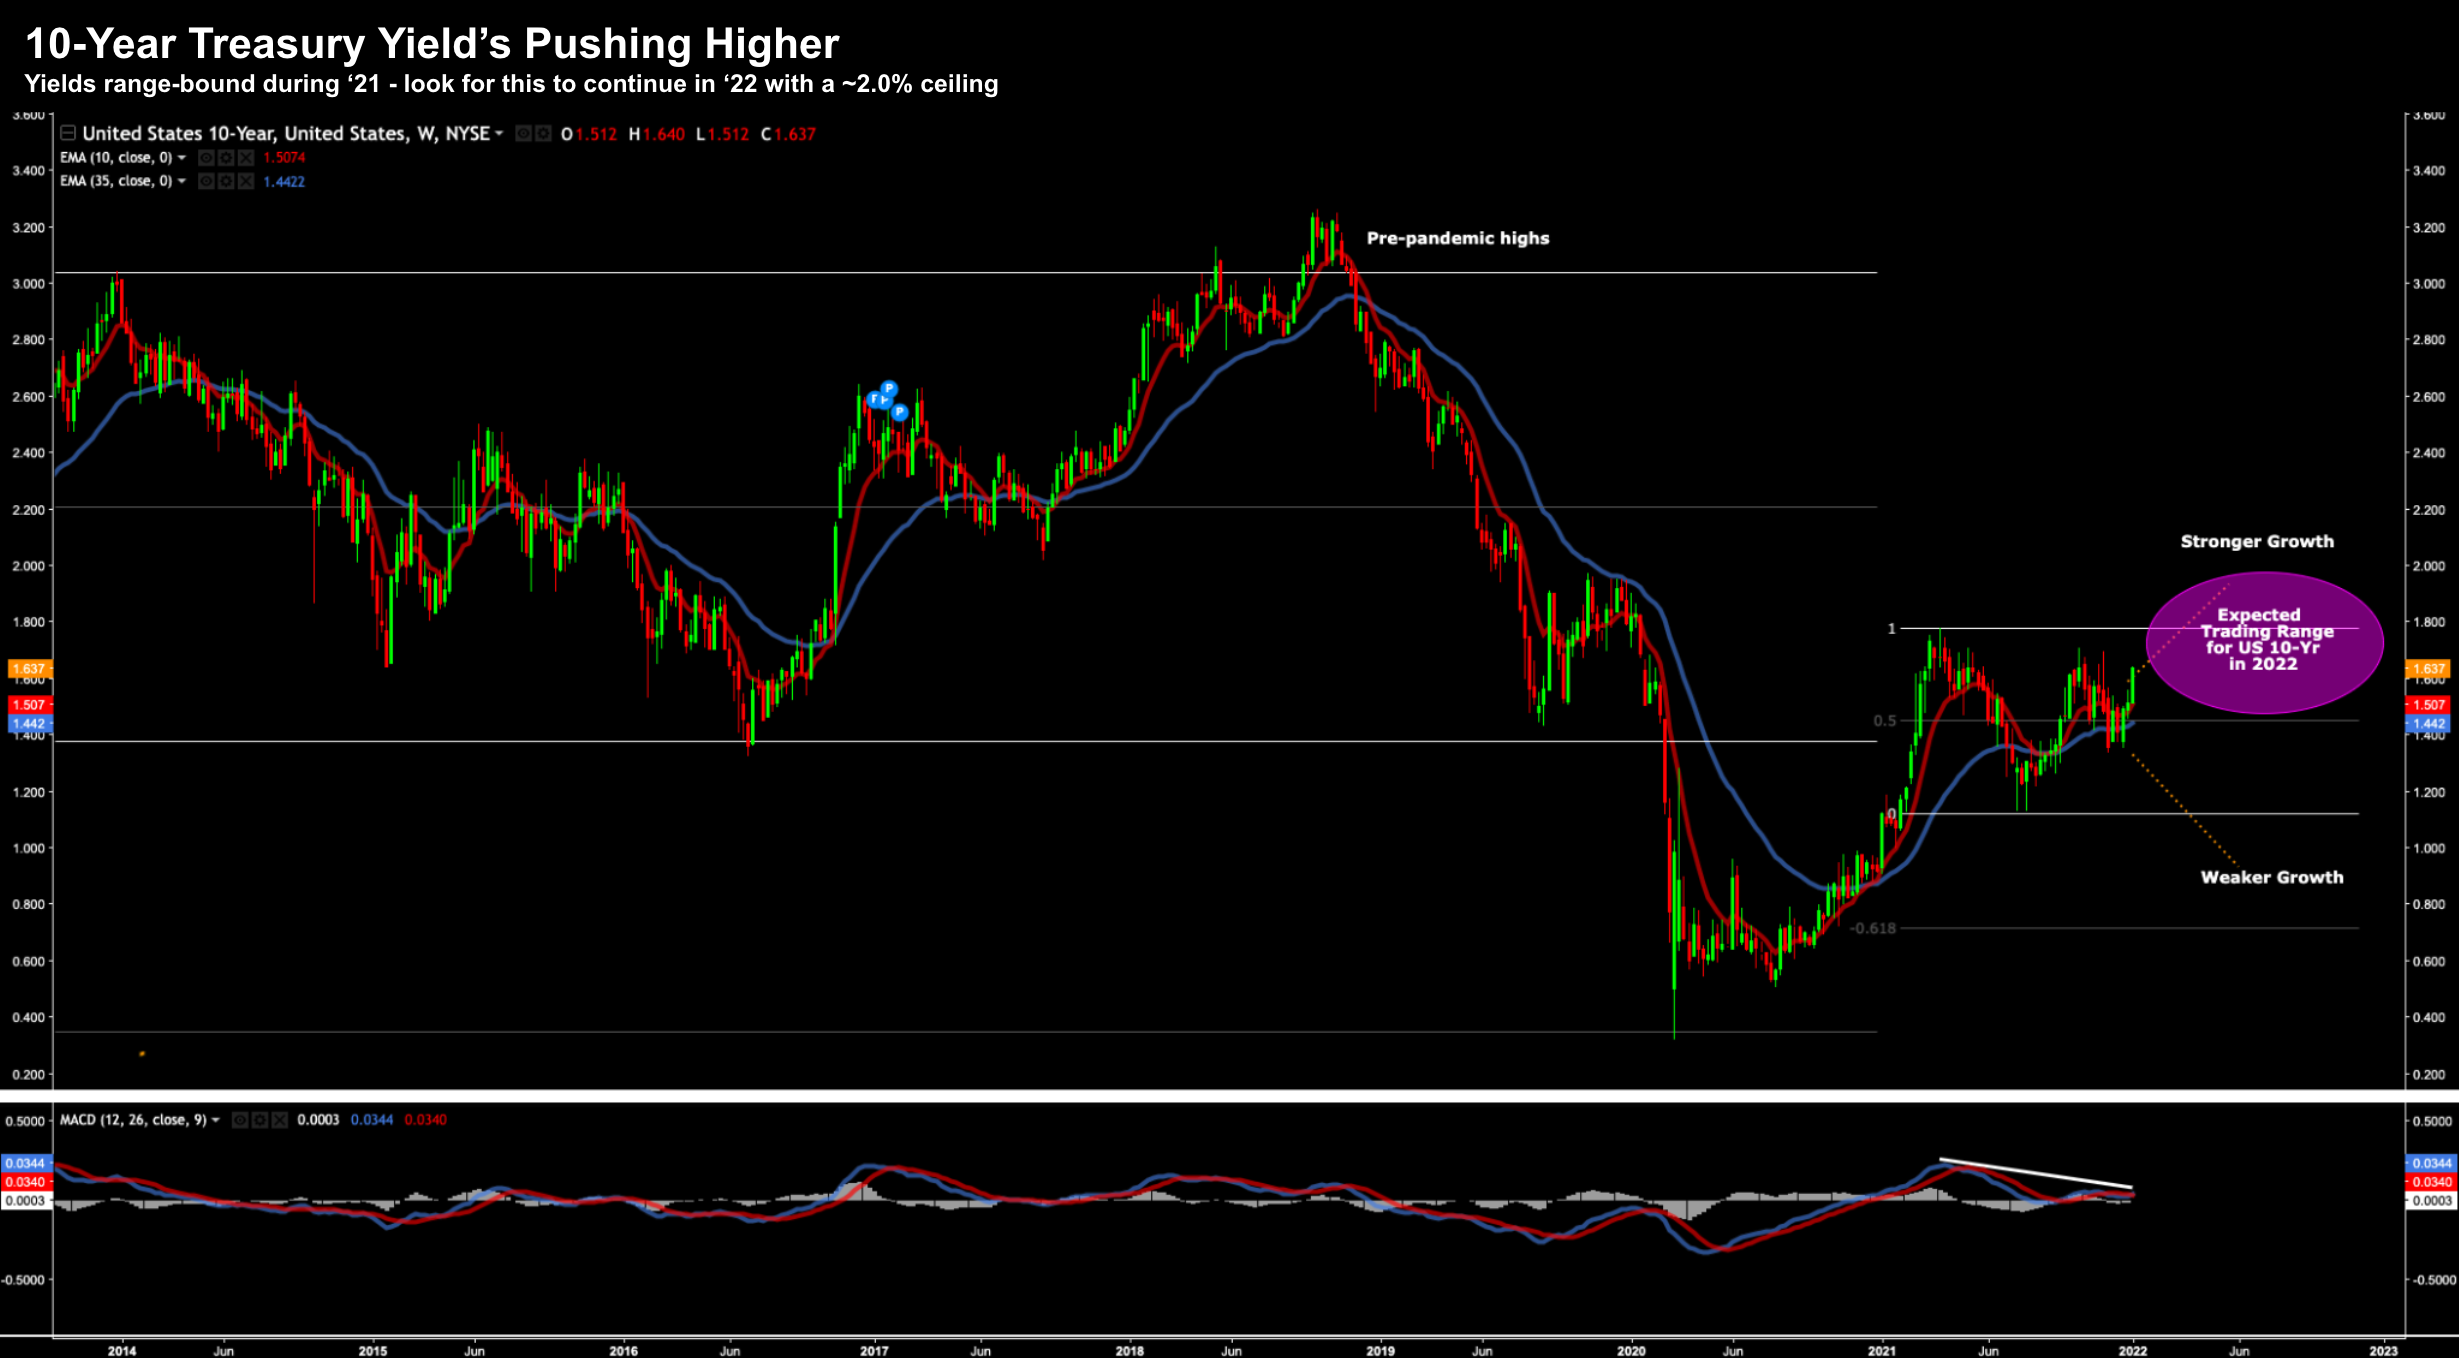
Today the 10-year trades 1.64% – some 0.30% higher than only three weeks ago as it makes another run towards this level.
US 10-Year Treasury – Jan 3 2022
The good news is higher yields are a sign of the bond market becoming more optimistic on growth ahead.
In other words, they are selling (more defensive) bonds and seeking higher risk / higher return assets.
That’s a good thing.
However, the growth outlook is now far less clear than what it was 6 months ago.
For example, we have the Fed looking to tighten policy; Biden’s eye-watering $2 Trillion spending bill is dead; and Omicron’s spread poses some questions.
I would not be surprised to see the 10-year range bound between 1.5% and 2.0%.
That’s not to say we could see periods above and below this zone (not unlike crude overshooting $100) – however that’s where I expect these yields to mostly trade.
However, if we see yields explode to the upside in quick time, this would pose a risk to the market (and specifically growth stocks)
#3. 2/10 Yield Curve
A higher 10-year yield will certainly help “steepen” the yield curve.
One of the more widely-cited yield curves is the difference between the 2-year treasury yield and the 10-year.
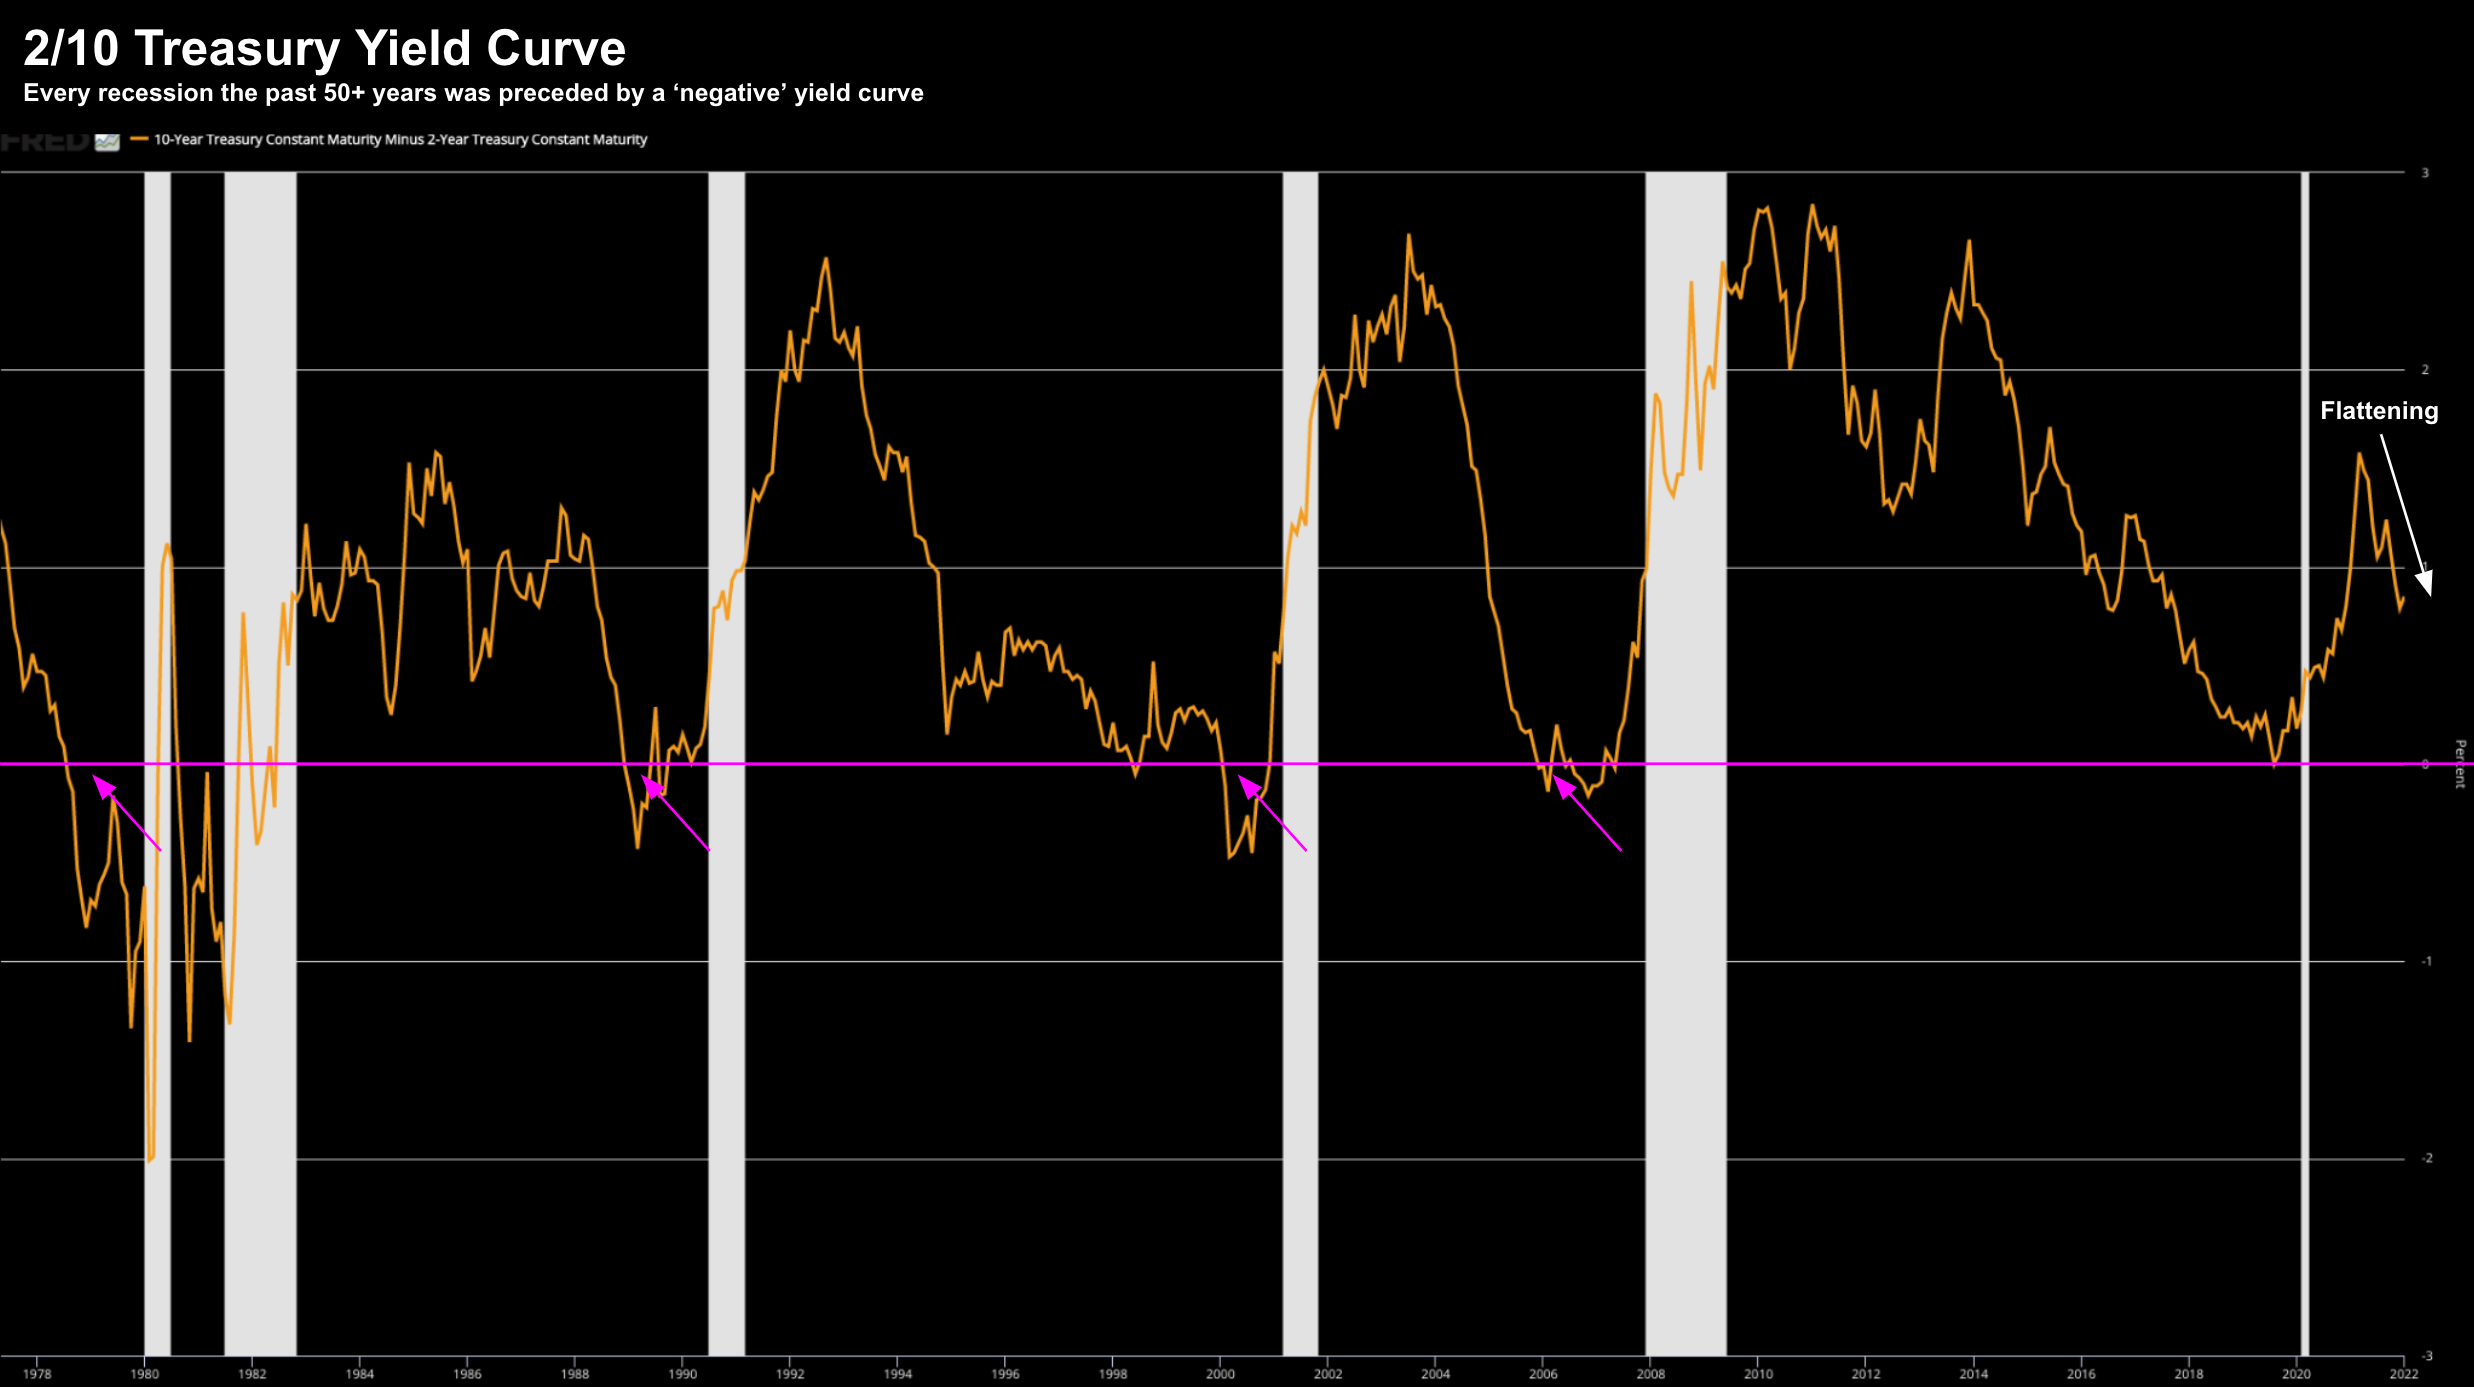
2/10 Year Yield Curve – Jan 3 2022
This is one of the more accurate recession indicators we have…
What I will be most interested in is whether we challenge the pink “zero” percent line.
For example, with the Fed likely to hike at least three times to combat unwanted inflation (starting as soon as March) – this will flatten the curve if we don’t see similar gains in the 10-year.
Personally, I think we will maintain a positive slope this year… but nothing like what we saw the previous few years (e.g. above 2.0%)
#4. Core PCE Inflation
My penultimate chart is the Fed’s preferred measure of inflation: Core PCE
It’s now trading at near a 40-year high – leading the Fed to drop the term “transitory” when describing higher-than-expected inflation as of November.
Core PCE Inflation – Jan 3 2022
It’s hard to know how long Core PCE will persist at this level.
What’s clear is inflation is here with us for a few months yet… as supply chain snarls and growing labor shortages persist.
The threat of Omicron spreading isn’t helping this!
What remains unknown is how effective (and aggressive) the Fed will be in their quest to put the “inflation genie back in the bottle”?
And from there, just how much inflation can be reversed (as many elements will stick)?
For example, are things like wages and rents about to reverse?
Unlikely.
Now if Core PCE reverses sharply – this will remove pressure from the Fed and will bode well for markets.
However, if it persists, it’s hard to see how this isn’t a headwind for the market.
#5. US Dollar Index
My final chart is the all-mighty greenback.
In short, a stronger dollar will likely be a head-wind (especially
However, the counter to that is a stronger dollar will be deflationary (which will help the Fed in its quest to tame inflation).
My expectation is for a stronger dollar in 2022 opposite a higher rates.
Jan 3 2022
That said, the dollar index has already priced in the Fed moving at least three times this year.
It’s plausible that if the Fed does not follow through on three rate hikes (and many think that’s the case) – the dollar will likely reverse.
Generally speaking, a weaker US dollar index is a positive for equities, global markets and gold.
S&P 500 Forecast
As a preface, forecasting precise year-end levels for the S&P 500 serves little purpose.
I think that kind of forecasting is largely a fool’s errand.
That aside, on average, the market generally does well following a 20%+ year.
And I think that will be the case this year…
For example, S&P 500 has produced at least 25% annual returns (including dividends) only 18 times since 1950.
But in the following year, the broad-based index rose 82% of the time, notching average annual gains of 14%
Two of the three years where stocks failed to rise, 1981 and 1990, coincided with recessions.
But as regular readers know (and supported by the 2/10 yield curve) – I see virtually no risk of recession in 2022 (n.b., read more about when I see a recession here).
The other downside market outlier was 1962 – which was challenged by a flash crash.
In summary, probabilities (if nothing else) favour a positive year.
However, I don’t see a repeat of 2021.
From mine, I see high single-digit gains where the downside risk slightly exceeds the upside.
My approach to what I expect is to offer a zone — dimensioning the potential upside vs any downside risk.
And from there, we assess whether that’s favourable.
Jan 3 2022 – S&P 500
For example, here I’ve nominated a range from:
- ~4,100 on the downside (i.e. ~15%); and
- ~5,200 on the upside (i.e. ~9%)
That said, if we’re fortunate enough to experience a 10% to 15% decline I will be a buyer of quality companies (some mentioned in my previous post).
I also think the decline is more likely to come in the first half of the year – with the catalyst being hawish Fed language.
For example, I see markets worrying the Fed are applying the breaks a little too hard… perhaps sparking some panic selling.
To that end, I have also see a volatility spike.
The VIX trades with a handle of 16 at the time of writing – which significantly underestimates some of these risks (i.e. downside protection is cheap).
Finally, I remain very wary of the negative divergence we see with the weekly-MACD
Whilst not a sell signal in isolation, this indicator fails to confirm the rally and suggests a correction is likely.
Putting it All Together…
2021 only saw two ~5% pullbacks all year – which is unusual.
I doubt that will repeat.
I also don’t think the S&P 500 will generate another 20%+ year.
It will most likely be positive – but more in-line with longer-term market averages (i.e. ~10%)
My biggest concern this year is not COVID or government’s shutting their economies – it will be actions from the Fed.
The Fed have now been forced to play their hand.
And whilst we know monetary support levels will be reduced (i.e. tapering asset purchases and raising short-term rates)… the question is by how much and when?
And perhaps the answer largely depends on inflation.
This is why I nominated WTI Crude as one of the more important charts this year.
From mine, the global economy can ill-afford sustain levels of above US$100 – however this is where OPEC+ will want to take it (and why wouldn’t they?!)
So what will that do to consumer confidence and spending?
It’s not helpful.
Put together, indices are likely to post further gains in 2022 but it’s unlikely to be smooth sailing.
In short, more Fed equals more volatility.
Be ready for it and embrace it.
For example, if presented with the opportunity to buy quality names at discounted levels… take it.
In closing, this post will probably make me look foolish towards the end of 2022.
But that’s okay… it won’t be the first time!
All we can do is play the cards we are dealt.


