- A healthy sign when the market pauses for air
- A strong shift into more value / defensive names
- Companies missing earnings getting hit hard
For almost 23 straight weeks (from late October) – the market has effectively gone straight up.
It added something like $12T in market cap with barely a pause.
Call it a ‘rally for the ages’.
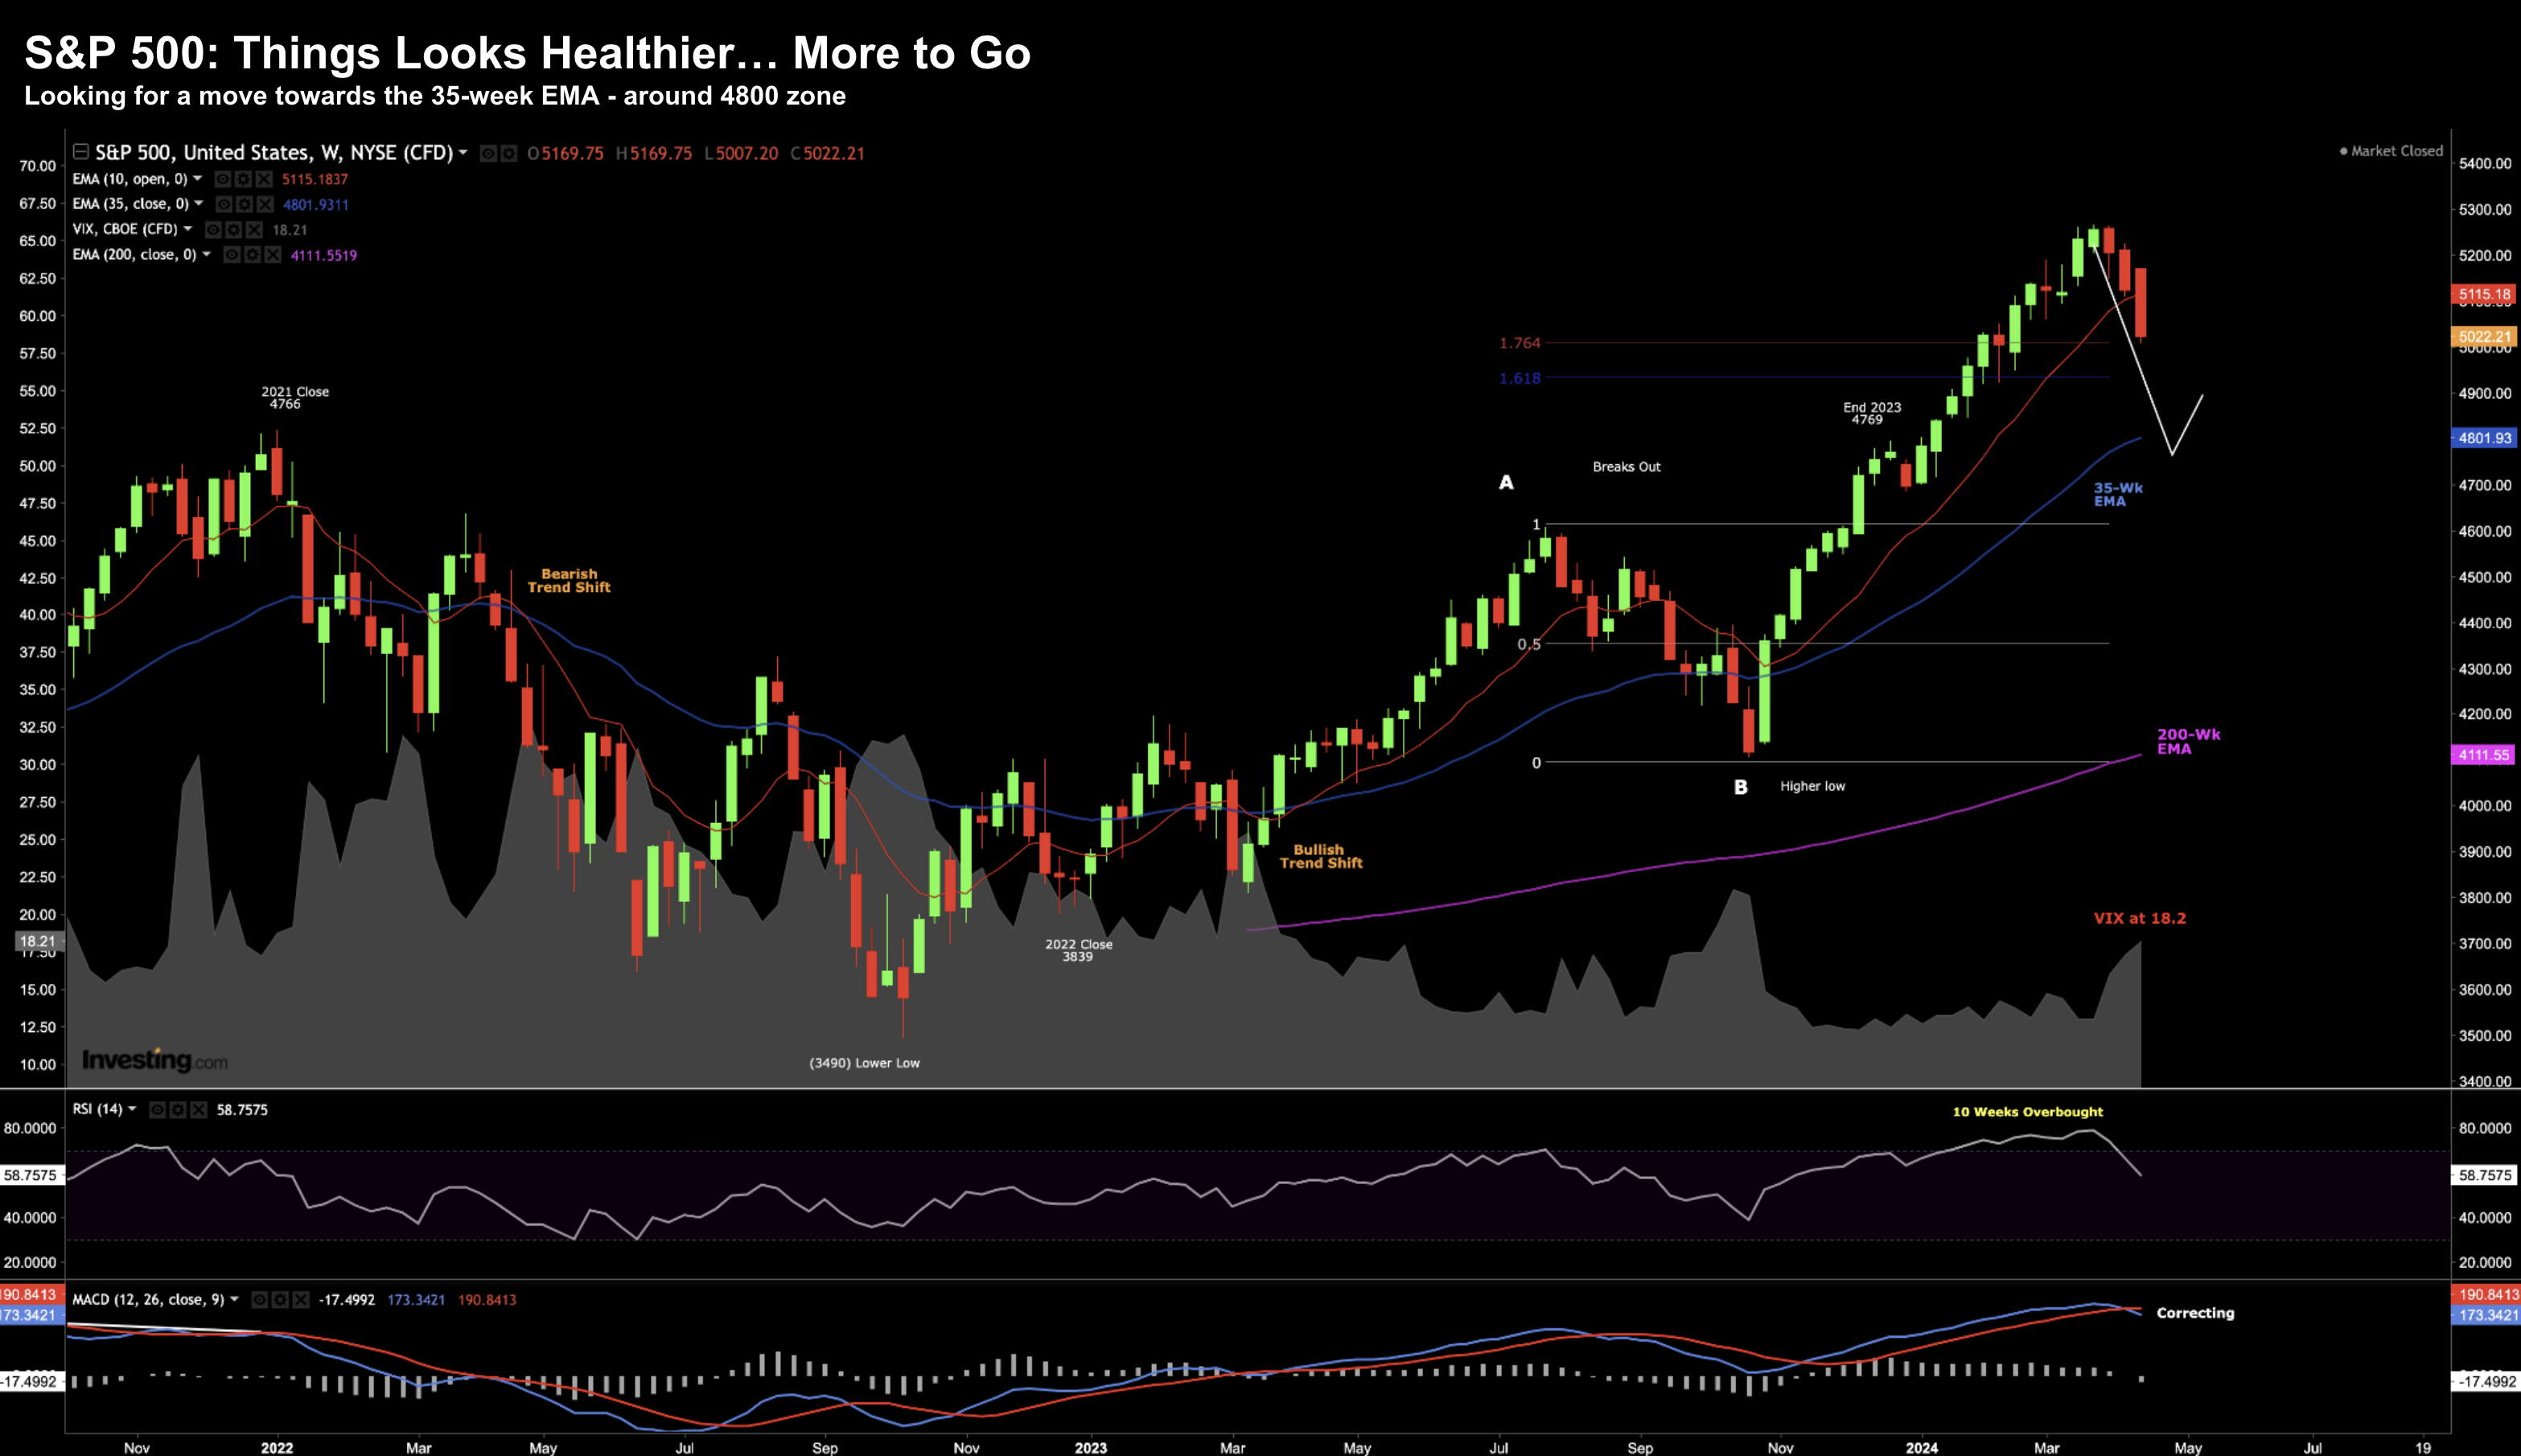
Now for ten of those weeks (in 2024), it was in overbought territory.
This is where the Relative Strength Index (RSI) trades above a value of 70.
If you scroll back through some of my posts – I cautioned readers in this zone (more on this shortly when I share the chart for the S&P 500)
And whilst I said that the market can remain overbought for several weeks (and it did) – it’s also an area to be cautious.
This is where sell-offs start.
And it seems we could be seeing the start of a solid 7-10% correction… however it’s still early.
S&P 500 Looking Healthier
We know that market’s rise over the long-run.
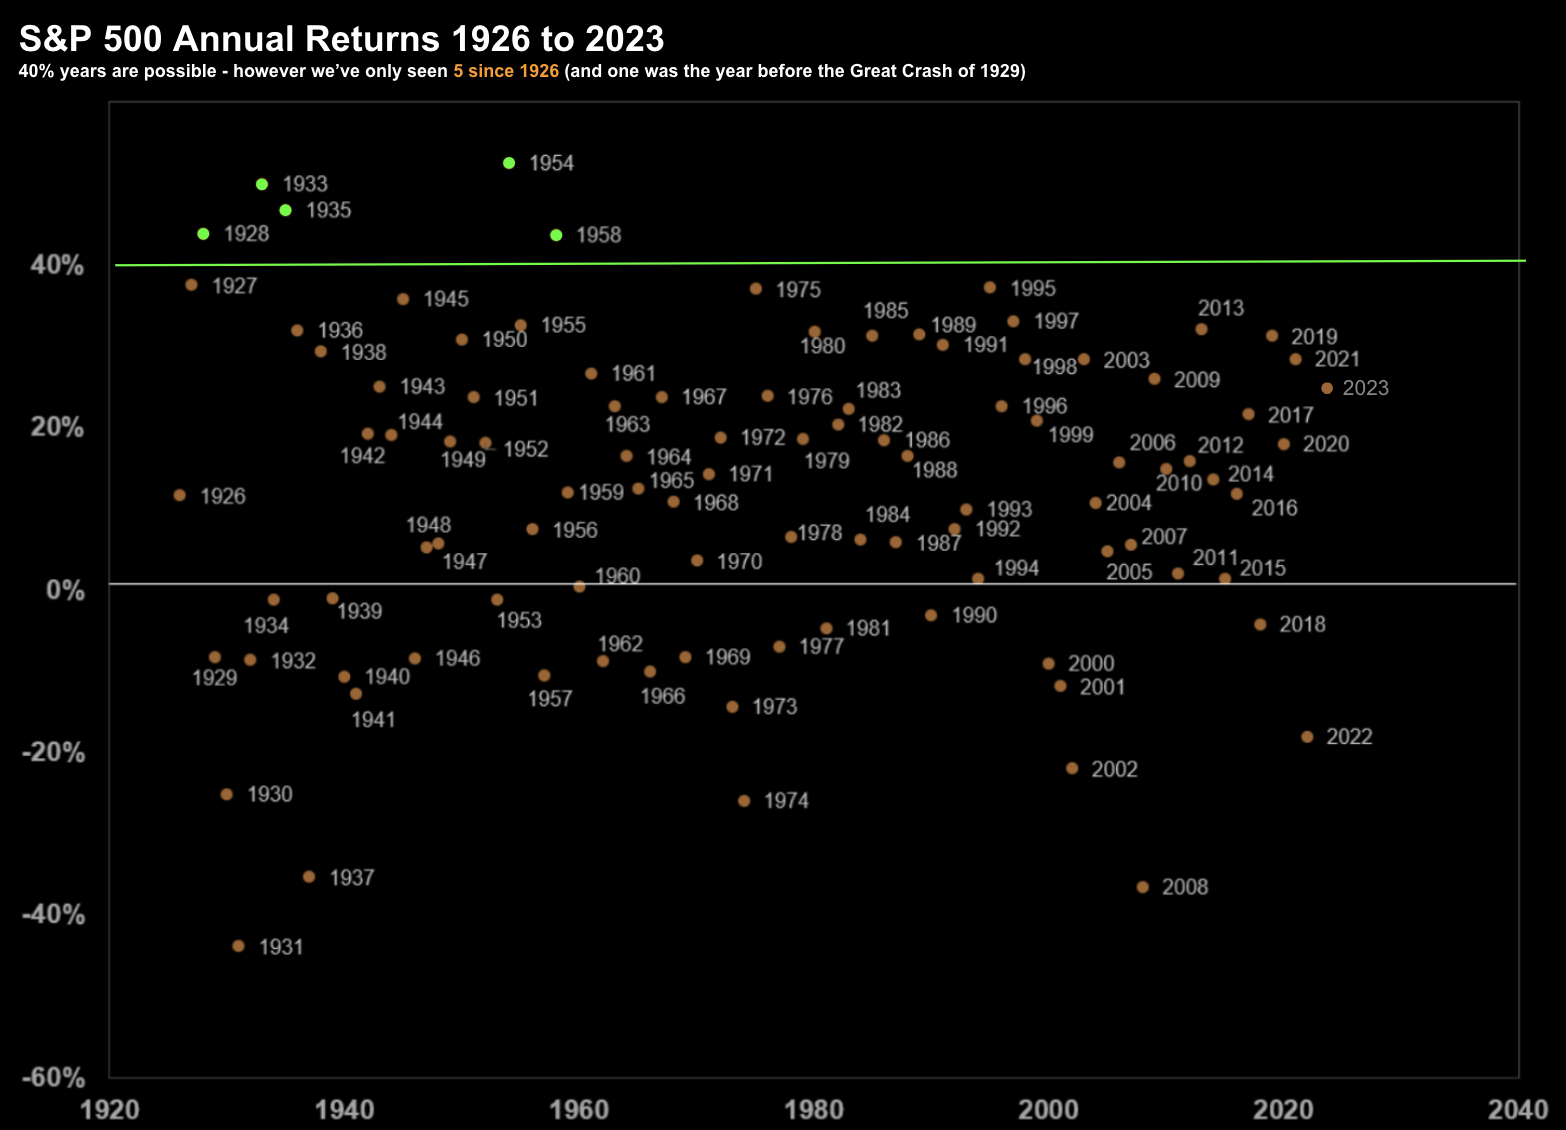
Put another way – there are far more positive return years than negative ones (as the chart below shows)
This is why it always pays to be long risk assets… it’s simply a better bet.
However, I draw your attention to the green dots.
Rarely does the S&P 500 rally at a rate of 40%+ annualized.
This prompted me to write the post (and ask the question) “S&P 500 Up 10.1% for Q1 – Can it Continue?”
My argument was it’s possible – but highly unlikely.
The plot above shows the S&P 500 annual returns from 1926 through to 2023
5 times in ~100 years has the market gained over 40% in any one year (and not since 1958)
But I was concerned about the velocity of gains… it felt unsustainable.
And at some point – things were going to take a pause:
April 17 2024
Here we see the pullback in play.
And whilst there are still two trading days left in the week – we could see three consecutive “red” candles.
For technicians – that’s ominous – as it typically implies further downside.
Over the past few years, when we’ve seen three consecutive weekly red candles, more downside was to come.
That said, I am not bearish.
We remain in a strong bullish trend – where the 10-week EMA trades well above the 35-week EMA.
From my (bullish) lens, the S&P 500 could test the zone of 4800 (i.e. the 35-week EMA) and still look bullish.
That’s what I expect (and hope) we see – before the market catches a bid and probably moves higher.
What I’m Watching
As I was saying recently, if the market is to advance beyond 5200 this year, it will depend on earnings.
This quarter is expected to show growth of 7% YoY.
However, the full year is expected to realize earnings growth in the realm of 11-12%.
And whilst the earnings season is still very early – I have noticed the market penalize losers a lot more than it is rewarding a winner.
JP Morgan (JPM) vs Goldman Sachs (GS) is a good example.
JPM was crushed after its earnings (as net interest income falls) – however GS was not (greatly) rewarded for its strong result.
The other thing I’ve noticed is fund rotation.
Money is coming out of growth (e.g., the so-called Mag 7) and into value / defensive names.
For example, the S&P 500 Value Index (SVX) was down only -2.5% vs say S&P 500 Growth Index (SGX) about -5.5%
From mine, this makes sense.
Those names trading at very aggressive PE ratios (above 30x) are struggling opposite higher rates.
The other thing I’m watching is volatility.
My view was the market was overly complacent – ignoring many of the risks (e.g., my call for the Fed not cutting rates at all this year – at time when three rate cuts were favoured)
The VIX was trading ~13 (see below) – where I felt it could move back above 20 quickly.
I offered this long term ‘fear index’ chart:
After today, the VIX is back above 18.7
That’s still not high but it’s moved up quickly.
It turns out that investors have decided to hedge their bets after all.
Go figure.
Putting it All Together
Sometimes it’s tempting to chase momentum.
It feels like money is burning a hole in your pocket.
It’s frustrating. And I get it.
About a month ago – my personal YTD returns trailed the market by around 7.5%.
I was being left behind… but I was not tempted to chase.
It’s something I’ve experienced many times in the past.
Now with the market up ~5.0% YTD – that delta is now only ~3.0%
I think we’ll see a more attractive entry for the S&P 500 in the coming weeks… something closer to ~4800
My feeling is the S&P 500 can pull back in the realm of 7-10% – which will be an opportunity to capitalize.
But let me stress – that’s still not “cheap”.
For example, cheap would be something in the realm of 16x forward earnings (i.e., $245 x 16 = 3920) – however buying quality between 4600 and 4800 offers less downside risk than buying it at say 5200 (as some investors clearly did)
Stay patient.


