- Analyzing the bull market of 2022 to 2024
- Two mega tech names have reported – investors are worried
- Whilst we can’t predict the future – we can always plan
“For that which a man wishes, that he will believe” — Charlie Munger
From mine, Munger’s quote is particularly relevant.
Charlie was saying when wishful thinking takes hold – investors tend to believe that good times will be followed by more good times.
This mentality feeds on itself – driving momentum – pushing prices higher.
It’s what fuels the final stages of a bull market.
Attributes such as independent thought, logic, rationale and objectivity give way to herd behavior.
However, that’s when your internal alarm bells starting ringing.
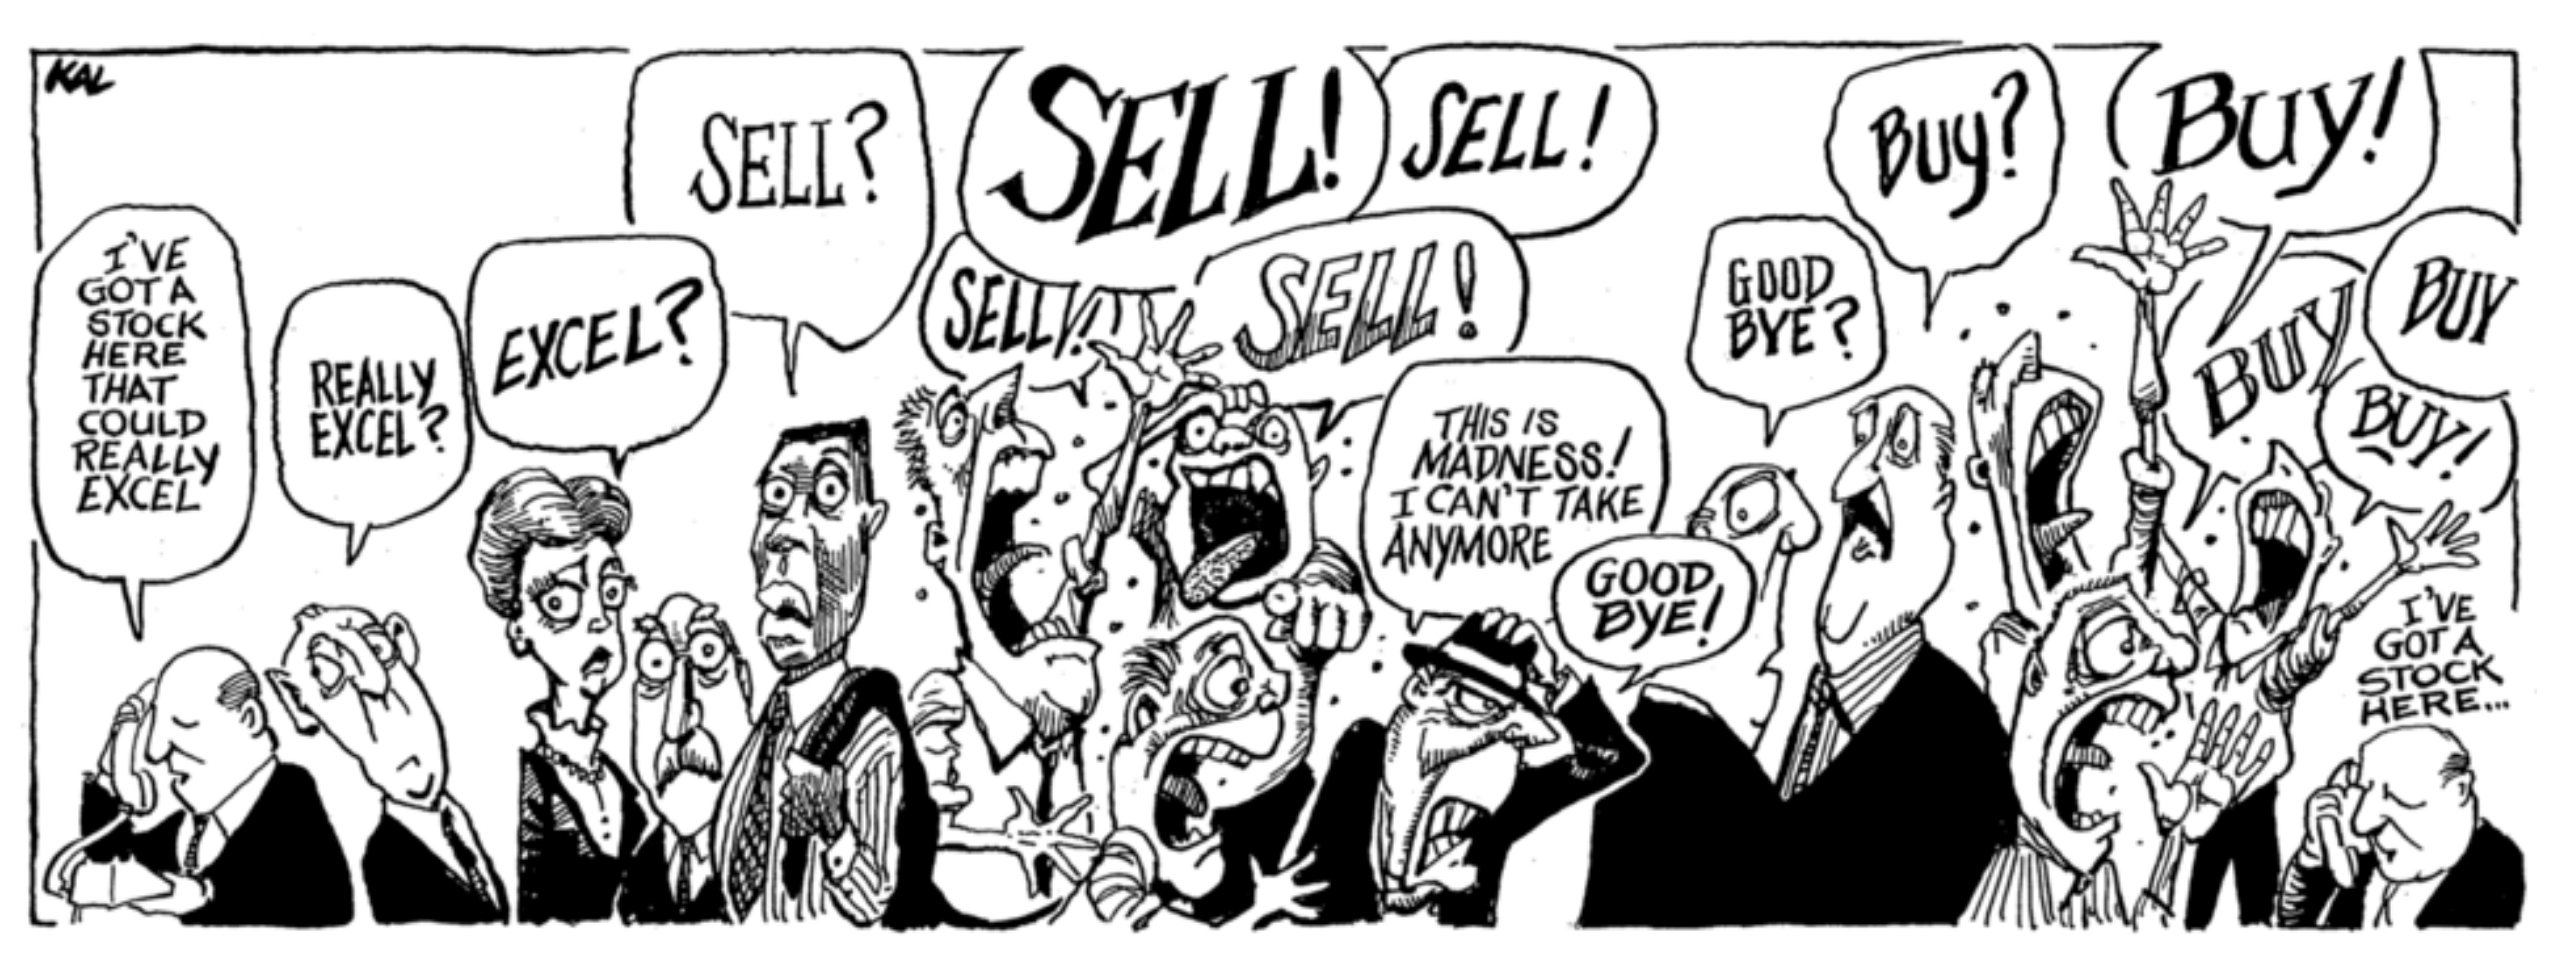
Something is usually afoot when everyone is yelling “buy“.
Post July 10th – large-cap tech has pulled back to the tune of 10-20% from its highs.
Correction or something more?
Meta is down ~15%; Nvidia down ~20% and Alphabet – after an ‘earnings beat’ – is down ~13%.
Is the crowd changing its sentiment?
That’s hard to say – however when stocks fall in the realm of 20% – something is afoot.
More on this later when I look at the charts for Tesla and Alphabet….
There could be more downside ahead…
But let’s look to what got us here.
It’s difficult to know where you’re going if you don’t understand how and why you got here.
Knowing this may also help to explain why a stock like Google can lose “13%” after a so-called ‘earnings beat’.
Three Stages to Every Bull
Lately I’ve been talking to the importance of understanding the cyclical nature of markets.
My motivation is what we’ve seen with the S&P 500 and specifically large-cap tech.
Let’s consider the broader index…
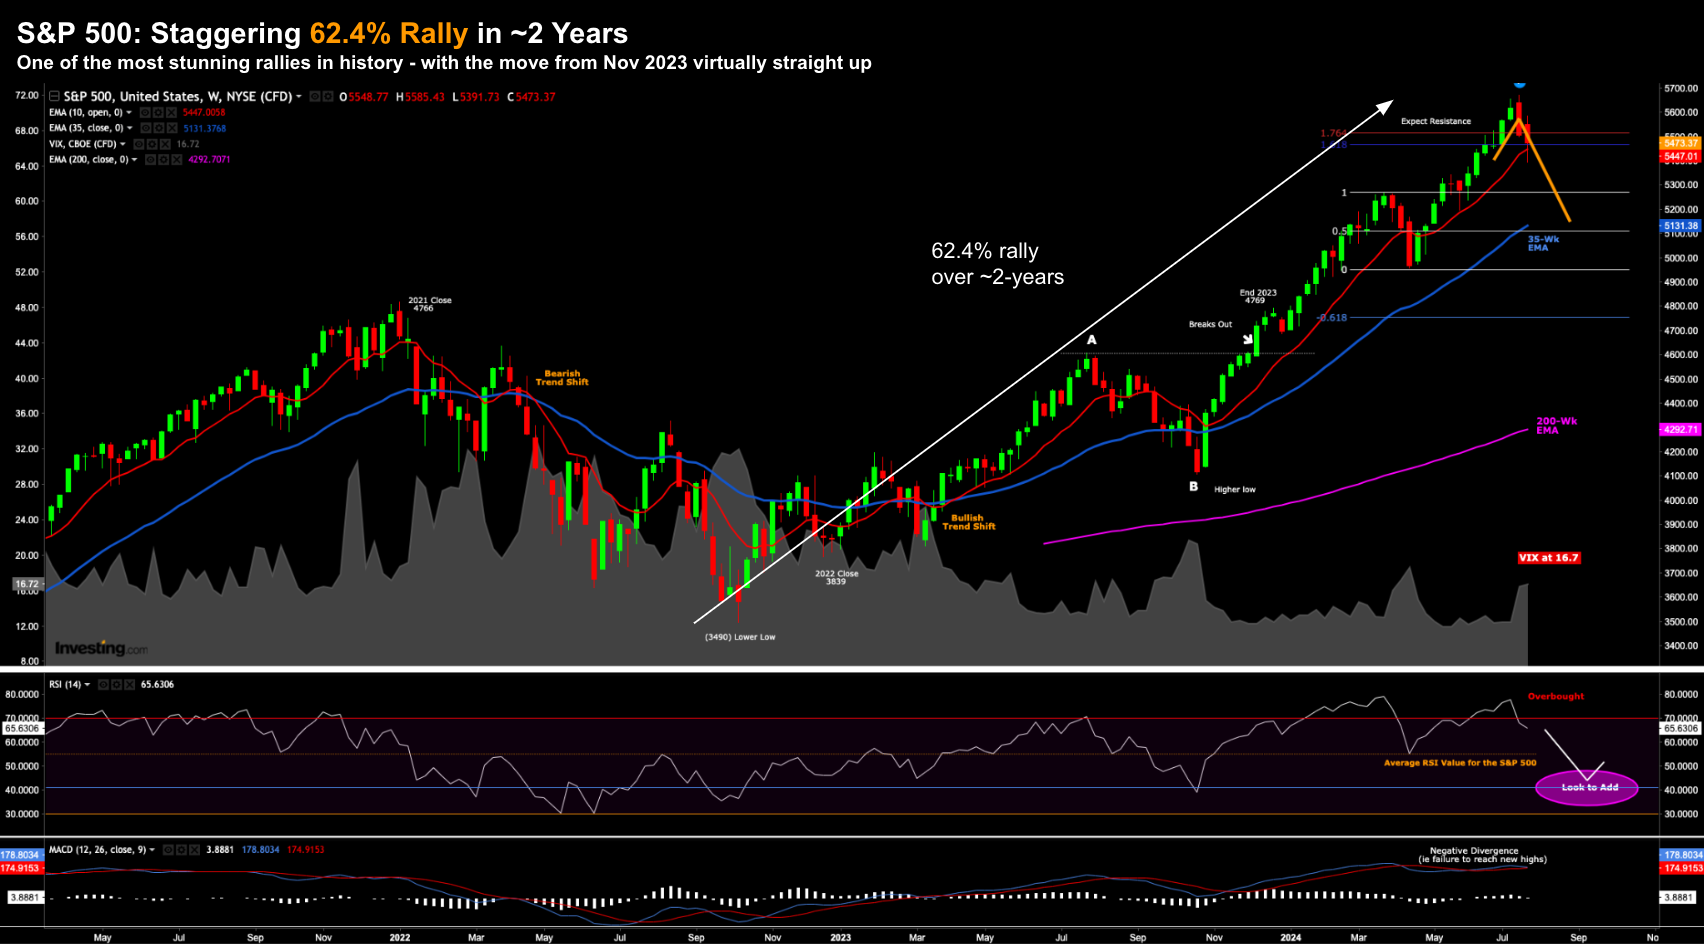
Since October 2022 – it’s up some 62.4%
July 25 2024
It’s an incredible rally and arguably one the strongest bull markets we’ve seen in decades.
By way of example, the last day the market saw more than 2.0% decline in any one single day was Dec 15th 2022.
That’s 357 trading days.
Investor enthusiasm has been nothing shy of uber-bullish.
But let’s talk more the three stages of a bull market – as described by Howard Marks in his book “Mastering the Market Cycle”.
- Stage 1: Only a few unusually perceptive people believe things will get better;
- Stage 2: Most investors begin to realize that improvement is actually taking place; and finally
- Stage 3: When everyone concludes there is no risk and things will get better in perpetuity.
Stage 1: A Few Perceptive Investors
During the first three quarters of 2022 – investor sentiment was bleak.
The S&P 500 had declined ~28% (peak to trough) and parts of the economy were in recession (e.g., manufacturing).
Earnings growth was negative year over year and growth was slow.
But as stocks fell from their January 4766 high to trade ~3600 in September (with a forward PE of ~16x with EPS ~$225) – stocks looked fairly priced.
Why do I use the word “fair“?
It comes back to our litmus test – what’s the longer-term mean?
At 16x- this was below the 10-year average of ~18x; and in-line with the 100-year average of 15.5x
The market was not excessively cheap – but the risk/reward was favourable.
But let’s put aside forward PE ratios…
There was a leading indicator which suggested there was upside ahead.
Here I’m talking about the shift in consumer spend – which has an excellent record for forecasting cycles
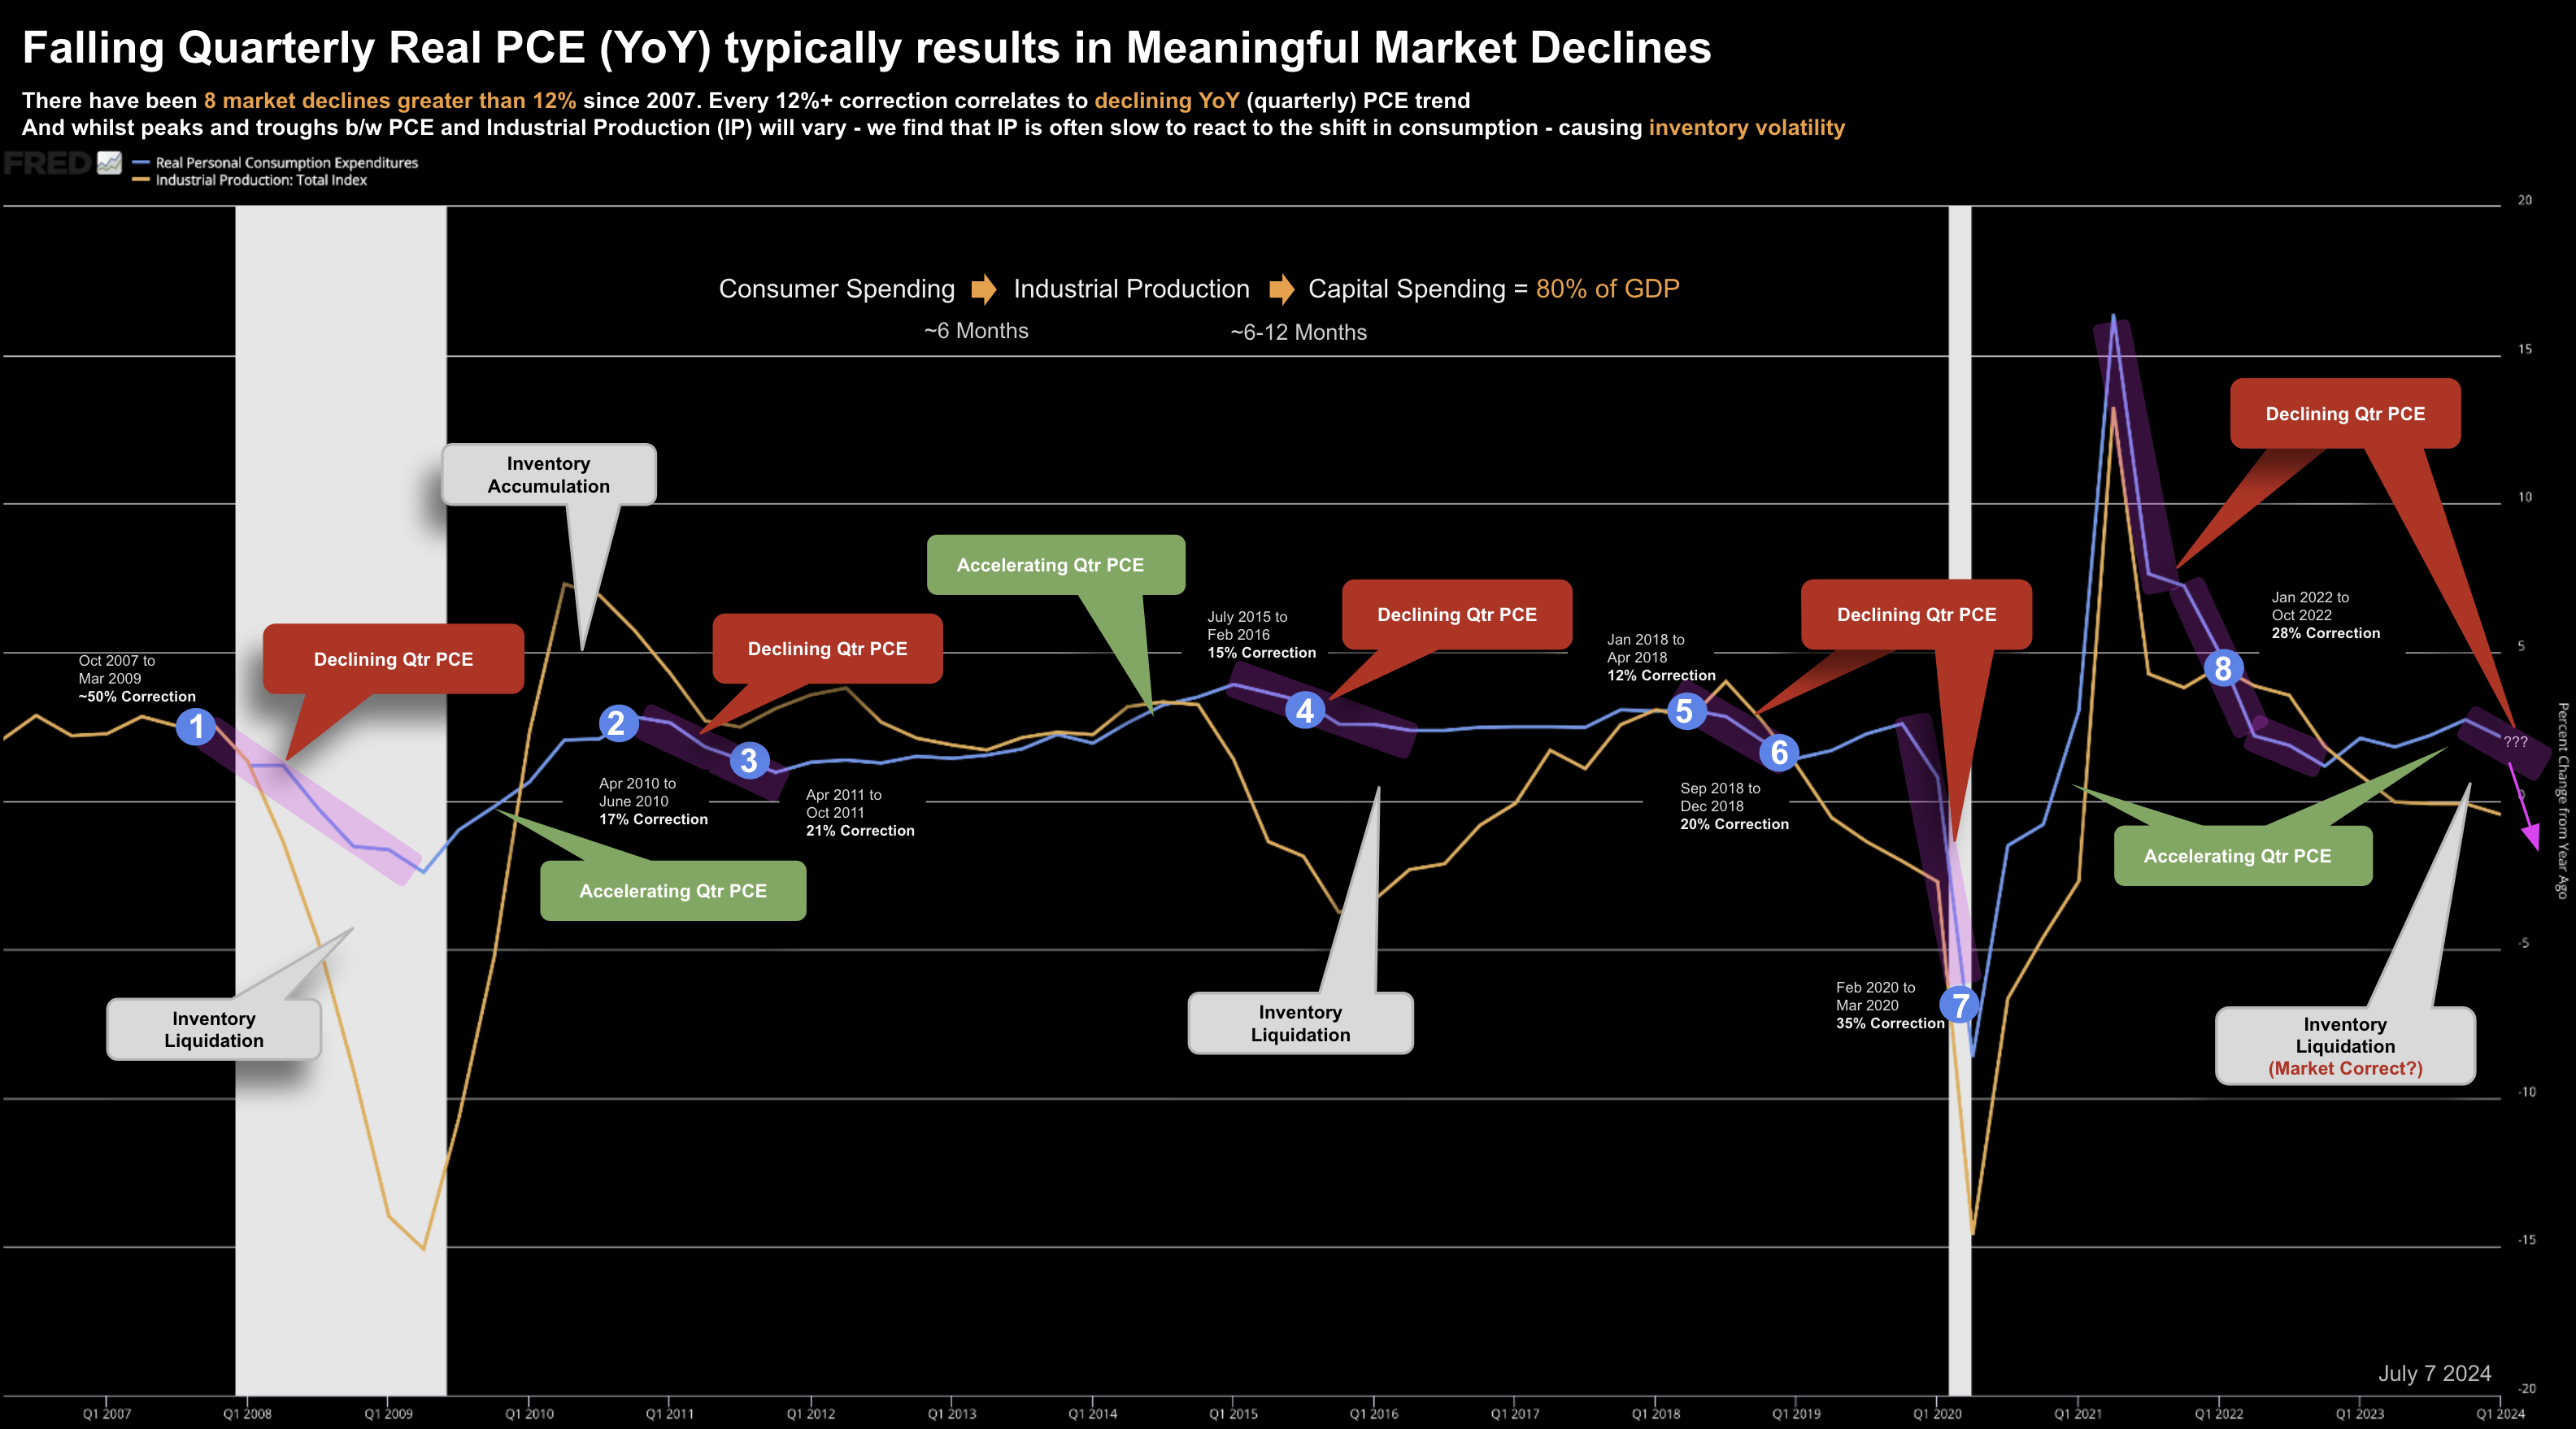
(Note: we get PCE (inflation and spending) this week – where I will update the chart below for Q2)
Using the year-over-year change in quarterly Real PCE, we could see things were shifting as stocks made new lows.
At the time, I decided to add exposure around 3600 (which set me up for a very profitable 20% return year in 2023)
To be clear, I did not know things would work out.
They may not have and the economy could have fallen into recession.
And we can never know….
However, I felt probabilities were more in my favour buying at 3600 (vs adding exposure at 4800 – where I was a big seller)
What’s more, if stocks did happen to fall further (e.g. ~3200 on the S&P 500 or a forward PE of 14x) – then I would add more risk.
But at that time, it would be fair to say the average investor was bearish.
They did not buy at Stage 1.
Following a ~28% retracement – average investors are often too scared to put more capital to work.
Stage 2: Most Realize Things are Improving
With stocks well off their lows – up more than 10-20% – investors start to believe that things are improving.
They see signs of earnings growth – consumers are spending – confidence is rising – and they start wading back into the market.
And whilst investors are still cautious – they are happier taking some risk.
To be fair, this is not a terrible time to add risk, however they will generally not enjoy the bulk of the gains made.
For example, often the largest gains are made when things go from outright “terrible” to just “less bad”.
Again, if we look at our year-over-year change in Quarerly PCE – through all of 2023 – this was rising.
In other words, consumers were spending the trillions of dollars gifted to them by the government (combined with massive pent up savings as a result of COVID lockdowns – ie not being able to spend on services).
And as Real PCE rises – this is generally positive for equities 6-9 months in advance (which proved to be the case through 2023).
As prices continued to rise… and the economic narrative improved… this set the scene for the third (and final) stage.
The sentiment shifted to “you just have to buy this market”…
Stage 3: Everyone is Bullish
By this stage, everyone is able to see that stocks are on a strong run.
They’ve seen events go so well for so long – as prices of all the hottest stocks start to fly.
Looking at our chart, Stage 3 of the 2022/24 bull kicked into gear October last year.
At its recent peak – the S&P 500 was up 38% from the October low.
And it may not be over yet…
The catalyst from mine was ChatGPT (Nov 2023).
This singular event ignited the AI trade – sending large-cap tech stocks into orbit – where just 7 stocks comprised 34% of the total market weight.
Valuations were cast aside… this was entirely a momentum trade.
The battlecry becomes something like “… the greater risk is not owning these names vs the price you’re paying”
During this phase of a bull market – investors tend to extrapolate improvement to infinity.
“AI has limitless opportunity – there is no risk”
Prices are bid higher week-after-week as a reflection of their unbridled optimism.
Turn on CNBC – and it’s an echo chamber.
But as I said in my preface – how many investors were sounding the alarm bells?
Very few.
I was and I didn’t mind being a few months early (which is generally the case for me).
And what’s more – you have to be comfortable with being viewed as flat-out ‘wrong’ for a few months (possibly a year or more)
As I often say – I will never pick tops or bottoms.
From my perspective – there are few things are as costly as paying for (limitless) potential that turns out to be excessively hyped.
But compare that to the investor who invests in the first stage
At the first stage – very few saw reasons to be optimistic on tech; or to buy stocks at depressed levels where appreciation is more likely.
However, if you caught the tech trade at the other end of the spectrum – you’re invariably paying a high price for wide-spread (common) optimism.
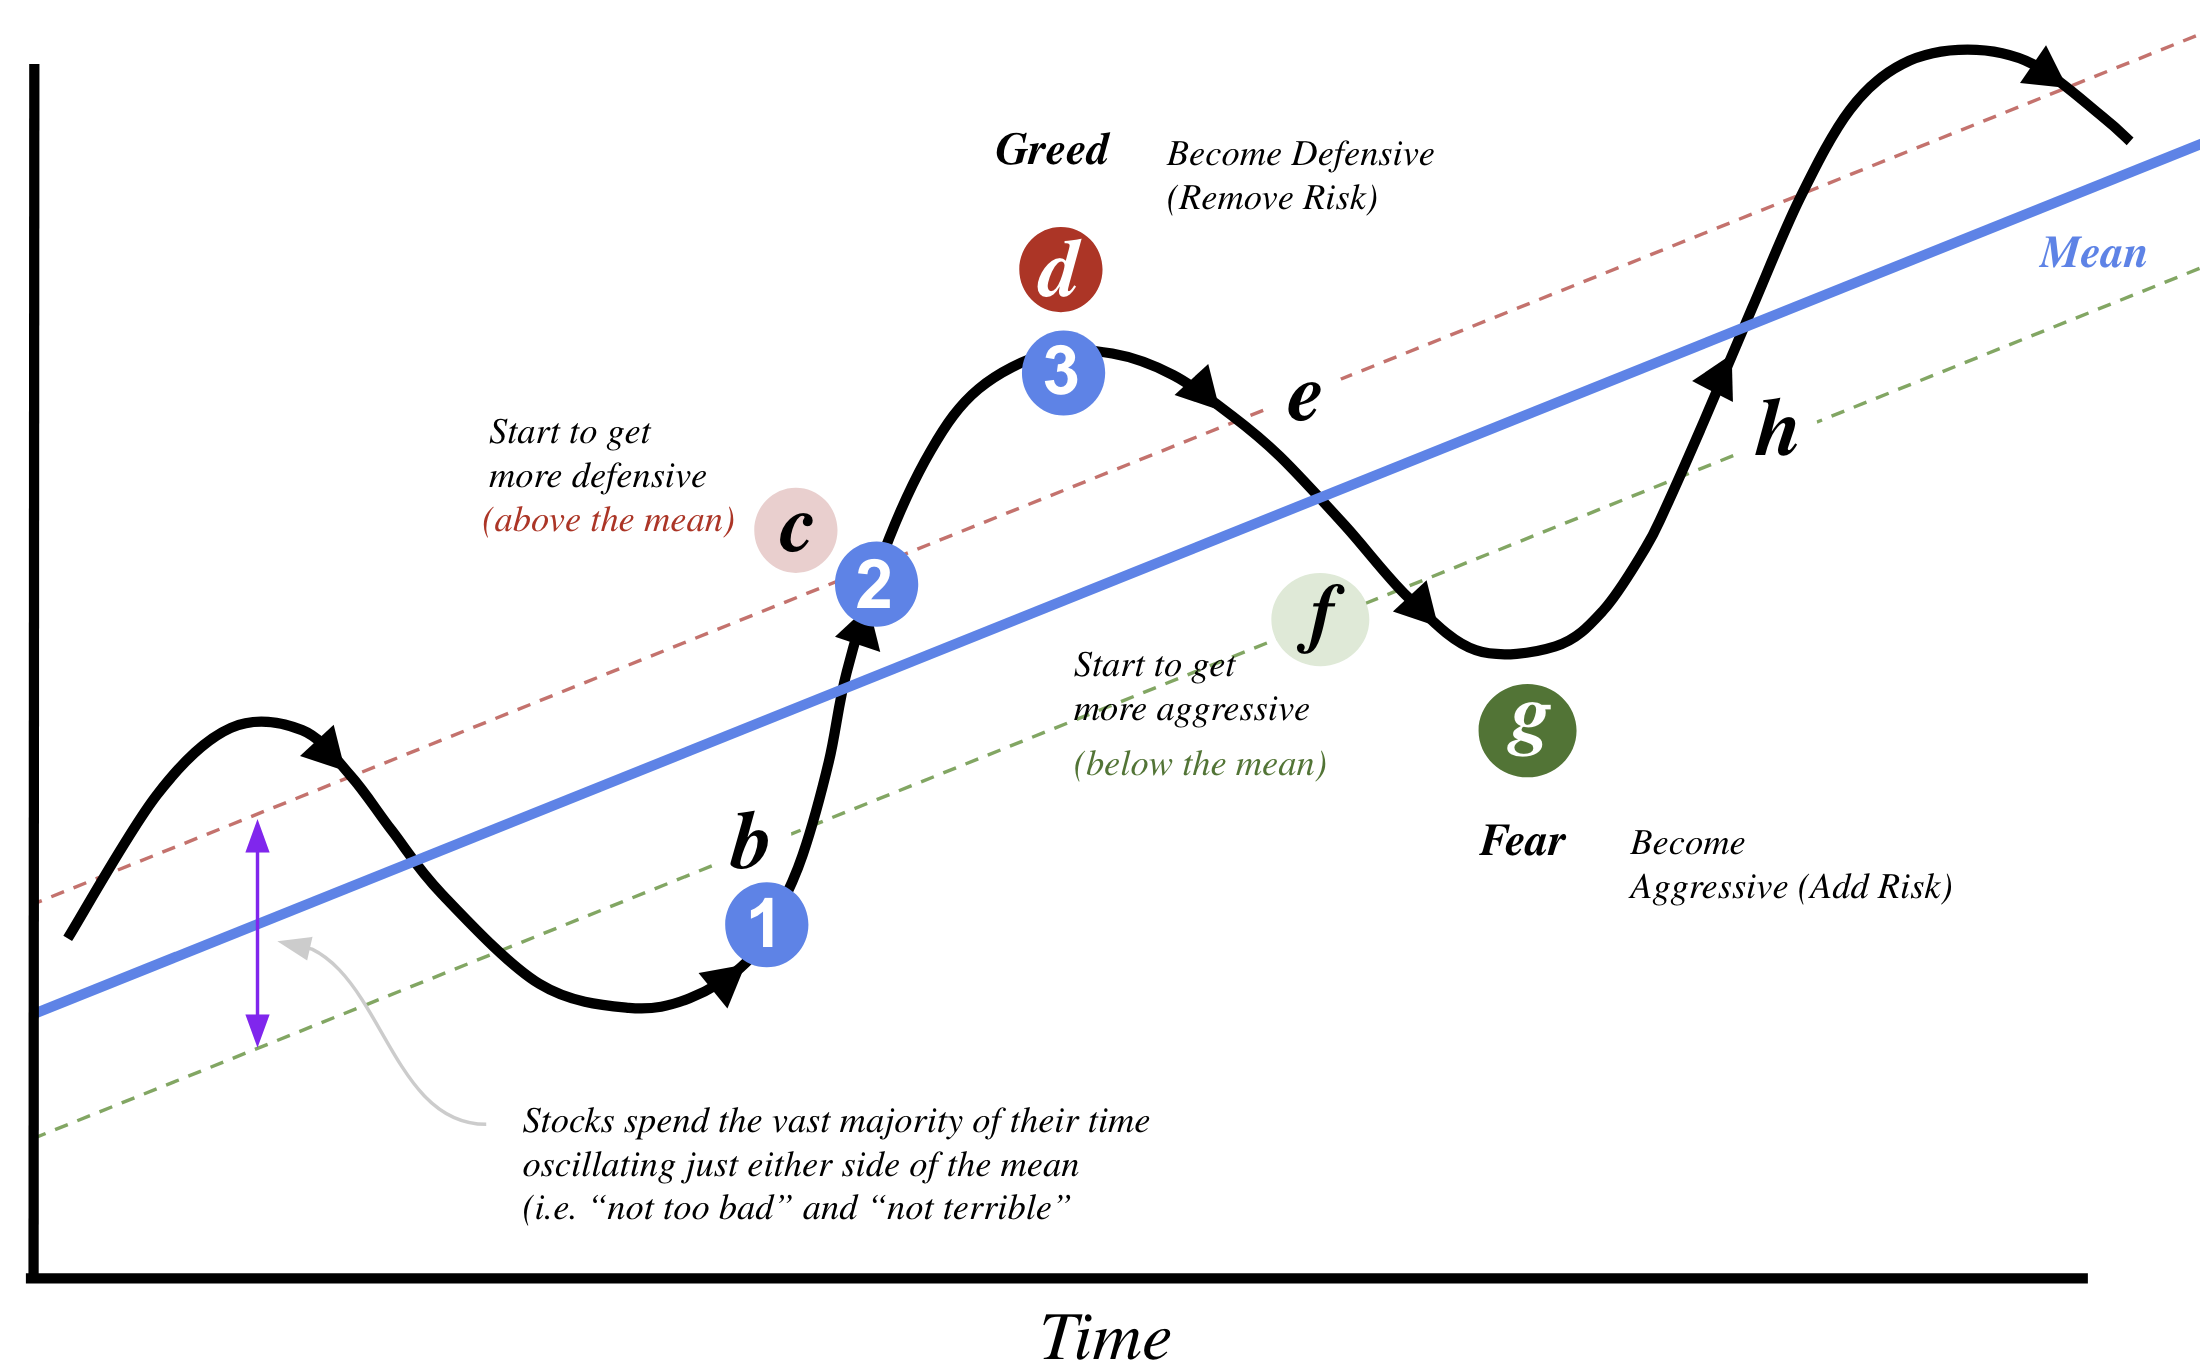
Here’s what these three bullish stages look like using Marks’ diagram I shared over the weekend:
The blue circles labelled 1, 2 and 3 show the stages.
Briefly summarizing the key points:
- Buying stocks at Stage 1 is the most advantageous – as prices start to make their way back to the longer-term mean (blue line)
- Adding exposure during Stage 2 is less advantageous but can be profitable. However, a more savvy investor will be starting getting more defensive.
- If increasing your risk during the final stage, this is fraught with risk. This is where investor optimism and greed has taken full flight. At this stage, the savvy investor is reducing risk or at least hedging positions.
And whilst it’s impossible to predict just how far optimism can go (“d”) – what is clear to the above-average investor – at some point prices mean revert.
If there is nothing else you take away from this diagram – investors should always respect the laws of mean reversion.
‘Magnificent 7’: 2 Down… 5 to Go
Two of the ‘Magnificent 7′ stocks received their own taste of mean reversion post Q2 earnings this week – Alphabet and Tesla.
I mentioned over the weekend I was very interested to see how the market reacts.
So far, it has not been great.
My concern was given the excessive run in prices (‘Stage 3’) – a lot of good (AI) news was baked in.
This makes the ‘growth bar’ that much harder to clear – regardless of whether they beat expectations.
As it turns out – Google beat – however Telsa missed.
In both cases, investors were quick to dump the stocks.
Let’s start with Alphabet (aka Google):
July 25 2024
Your content goes here. Edit or remove this text inline or in the module Content settings. You can also style every aspect of this content in the module Design settings and even apply custom CSS to this text in the module Advanced settings.
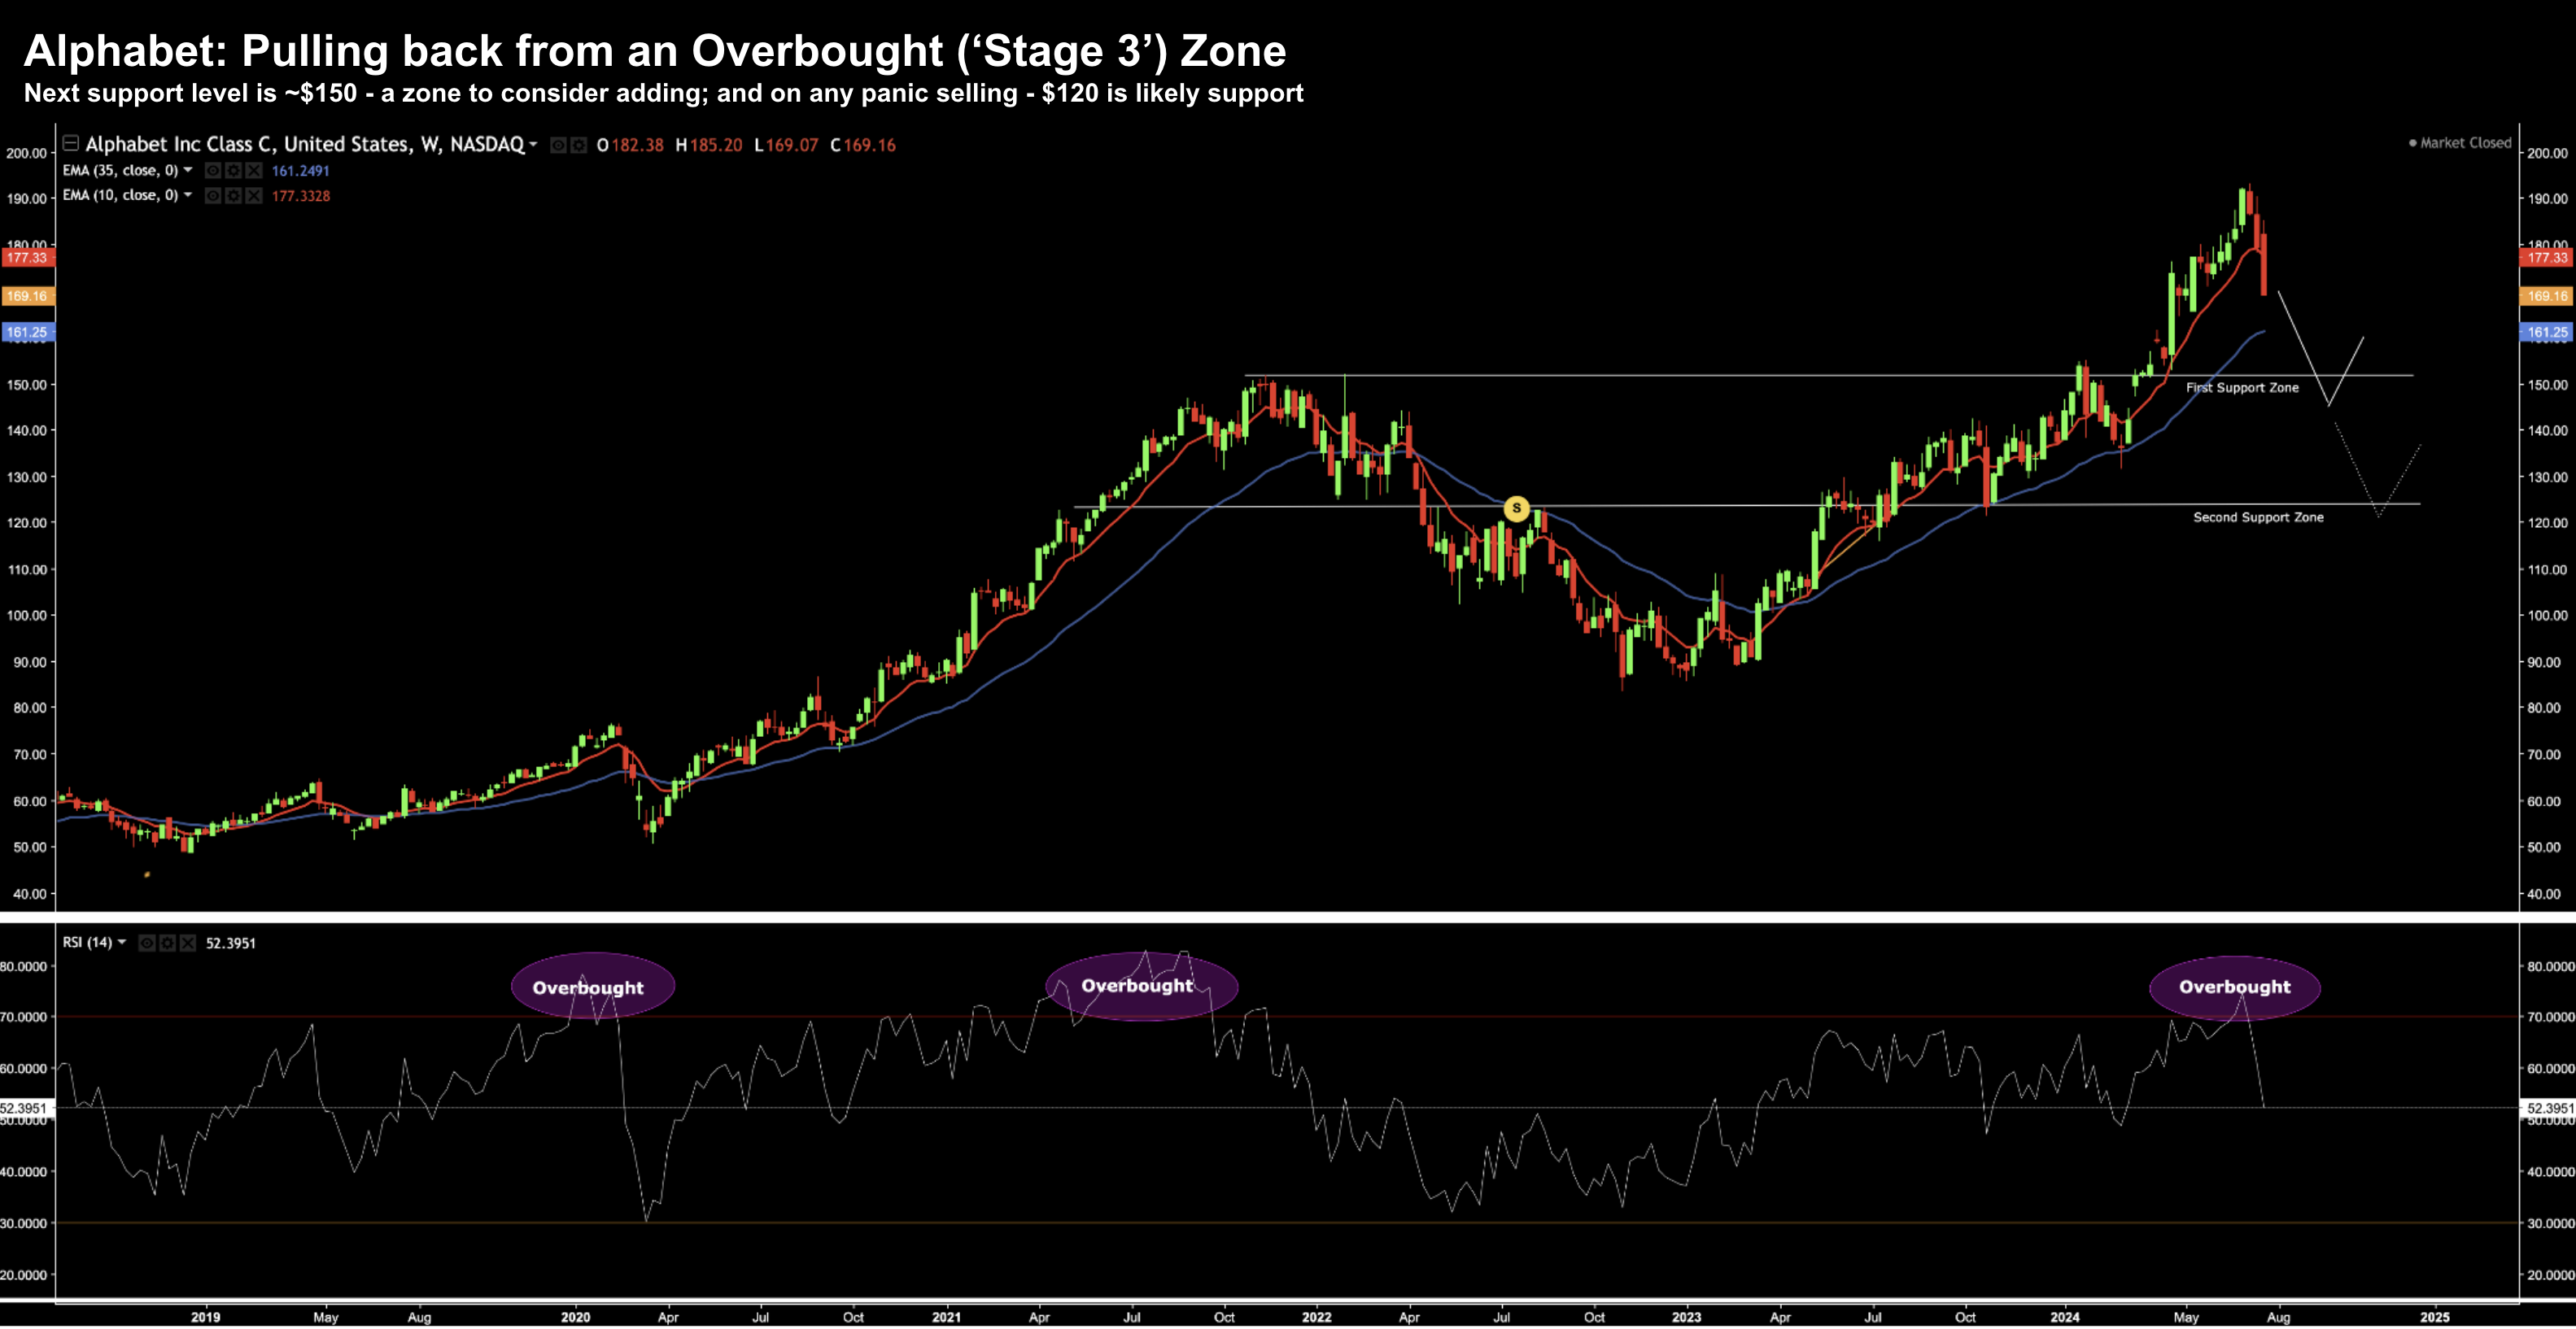
Here we see the previous two occasions (from 2019) when Google was technically overbought.
We see this using the weekly RSI (lower window) – where its value exceeds 70.
On both occasions – the stock pulled back sharply.
This week marks the third occasion.
Technically the stock looks set to retest the previous support zone of $150.
If you do not have exposure to Google – I think this area would be a good area to start adding.
But I would not make it a full position here…
Should any panic selling result (it would be foolish to rule it out) – then I would consider a full position around $120
From there, get settled and see how to stock performs over the next 3 years. It’s one of the most promising plays with respect to AI.
What’s more, Google enjoys no less than 9 different surfaces with more than 1 Billion users.
Put another way – that’s a lot of opportunity to explore the various use-cases (and monetization) with AI (which we still are yet to determine)
** Full disclosure – I work at Google on AI products.
Let’s now turn to Tesla…
July 25 2024
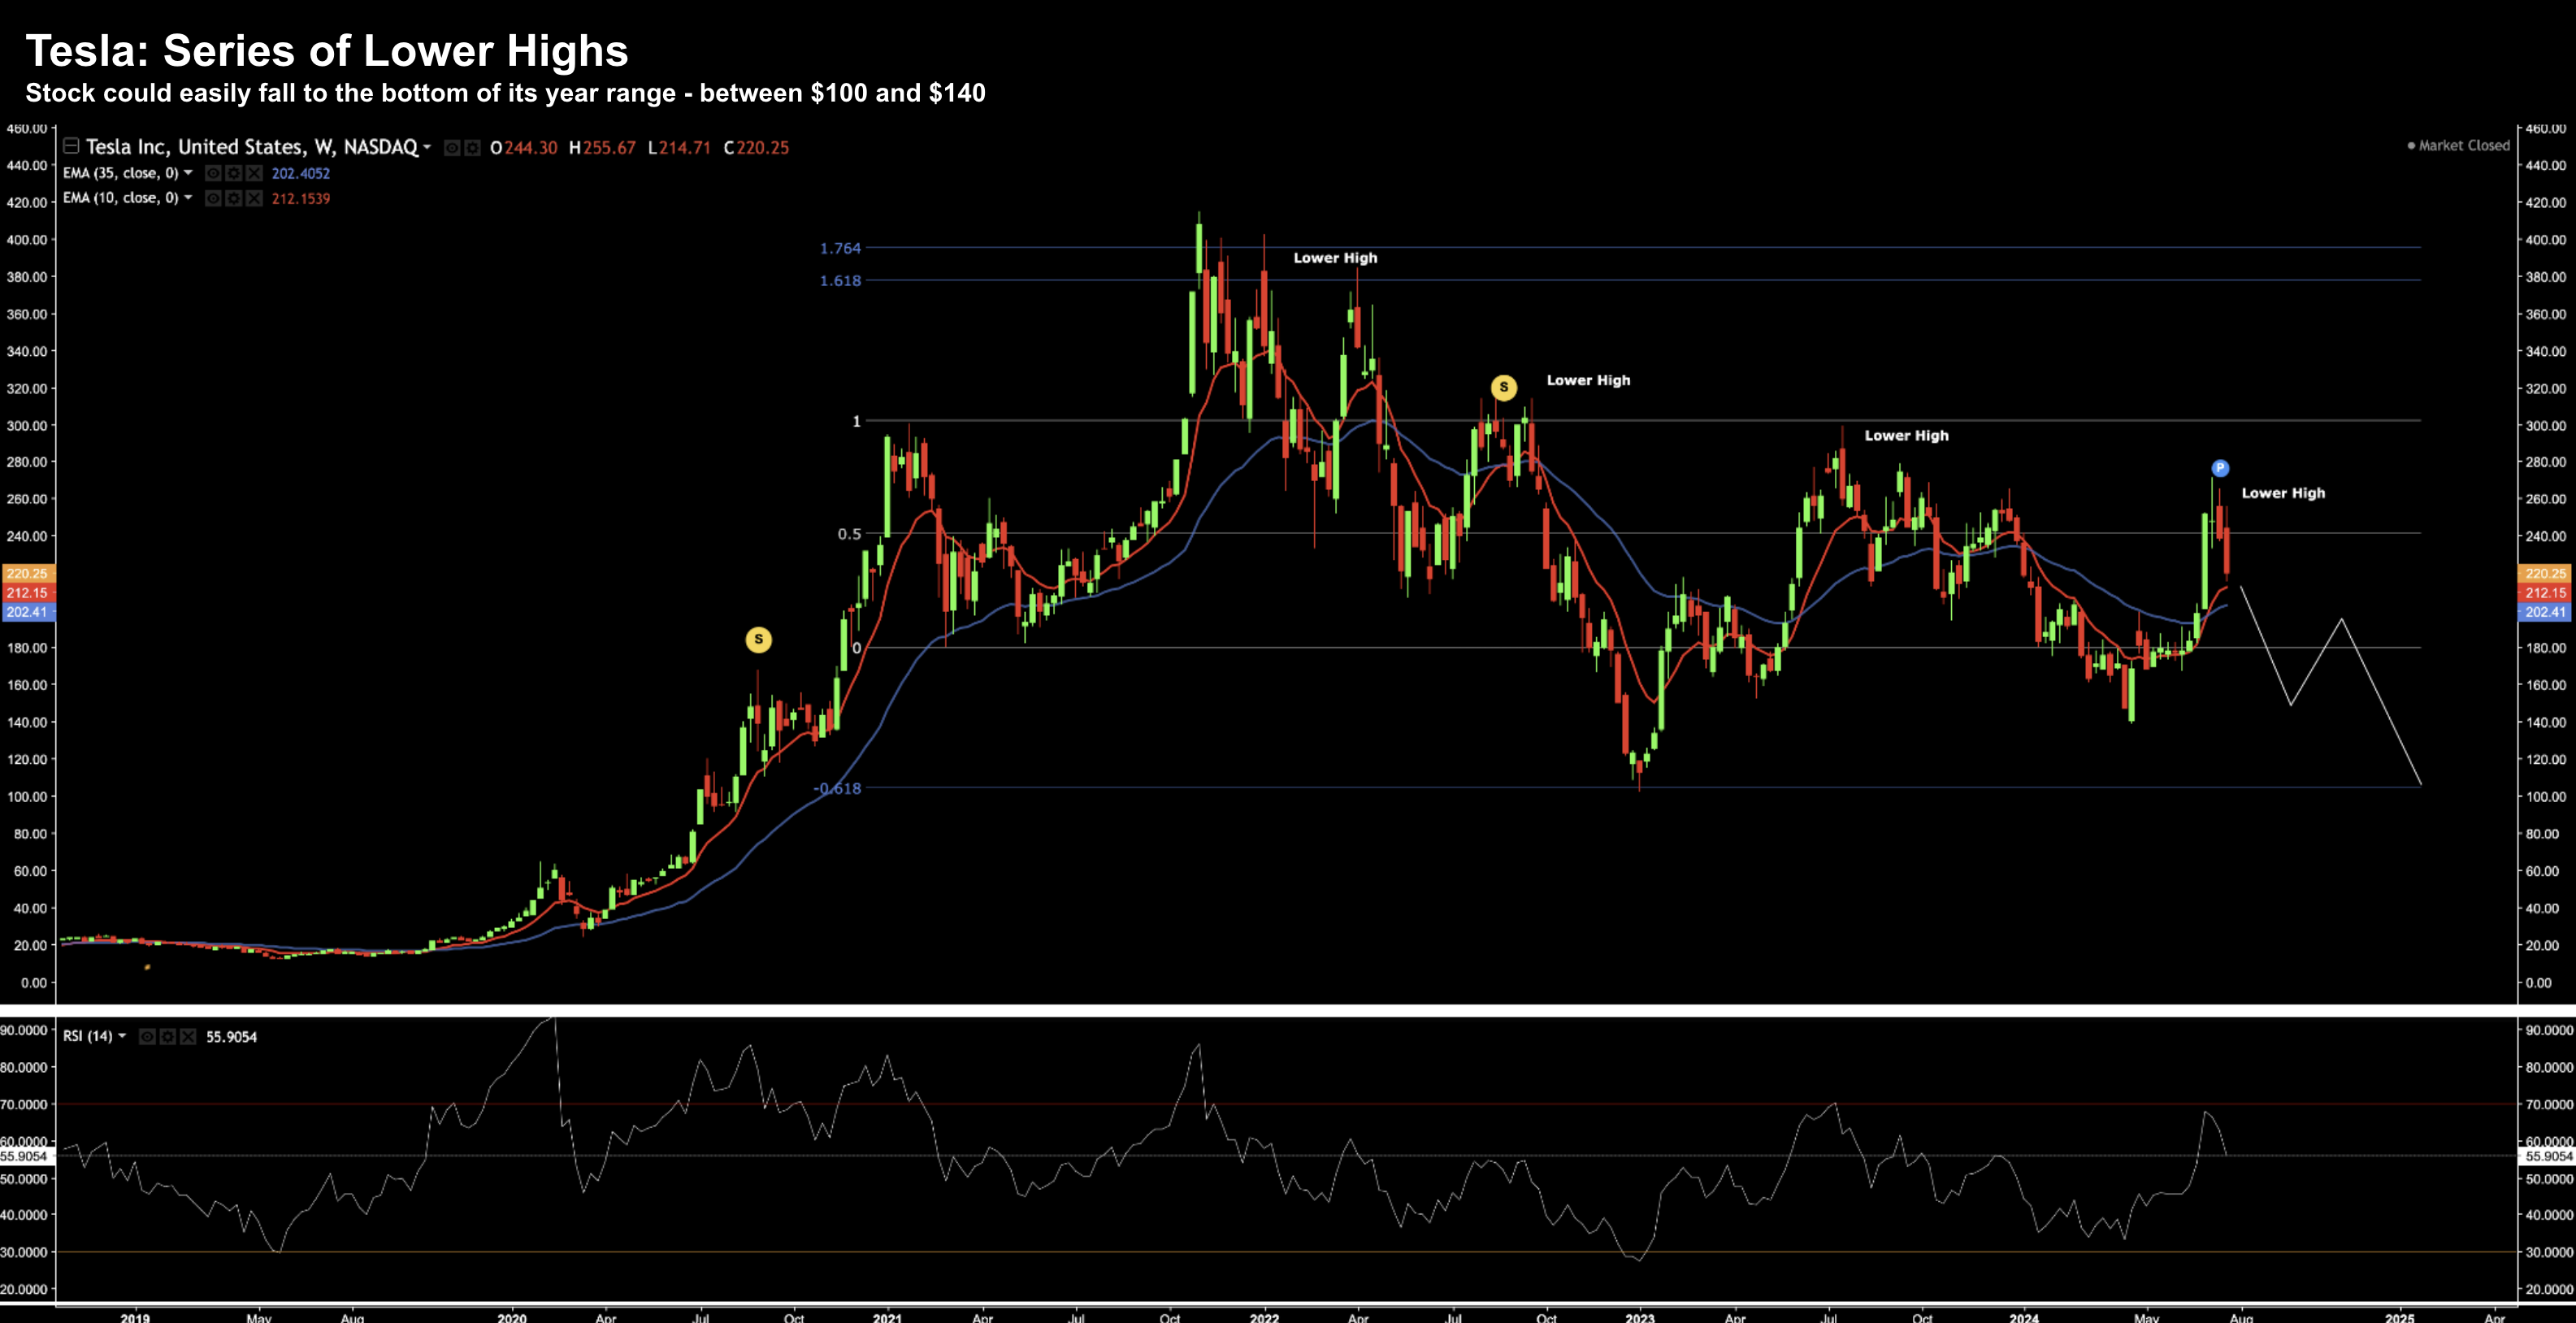
Whilst fundamentally I’m not a fan of the stock – recently commanding 96x forward earnings – the tape looks poor.
Tesla has formed a series of lower highs and looks set to trade lower.
With sales only growing 2% – operating margins plummeting due to increased competition (or Telsa attempting to buy market share) – investors should be cautious.
If I were to guess – I think we see the stock testing the lower end of its range – between $100 and $140.
Unfortunately I’m still not a buyer at these levels…
But the “believers” will probably bid up the stock around those prices on the promise of Robo Taxis.
I could write an entire post about why I think the case for Robo Taxis is not the much-hyped “trillion” dollar opportunity many analysts believe it is.
But maybe I will make that a subject for another day.
In short, whilst I readily agree Robo Taxis will be a thriving market within five to ten years (as a rough guess) – I don’t agree with their TAM (Total Addressable Market) assumptions.
For what it’s worth – I often take driverless Waymo vehicles around San Francisco (Google own Waymo).
It’s just like taking an Uber – only 10x better – as you have the car to yourself.
But Musk’s platform will not be unique…
Putting it All Together
I often like to say whilst we cannot predict the future – knowing approximately where we are allows us to plan.
It’s not unlike insurance…
It’s impossible to predict whether you will be a terrible accident or you lose something valuable.
But you can plan for the loss by taking insurance.
By understanding where we are in the cycle – this allows you to take steps to plan.
One more thing:
You don’t need to be a great stock-picker. You don’t need to understand fundamental analysis. And you certainly don’t need to try and forecast the future (who can?)
However, by doing a little work to understand where we are with the cycle, it gives you an edge the average investor doesn’t enjoy.

