Words: 1,408 Time: 6 Minutes
- Stocks end the week lower but still expensive
- Money supply indicates inflation likely to remain stable
- Long-term investors would be wise to remain patient
Are stocks starting to lose momentum?
This week saw the S&P 500 reverse course – its first losing week since early September.
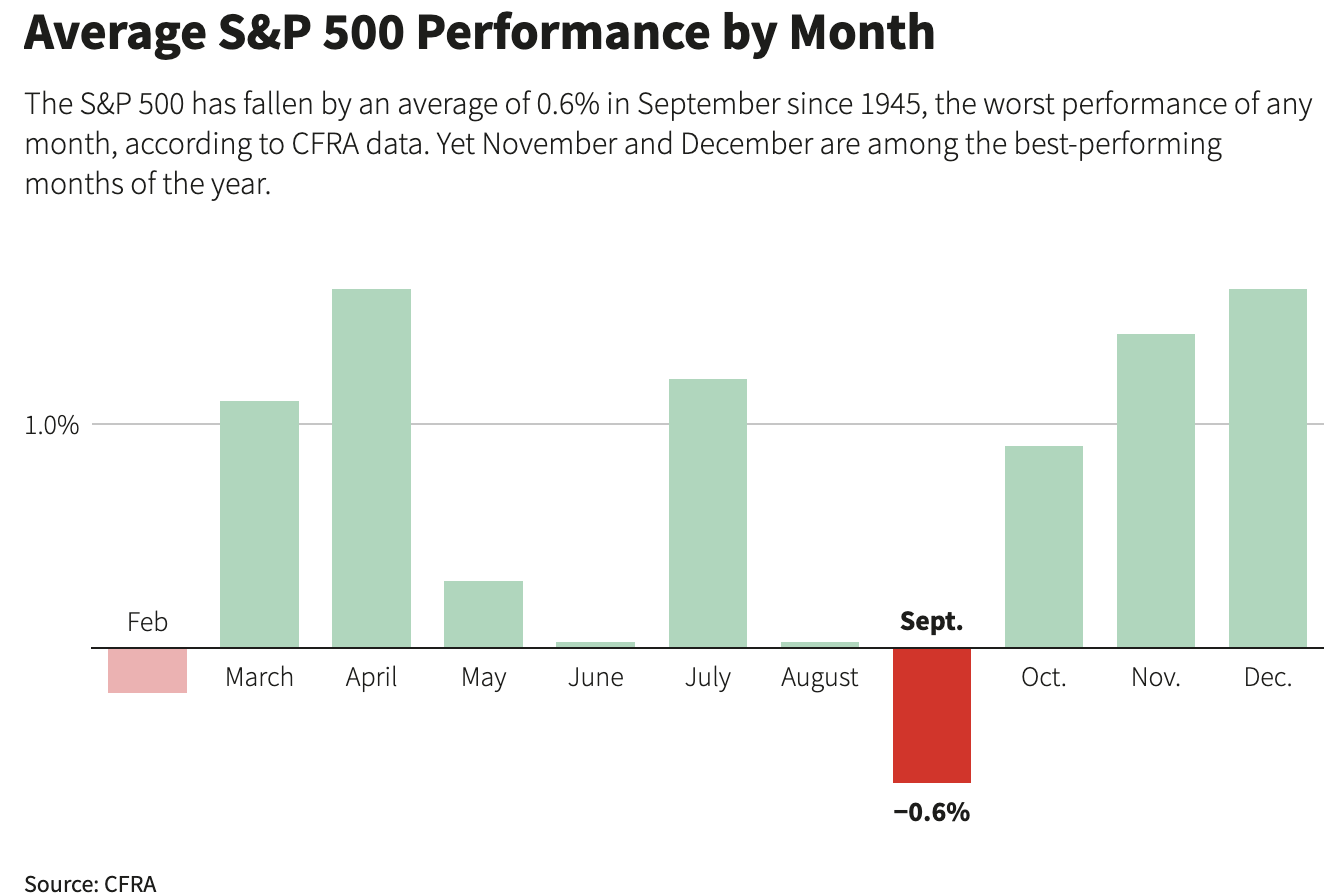
September – which boasts the worst monthly record for the Index – defied the odds rallying 2.0% this year.
I will take a look at the weekly chart for the S&P 500 towards the end of the post…
However, first I want to share some thoughts on money supply and inflation.
The trend in money supply growth is important for two reasons:
- Its impact on inflation (price stability); and
- Its relationship with stocks.
Let’s take a look…
🏦 How Money Supply Drove Inflation
The sharp growth of the M2 money supply (cash, checking and savings deposits, and other liquid assets) has been the primary driver of (unwanted) inflation the past few years.
For example, following the government’s distribution of ~$6 trillion in stimulus during the COVID-19 pandemic – the prices of goods soared.
In response to government mandated economic shutdowns – government-issued checks boosted the money supply in record time.
The injection of cash was reminiscent of what you would see during a war.
Initially, the public saved much of this money given they were limited to how they could spend it (e.g., most services were not possible)
This resulted in a temporary increase in money demand that offset the supply surge.
And with the velocity of money slowing to a ‘crawl’ – inflation remained low.
However, as COVID restrictions eased in early 2021, people began spending, causing an excess in money supply over demand and driving prices higher.
As we know inflationary effects have gradually lessened over the past two years, as both money supply and demand normalized.
Current inflation levels, excluding some housing costs, have stayed around 2% over the past 12 months.
Prices are still rising… but at more normal levels.
However, they are not going back to where they were pre the injection of ~$6 Trillion into the economy.
The balance between money supply and demand suggests that inflation will likely stay controlled in the near future, barring any major changes (which are possible pending fiscal policy over the coming 12 months)
But let me share what’s happening with M2 money supply (and its relationship with inflation) using four key charts.
I encourage readers to revisit these four charts every quarter when making longer-term investment decisions.
🧮 Federal Deficit and M2 Growth
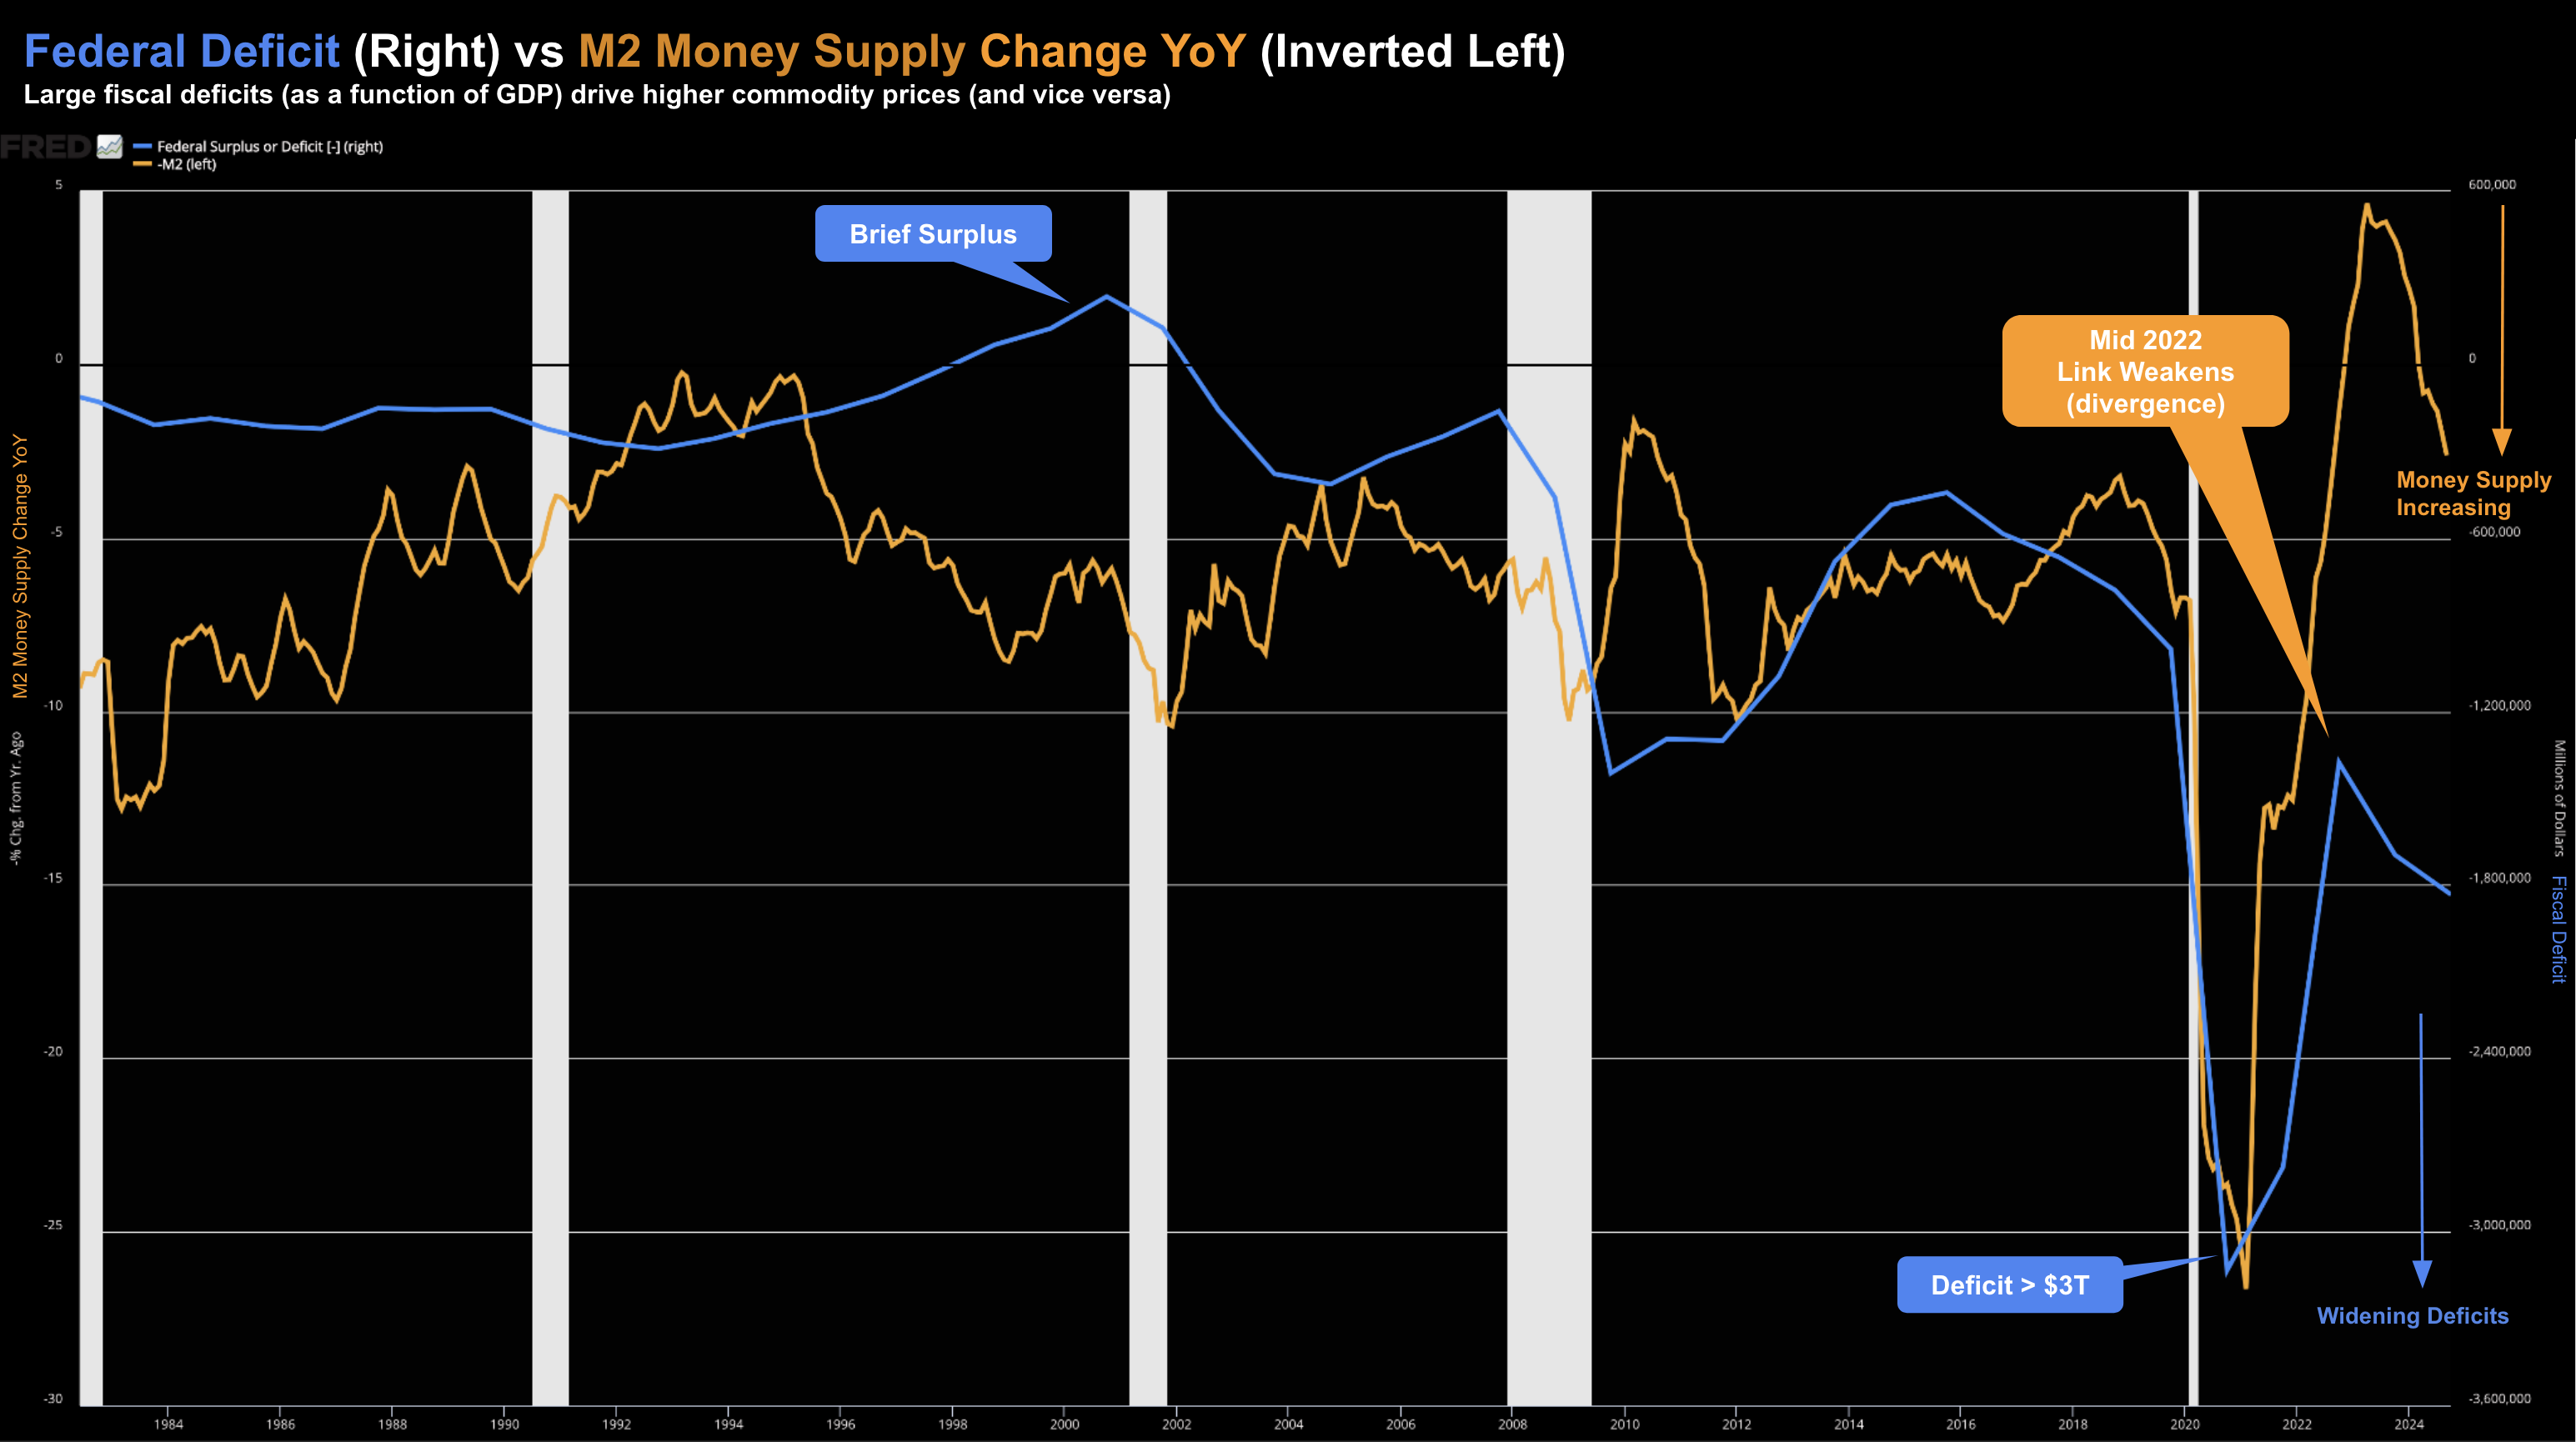
This first chart highlights how federal deficit spending initially increased M2 growth.
However, from mid 2022 we saw divergence.
The link between deficit spending and M2 growth weakened in the latter half of 2022 – as large deficits continued (blue line) but were no longer monetized in the same way.
October 26 2024
Since mid 2022 – M2 money supply has started to increase (inverted scale on the left-hand side).
And from mine, this also helps explain the rise in stock prices (I’ll offer a chart demonstrating this relationship shortly).
💰 M2 Money Supply Growth
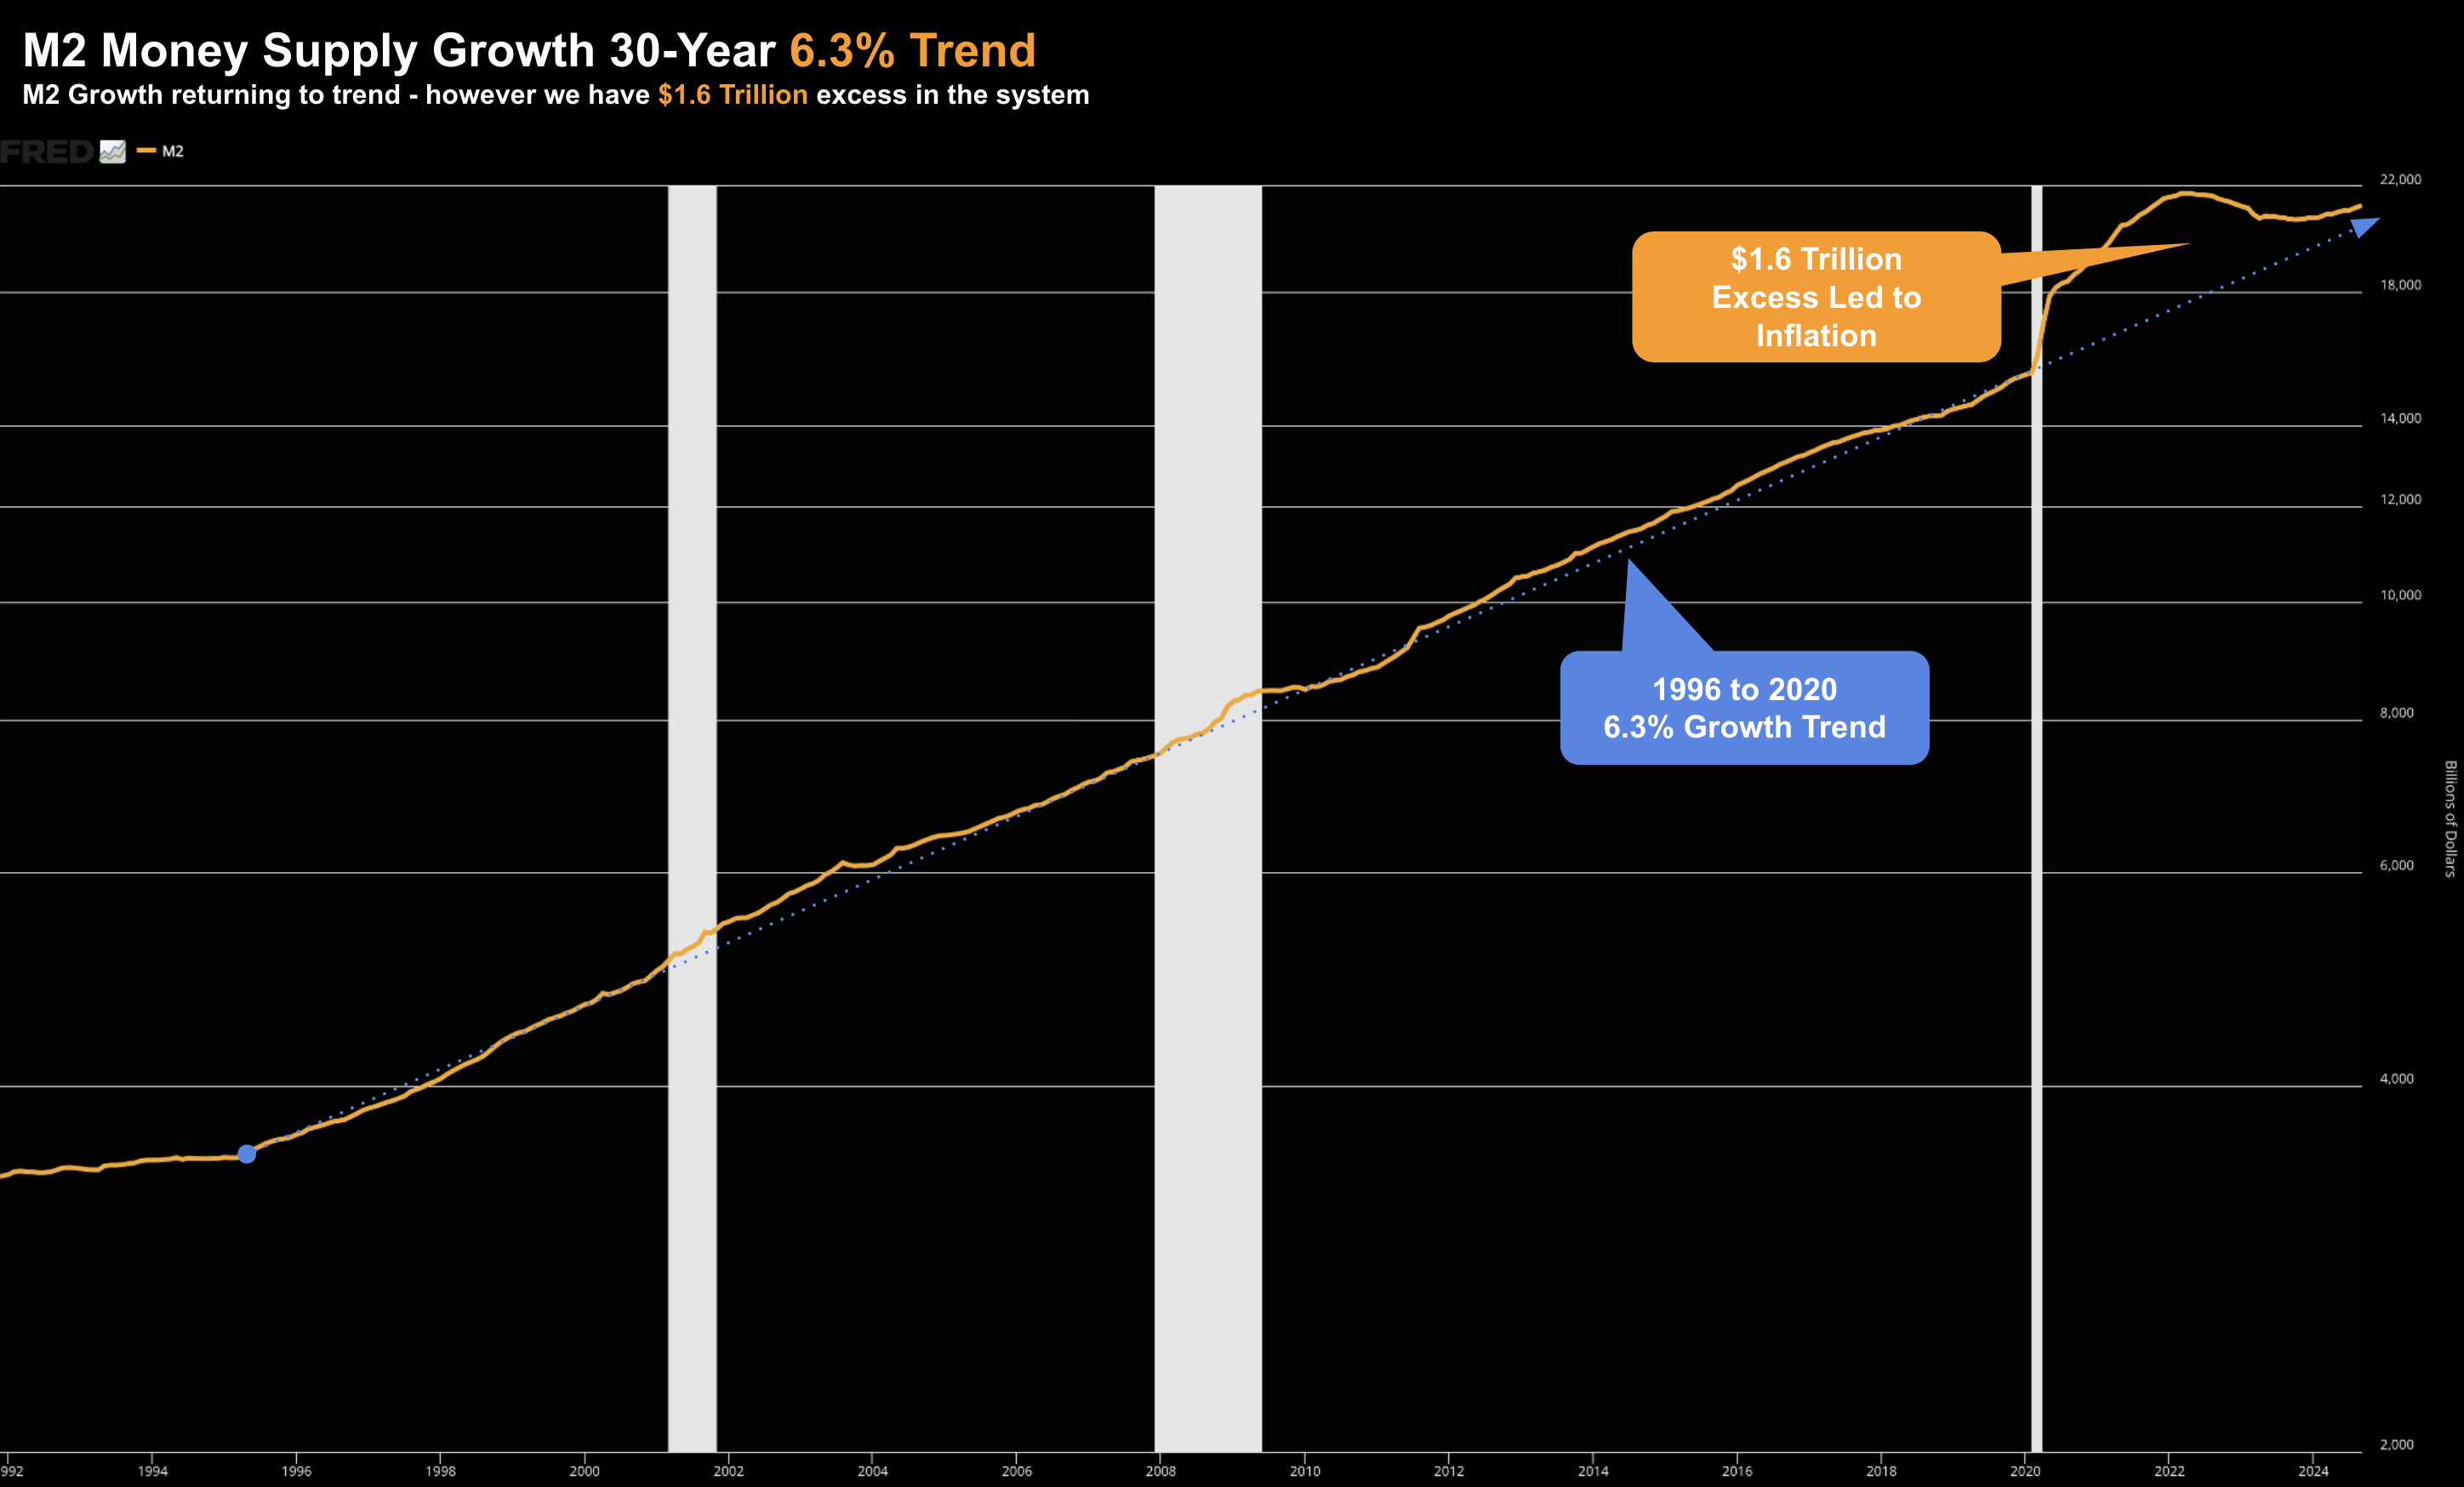
From 1996 to early 2020 – M2 grew at a consistent ~6.3% annually
October 26 2024
This modest rate of M2 growth coincided with stable, low inflation.
However, M2 spiked immediately after the COVID outbreak in April 2020 – peaking in early 2022.
Currently, M2 is about $1.6 trillion above its 30-year long-term trend.
However, it’s now beginning to return to a modest growth rate.
Assuming M2 continues at its former (pre-2020) growth rate of around 6% year over year – it’s unlikely to reignite inflationary pressure.
💸 Money Demand Suggests Expansion
Economist Milton Friedman once described inflation as when money supply exceeds demand.
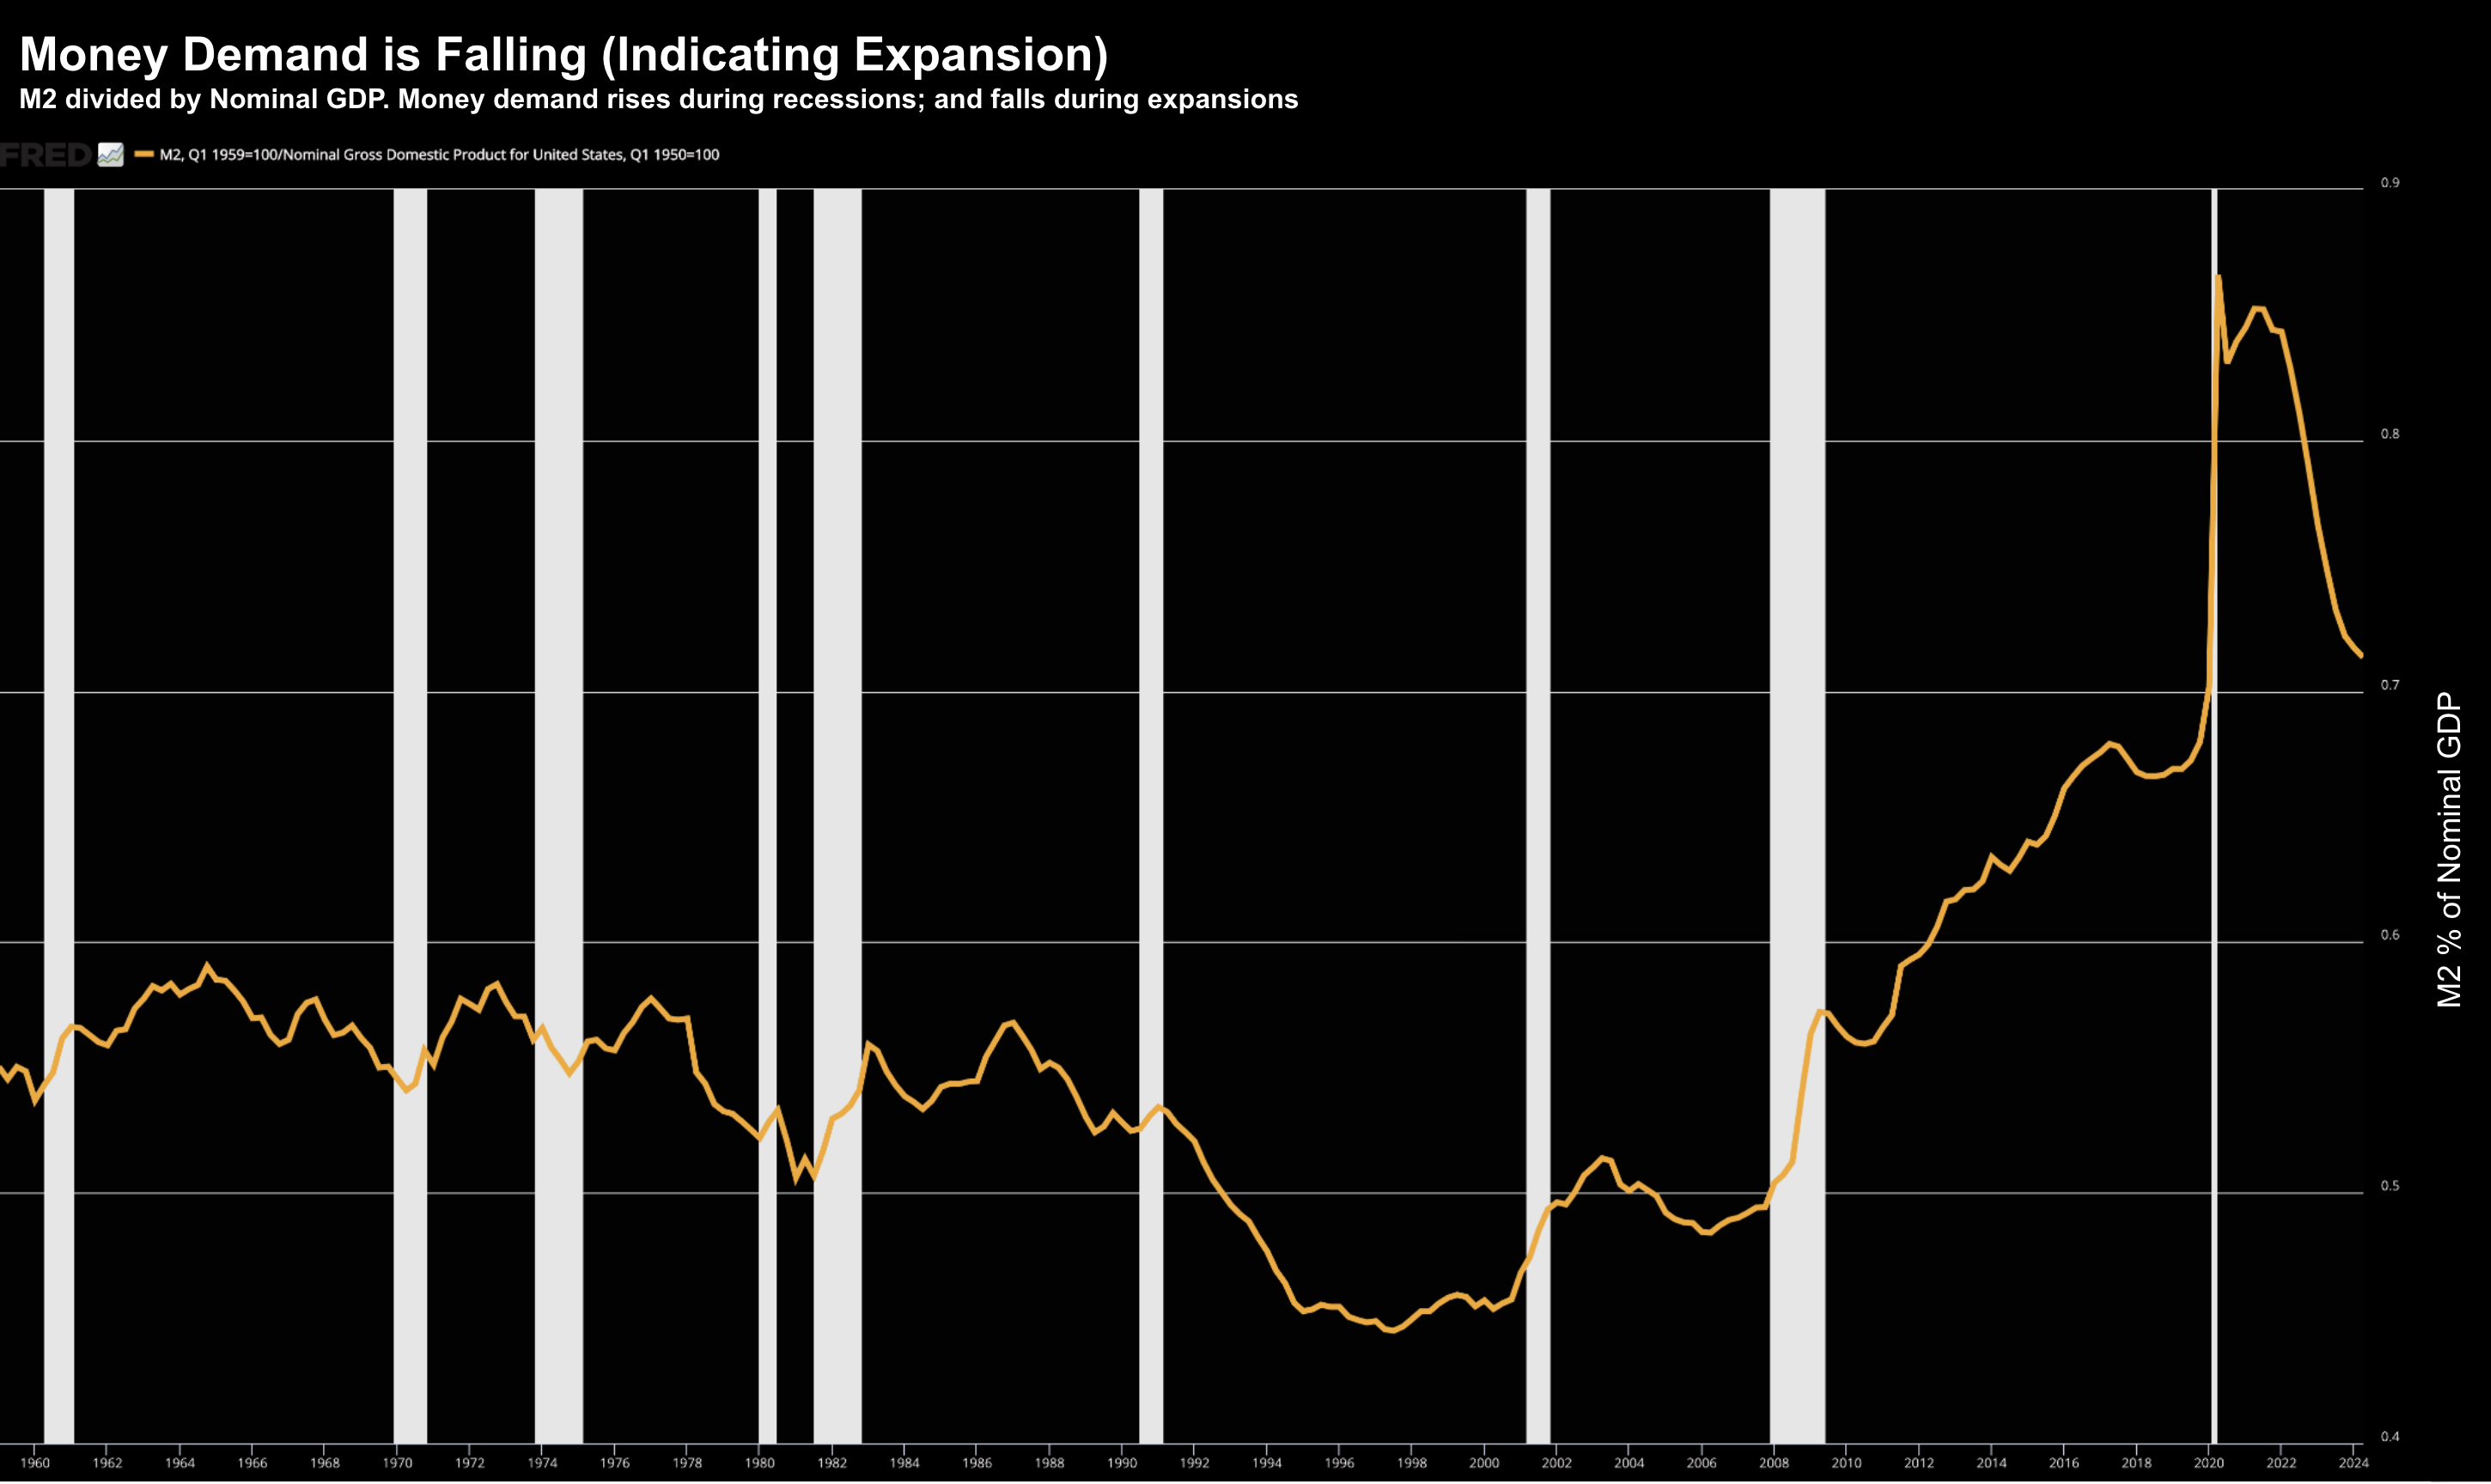
To measure money demand, we divide M2 by nominal GDP (vs real), indicating the public’s preferred cash holdings relative to income.
October 26 2024
As the chart shows – money demand rises during recessions (as people hold onto cash and equivalents)
However, when the demand for money falls (as is the case today) – we generally see economic expansion.
In other words, people have more confidence to invest and spend (vs save).
For example, the demand for money spiked after the COVID-19 shutdowns given the uncertainty for income.
However, it began to normalize as the economy recovered.
Today, money demand is slightly higher than before COVID, implying that the balance between supply and demand has been restored.
This supports low and stable inflation levels.
🤹🏽 M2 Growth and CPI Correlation
The fourth and final chart is a chart regular readers will be familiar with.
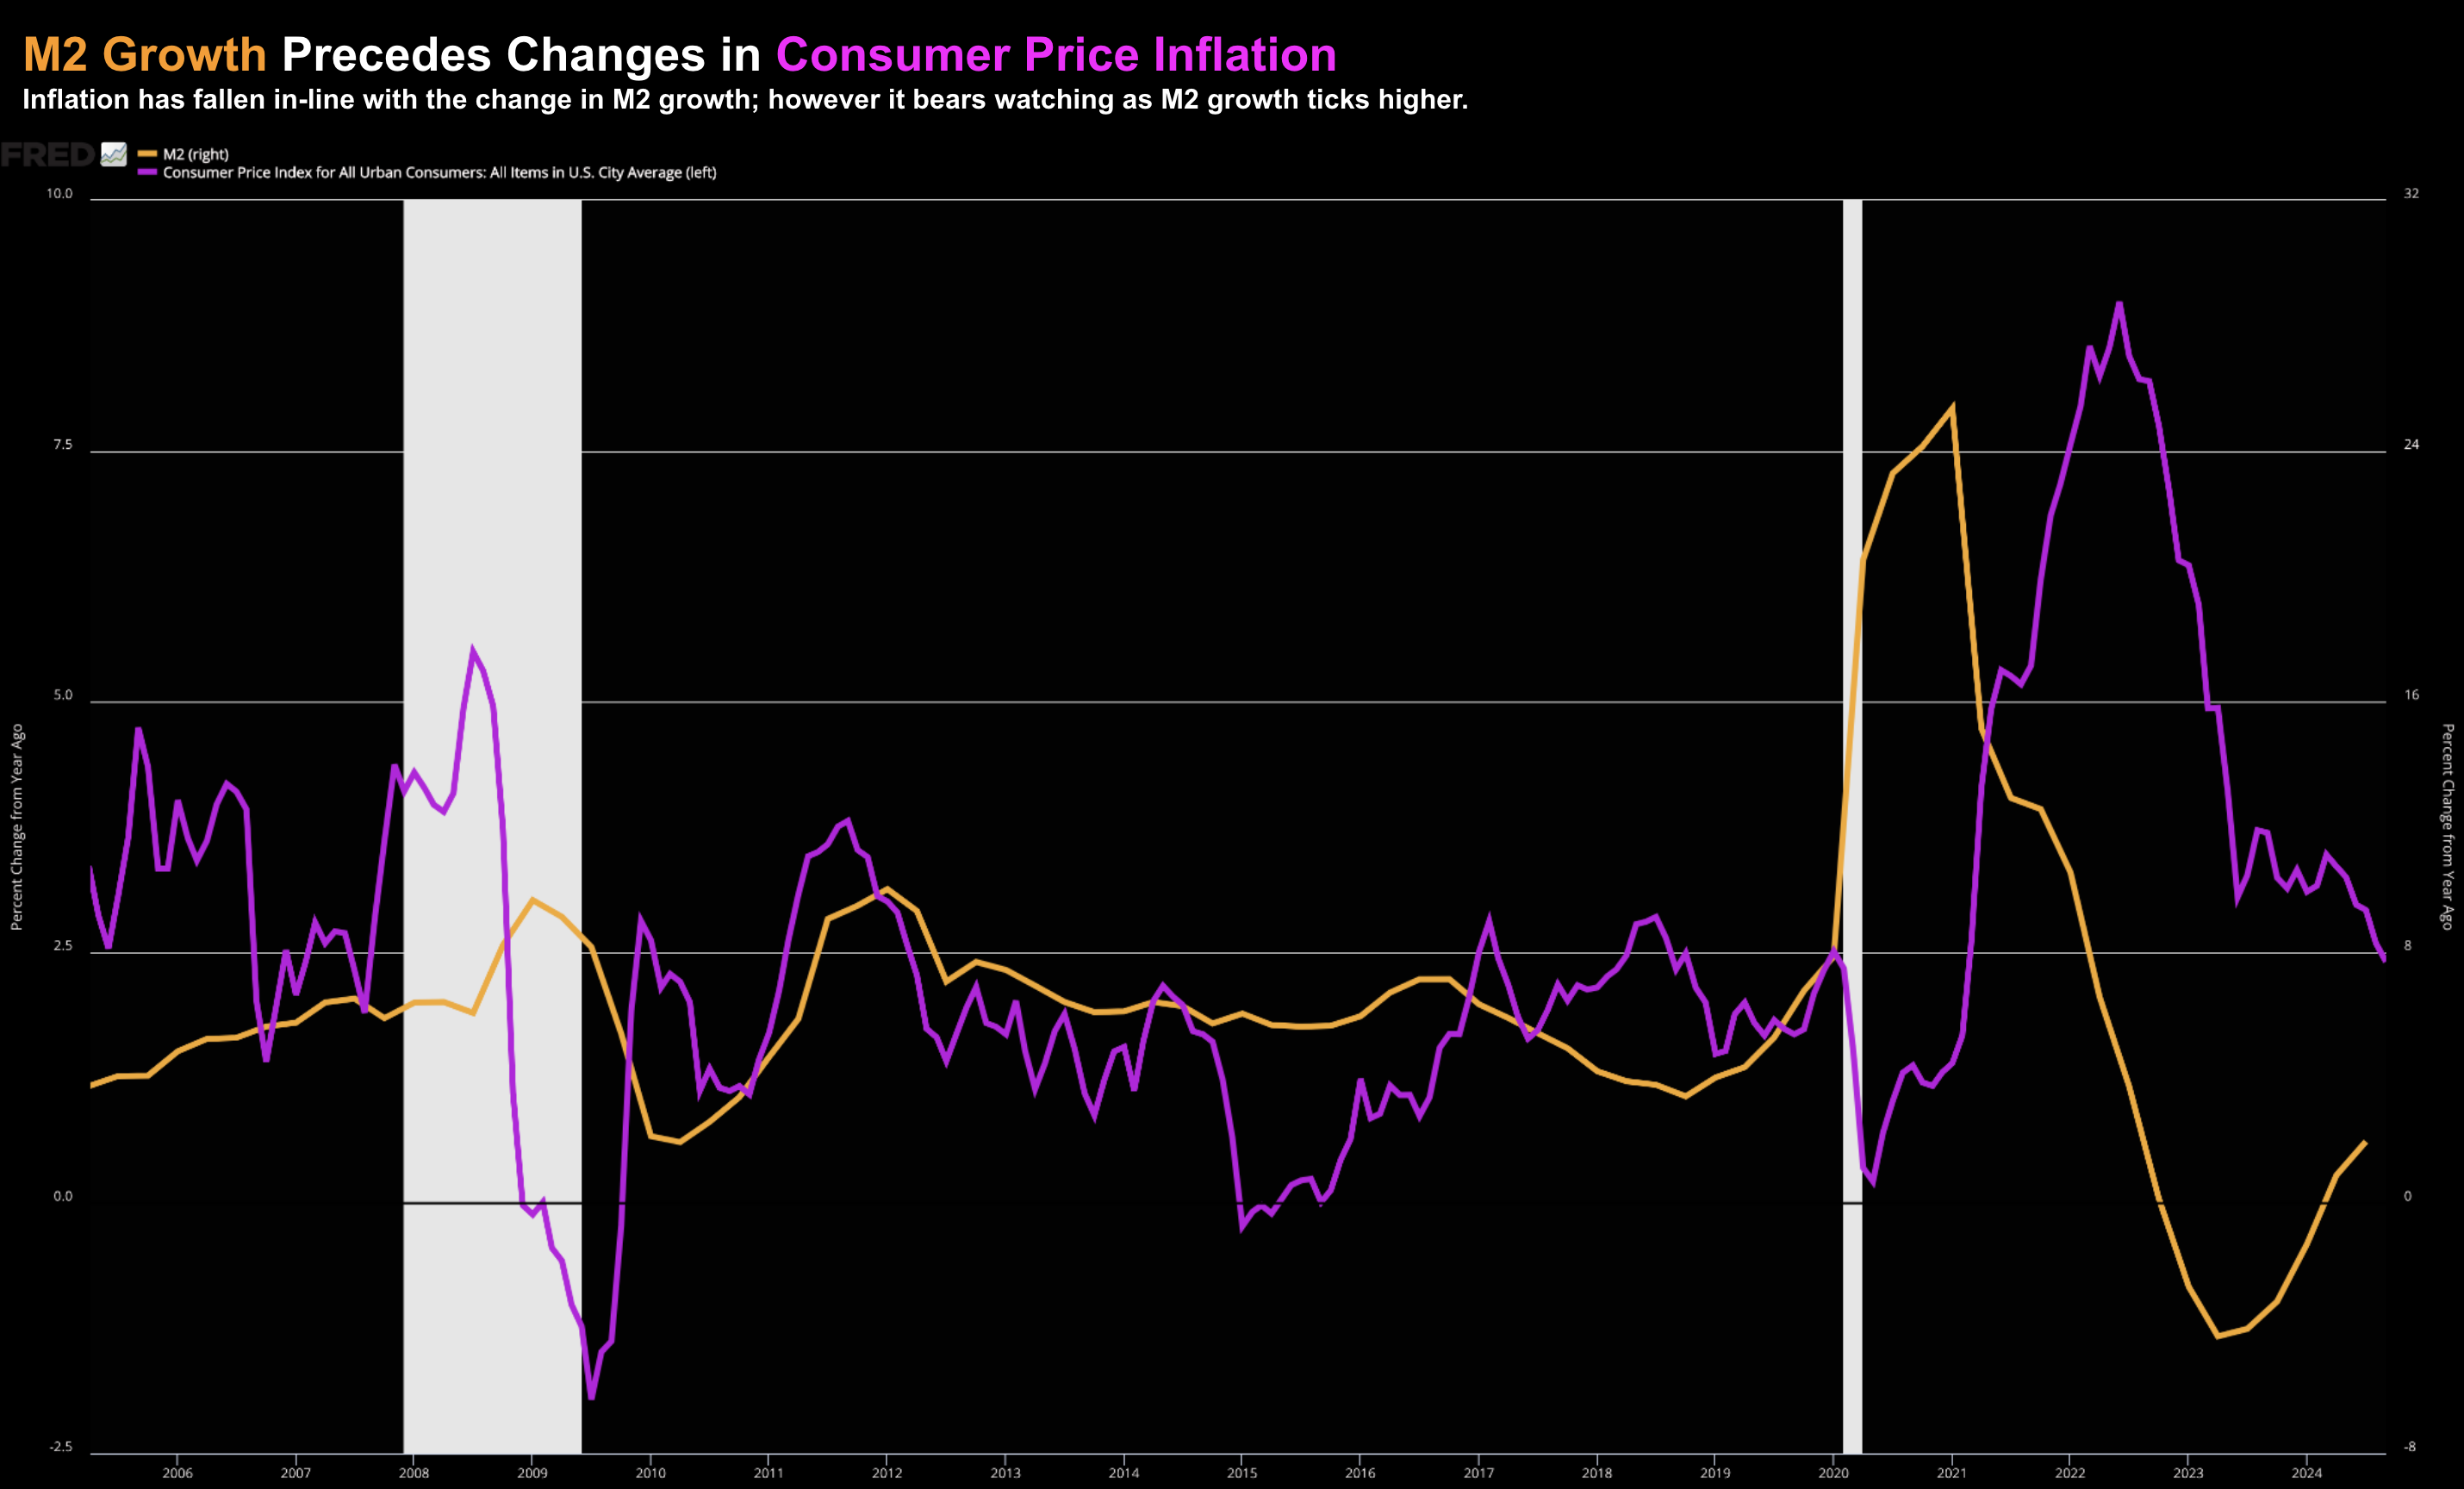
It illustrates how changes in M2 growth precede shifts in inflation (by ~12 months) — represented by the Consumer Price Index (CPI) one year later.
October 26 2024
Inflation rose approximately one year after the M2 surge and began to decrease after M2 growth peaked.
The CPI measure (which excludes housing) shows that inflation has fallen mostly in-line with the declining M2 (with a lag).
However, given the recent uptick in M2 growth, the correlation bears close attention.
In summary, each of these charts suggests a stable inflation outlook as the balance of money supply normalizes.
📉 S&P 500 Losing Momentum
These four money supply charts are important not only for inflation – but also for risk assets.
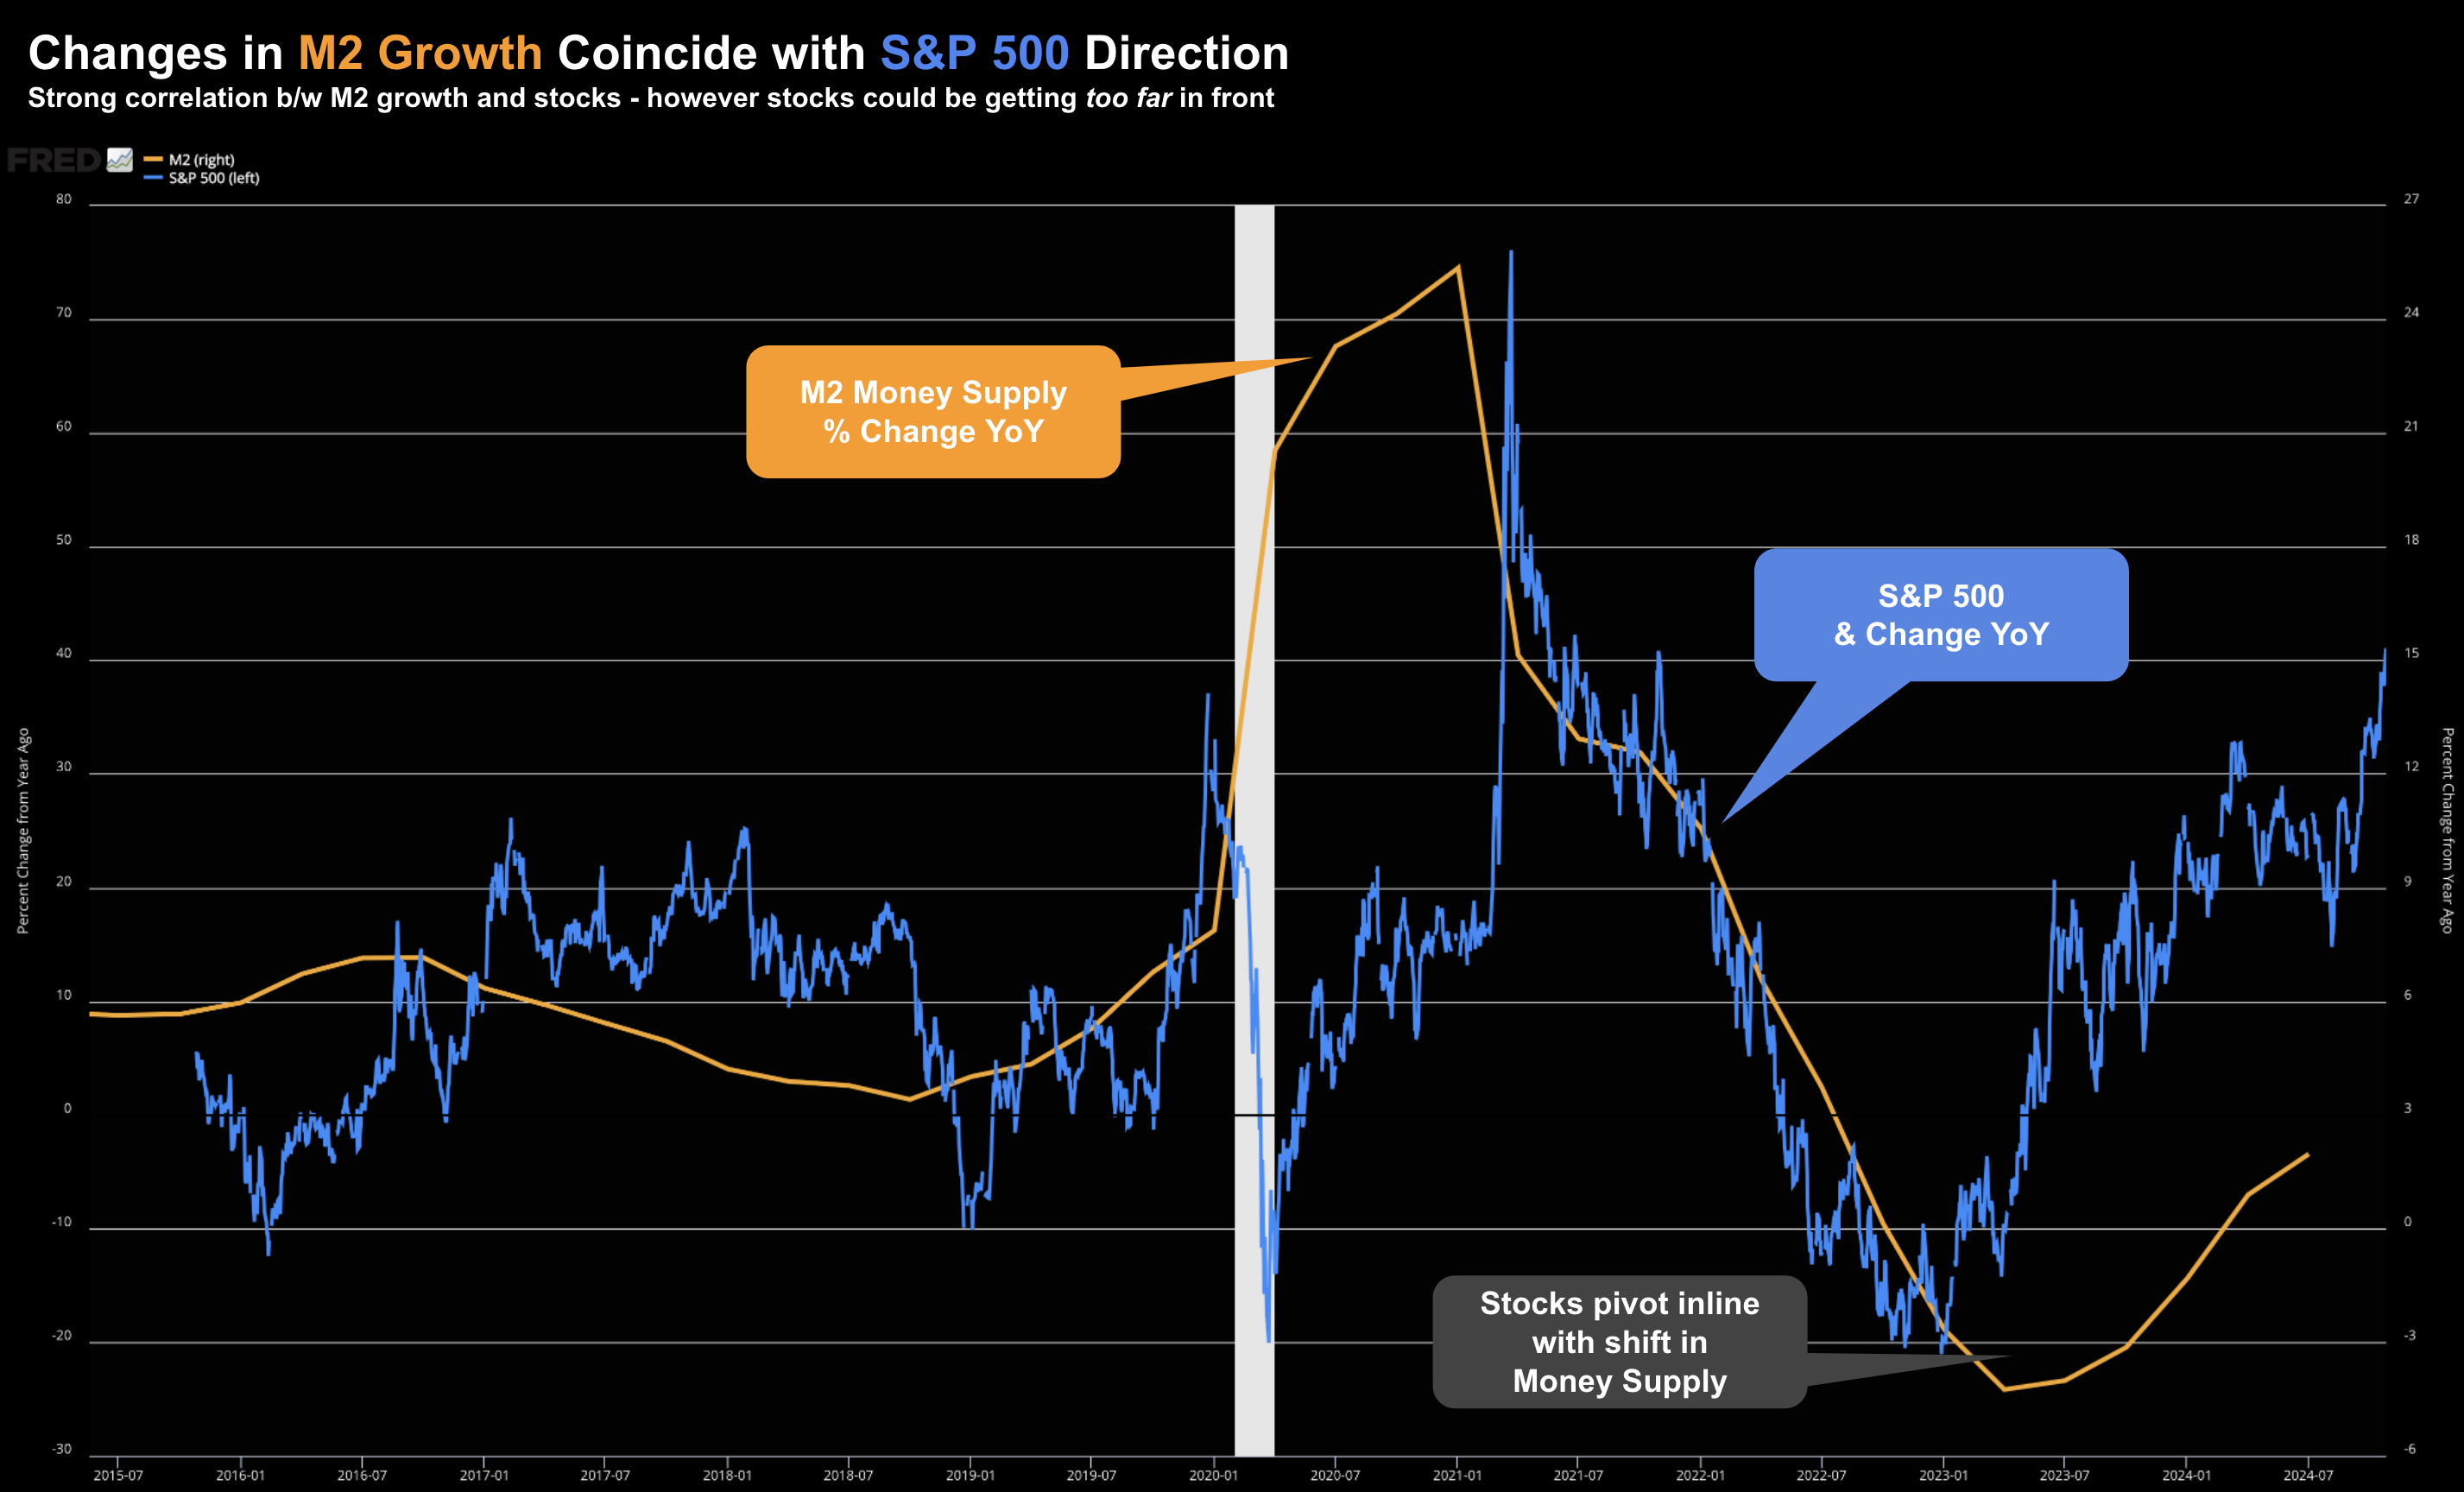
For example, below is the year-over-year % change in M2 money supply growth vs the S&P 500 (blue)
October 26 2024
Here we can see the pivot points in both 2020 and more recently very early 2023.
However, I question how far stocks have run ahead of money supply growth.
Put another way, it would not be unreasonable to expect stocks to normalize.
And this might be happening…
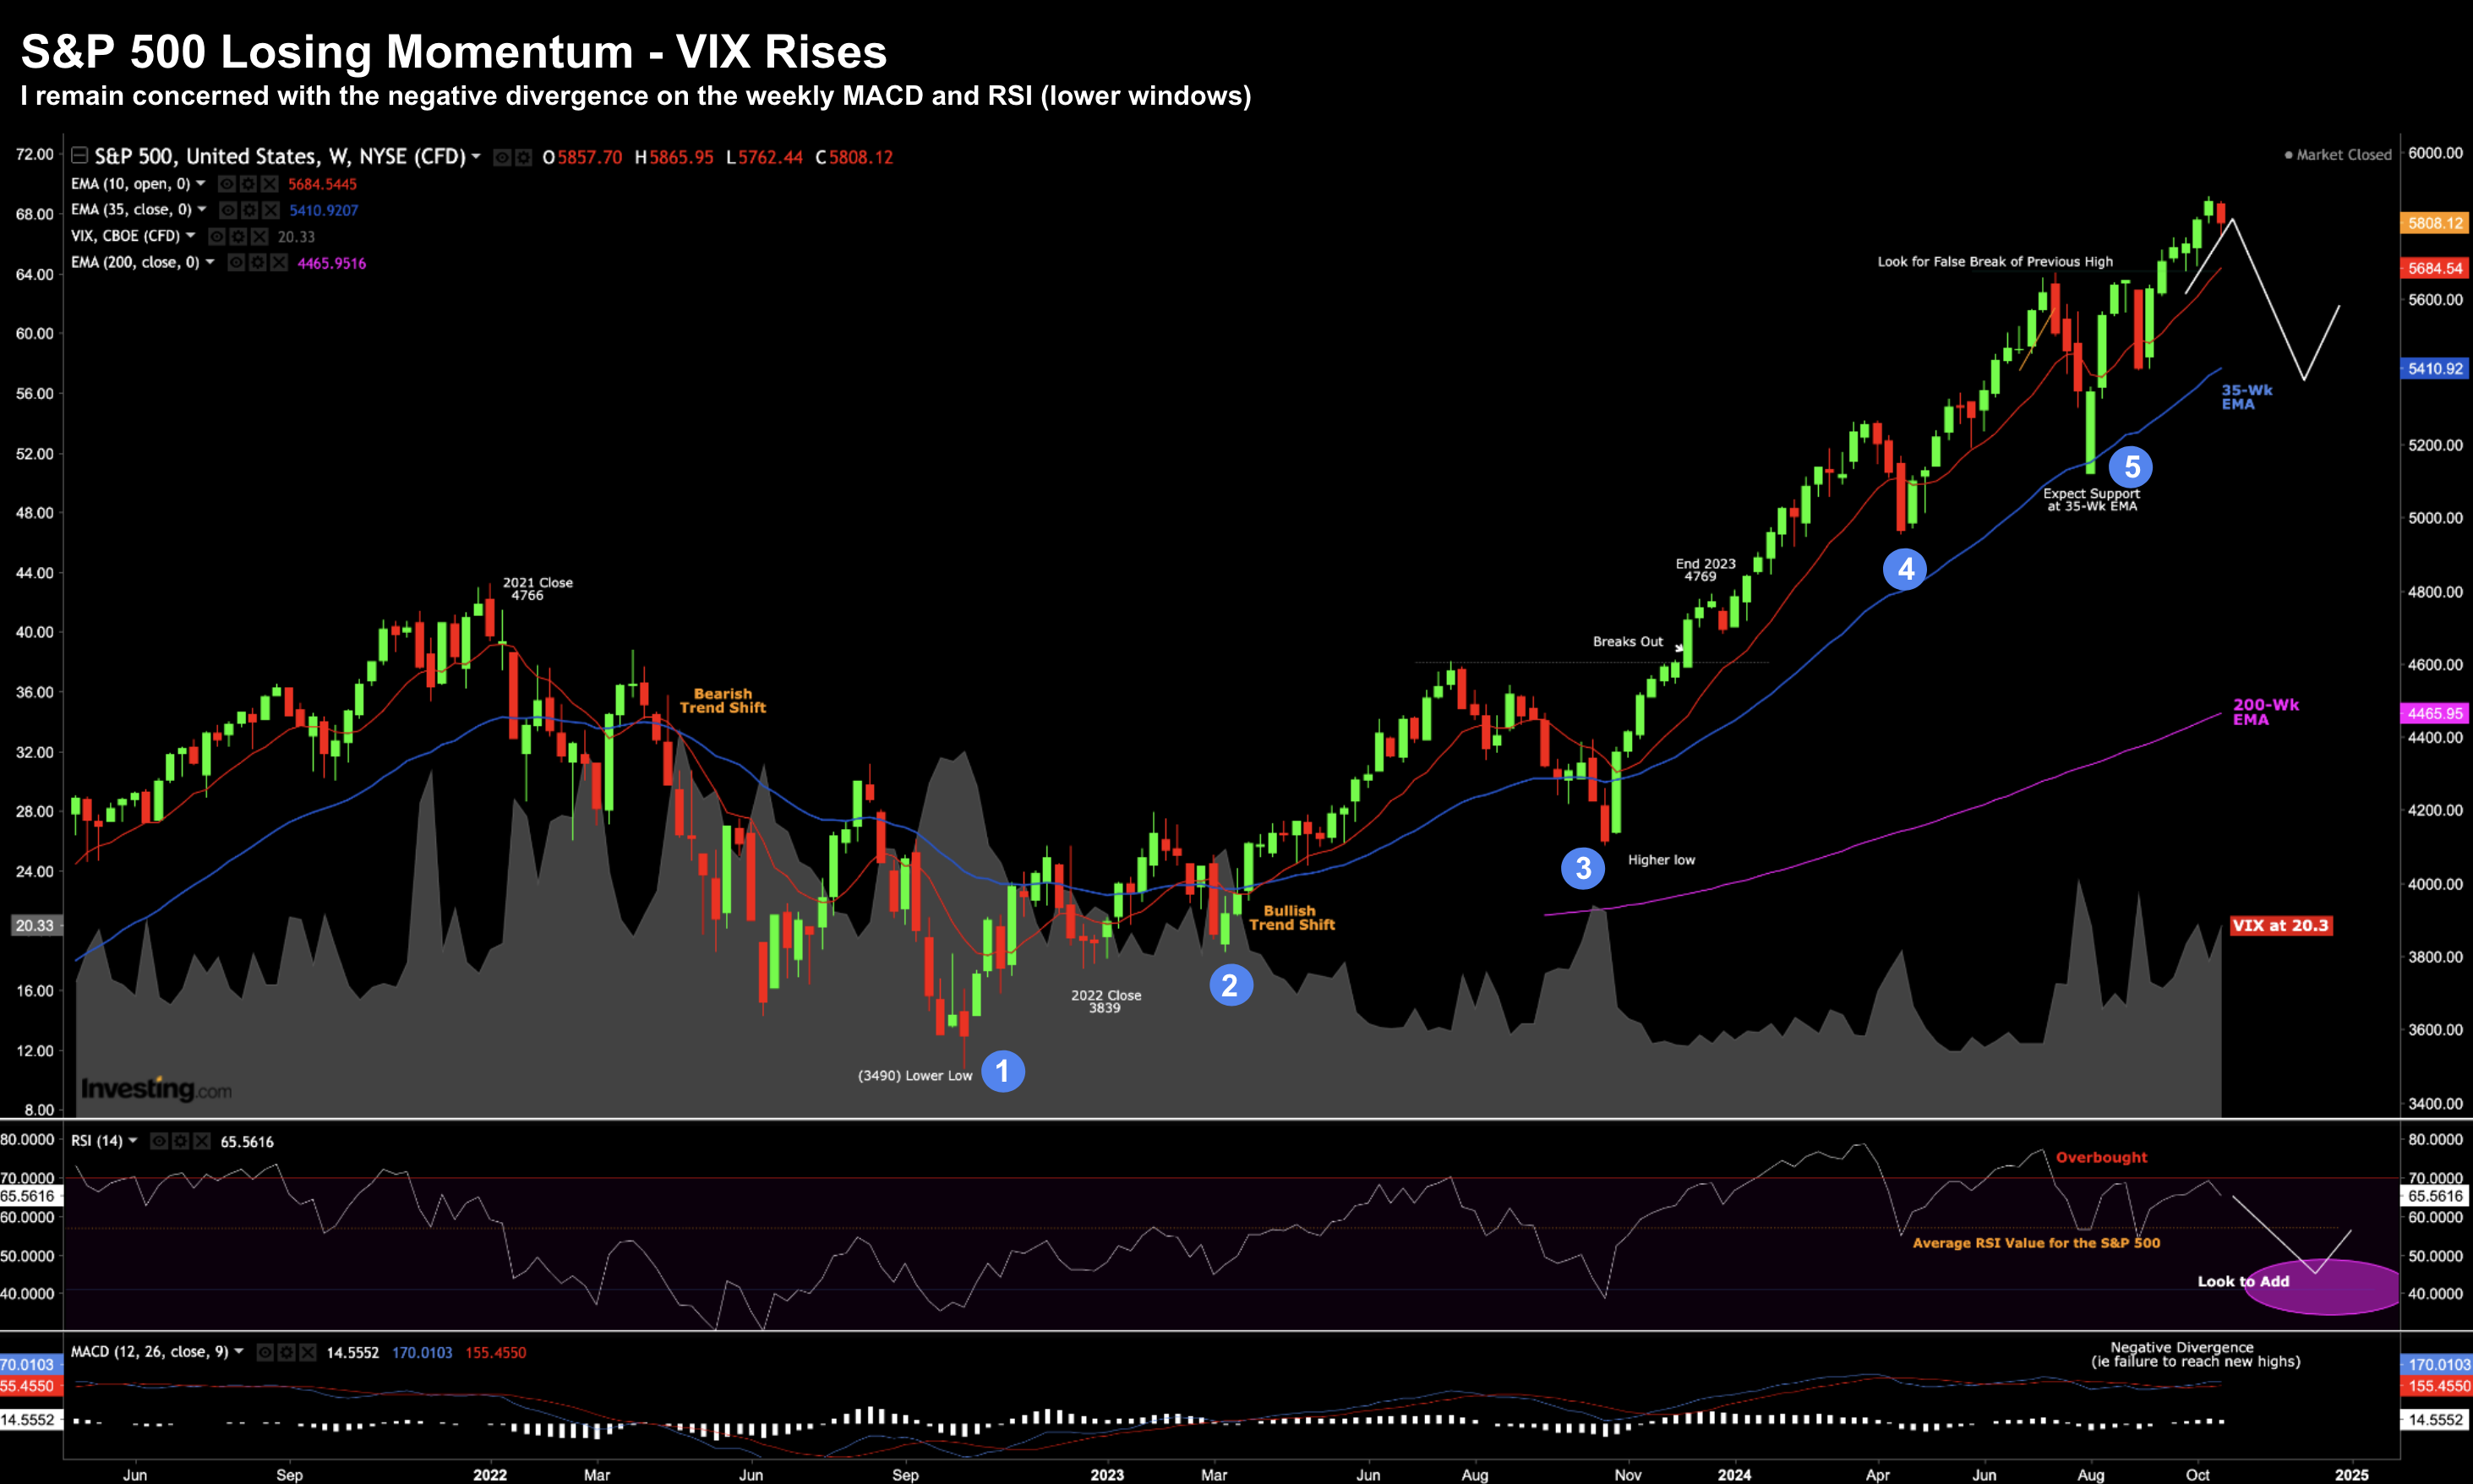
Below is the weekly chart for the S&P 500:
October 26 2024
- The Index remains extended from its 35-week EMA;
- A close back below previous high of 5670 bears watching (i.e., a possible false break);
- Negative divergence with weekly-MACD and RSI suggests loss of momentum; and
- VIX continues to rise – trading above 20
Above all else, I think adding exposure at this point is a poor long-term risk reward.
By way of example, I’ve labelled 5 good entry points for longer-term investors since September 2022.
My best guess is investors will be offered a sixth opportunity to buy the S&P 500 closer to its 35-week EMA (~5400 at the time of writing) at some point over the next few weeks or months.
It might be “next week” or it could be in “January” – I don’t pretend to guess.
However it’s ~7% lower than Friday’s asking price of 5808
Pending your level of patience and timeframe – my view is you will get the market at least 10% cheaper; e.g., a level closer to 5,000
For example, assuming earnings per share grow 11% to around $275 next year – that would represent a forward PE of 18.2x
That’s not cheap…. but it’s a better long-term bet than paying more than 22x (or ~5800)
A level closer to 16x (or 4,400) would be excellent value for the longer-term investor.
However, for many that probably sounds inconceivable.
💥 What Matters for Investors
One reader asked me this week if the recent rise in 10-year treasury yields (up from 3.60% to 4.20% in a few weeks) was a function of higher inflation expectations?
It’s a good question and that could be part of the answer… however I think most of the rise is term premium opposite fiscal concerns.
I don’t think inflation will be a (major) problem – but that assumes some fiscal constraint.
For example, the balance of money supply and demand supports a stable inflation outlook. However, that dynamic could easily change.
For now, as M2 growth has slowed and aligned with economic needs, inflationary pressures have receded.
Therefore, the likelihood of unexpected inflation in the near future appears low.
With respect to the S&P 500 – investors would be wise to exercise patience.
For example, the average forward PE ratio over the past 10 years has been around 18x.
That’s ~4 turns lower than today’s asking price of between 21x and 22x
And whilst 18x is not a bargain – it would lower your risk of sub-par returns over the next few years (as many expect).
Next week, large cap tech are on-deck for earnings.
This is important as they represent over 30% of the total market (and why PE ratios are so high).
And whilst I’m sure they will handily beat Q3 estimates – it’s the guidance I’m looking forward to.

