- A “recession like” reaction in the bond market
- Two tech stocks I traded today (and how)
- And why I think there’s more downside to come for the S&P 500
As a preface, I will start with something I shared only two weeks ago – July 20:
I made a decision to reduce my exposure to large-cap tech a few months ago. The decision wasn’t an easy one… these are extremely high quality stocks. And there are few better…
Did I sell prematurely? Maybe. The answer will be more obvious in 6-12 months when the cycle has had sufficient time to play out.
For now (as was the case when I sold) – I think the downside risks meaningfully outweighed further upside gains.
Put another way, I think most of these names are over-valued. I will add back exposure at better prices.
For about 2-3 months after I sold – the market made me look foolish.
These names continued to rally….
That’s fine – I will never pick a bottom or a top.
If I do – it’s luck – not skill.
However, I felt based on a combination of: (a) stretched technicals; and (b) extended fundamentals – these stocks appeared over-valued.
The upside did not handily offset the downside risks.
Fortunately for me, I feel a little “less” foolish now – with most of these names below the prices I sold them for (Apple the exception).
Below are the declines in the Mag 7 we’ve seen in three weeks:
| Company | July 10th | Aug 2nd | Correction |
|---|---|---|---|
| Nvidia (NVDA) | $134.91 | $107.27 | -20.5% |
| Meta (META) | $534.69 | $488.20 | -8.70% |
| Alphabet (GOOG) | $192.66 | $168.40 | -12.6% |
| Apple (AAPL) | $234.40 | $219.90 | -6.2% |
| Amazon (AMZN) | $199.79 | $167.69 | -16.1% |
| Tesla (TSLA) | $263.26 | $207.67 | -21.1% |
| Microsoft (MSFT) | $466.25 | $408.49 | -12.4% |
Nvidia, Amazon and Tesla have seen strong (double-digit) precentage declines…
In each case, these three stocks boasted forward PE’s greater than 40x (i.e., very expensive)
Apple – which behaves more like a consumer staple than a tech stock – has fared the best only 6.2% off its high.
Across the Nasdaq 100, more than a third of all names have lost at least 10%.
However, 20% of all Nasdaq 100 stocks names have lost more than 20%.
In my summary, I’ll outline the details of two trades I made today (Amazon and Nvidia) – but I didn’t buy the stocks.
As I think there’s more selling to come…
But first, let’s look at why the market is starting to correct.
Sahm’s Rule Triggers
July 5th I took issue with the financial media’s claim that the “jobs data was strong”…
In short, I looked underneath the hood and made the assertion that the data was actually weak.
Most of the jobs being created were from the public sector (which cost taxpayers money) and healthcare.
The private sector was losing full-time jobs (well over a million jobs less the past 12 months).
As turns out, unemployment is weakening at a faster clip than the market anticipated.
Go figure.
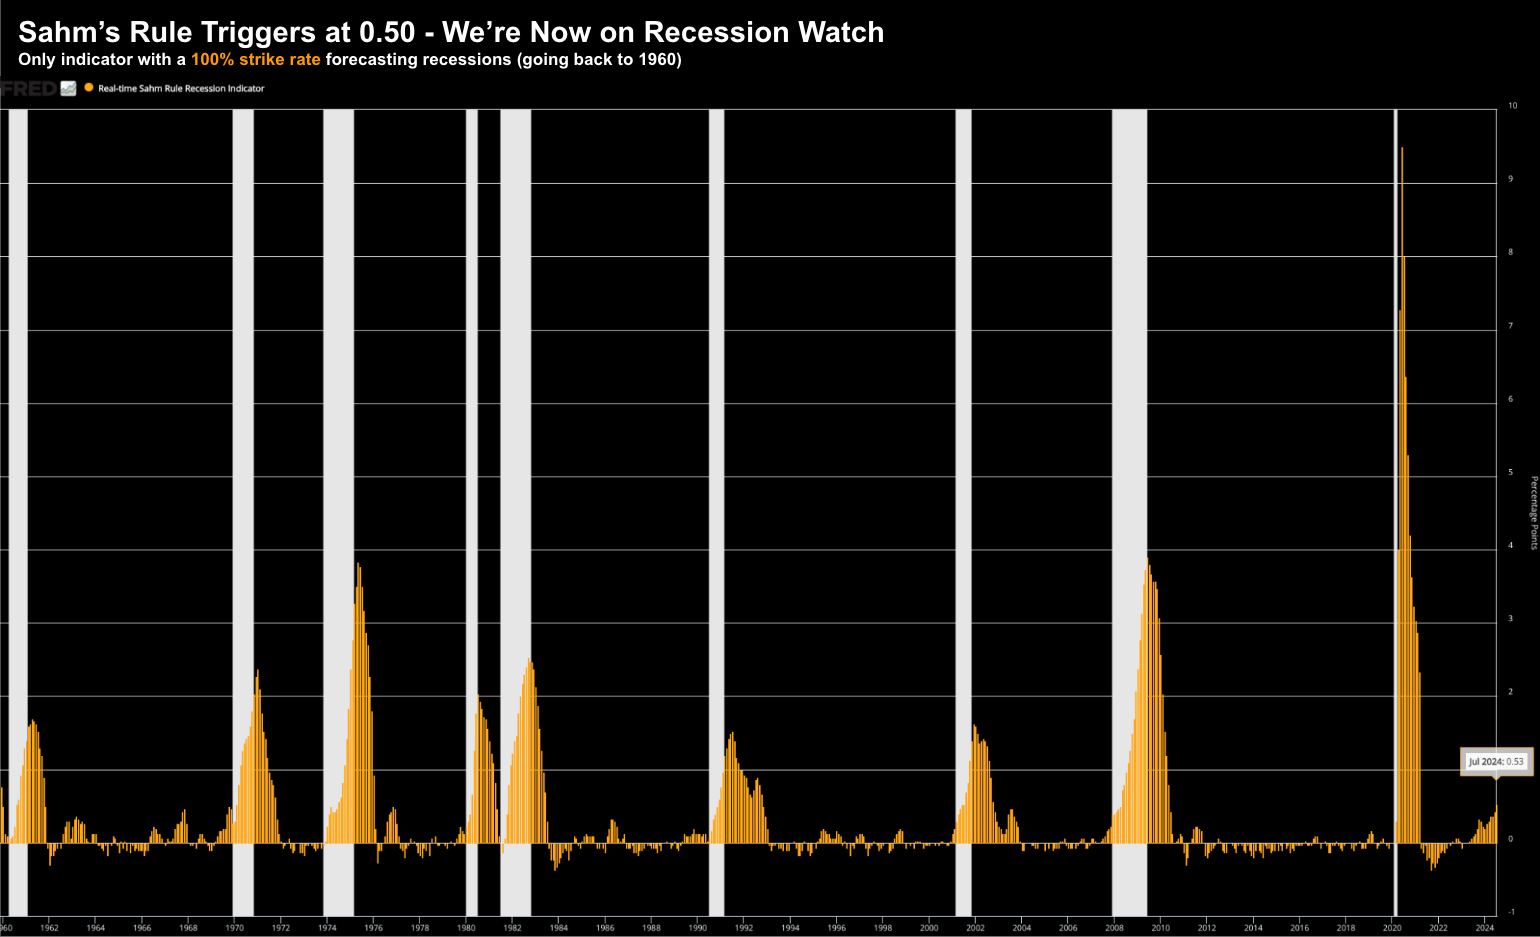
What’s more – Sahm’s Rule – which bats at 100% for predicting a recessions – just triggered.
I warned of this in my previous post here – stressing what we see with employment will have a large bearing on the Fed’s rhetoric.
For example, I mentioned that if monthly unemployment should edge up to 4.2% or 4.3% – it’s likely this rule will be in play.
Now for context, below is the indicator going back to 1960.
In every instance – when this indicator hit 0.50 – a recession was imminent (white bars)
August 2 2024
- Non-farm payrolls grew by just 114,000 in July, below the downwardly revised 179,000 in June (from 206,000)
- The unemployment rate edged higher to 4.3% – highest since October 2021
- Health care again led, adding 55,000 to payrolls. The Government continued to add jobs – 17,000
- Average hourly earnings increased 0.2% for the month and 3.6% from a year ago.
But as I keep reminding readers – employment is a lagging indicator.
Therefore, it’s not useful as a leading indicator.
This is simply the end result of damage that has already taken place but is yet to show up in equity prices.
And whilst I am interested in what is happening with jobs – the leading indicator I was more interested in are wages.
Wages – in real terms – dictate what we should expect with consumption.
It follows that if people are earning more (when adjusted for inflation) – they are likely to spend more.
The opposite also holds true.
Now mainstream told us today that “wages were up 3.6% from a year ago”.
Okay – good news – potentially.
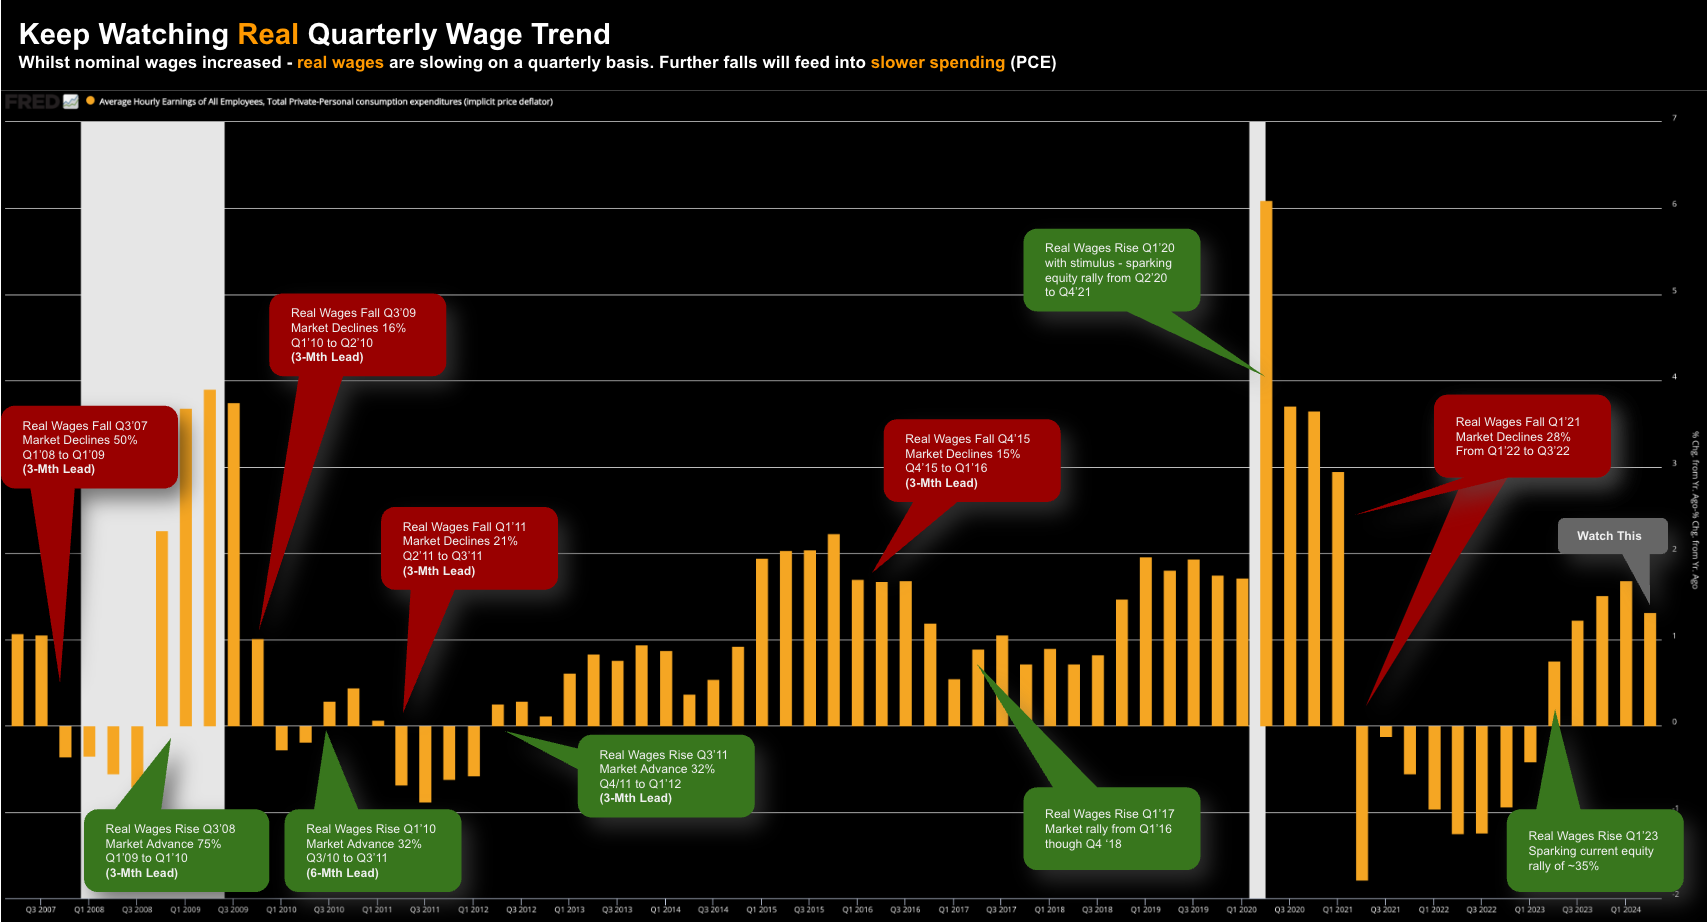
In order to give that data point meaning – we need to do two things:
- Adjust for inflation (using the PCE price deflator) – giving us real wage growth; and second
- Assessing the quarterly change year-on-year (and its trend)
Below we find the quarterly trend – annotated for previous notable changes and the subsequent lagging impact on the S&P 500)
Aug 2 2024
The good news is real wage data is still up YoY on a quarterly change basis – however it has slowed from last quarter’s pace.
That is very good news for inflation – but less good news for consumption (where consumption is 70% of GDP)
Last quarter real wage gains were 1.68% year-over-year. For Q2 this slowed to 1.31% year-over-year.
Why does this matter?
The key determinant of growth in unit consumer spending is the unit purchasing power, or real wages.
I think this is one of the less noticed indicators in economic commentary.
For example, the market will focus most of its attention on the 4.3% (lagging) unemployment data. That will be your headline.
However, I doubt if you will see the real (vs nominal) wage growth number talked about.
Real wage growth possesses neither the drama of unemployment; nor the ‘mystery’ of the Fed’s policy decisions.
However, it is a cornerstone indicator in forecasting consumer spending and the economy.
But when you have almost two-thirds of all economic activity driven by consumption – this should be one of the primary indicators observed.
Over-Reaction in Yields
For me the reaction in equities today was neither here nor there.
For example, we are barely 6% off the all-time highs – which is not a big deal. But I will talk about this more in a moment..
What I did find curious was the (over) reaction in yields.
It seemed excessive.
For example, last month the bond market was pricing in what I consider a normalization with rate cuts.
However, they went from pricing in rate normalization (which is acceptable) to pricing in “recessionary cuts” based on the jobs news.
And yet – the Fed are yet to do anything!!
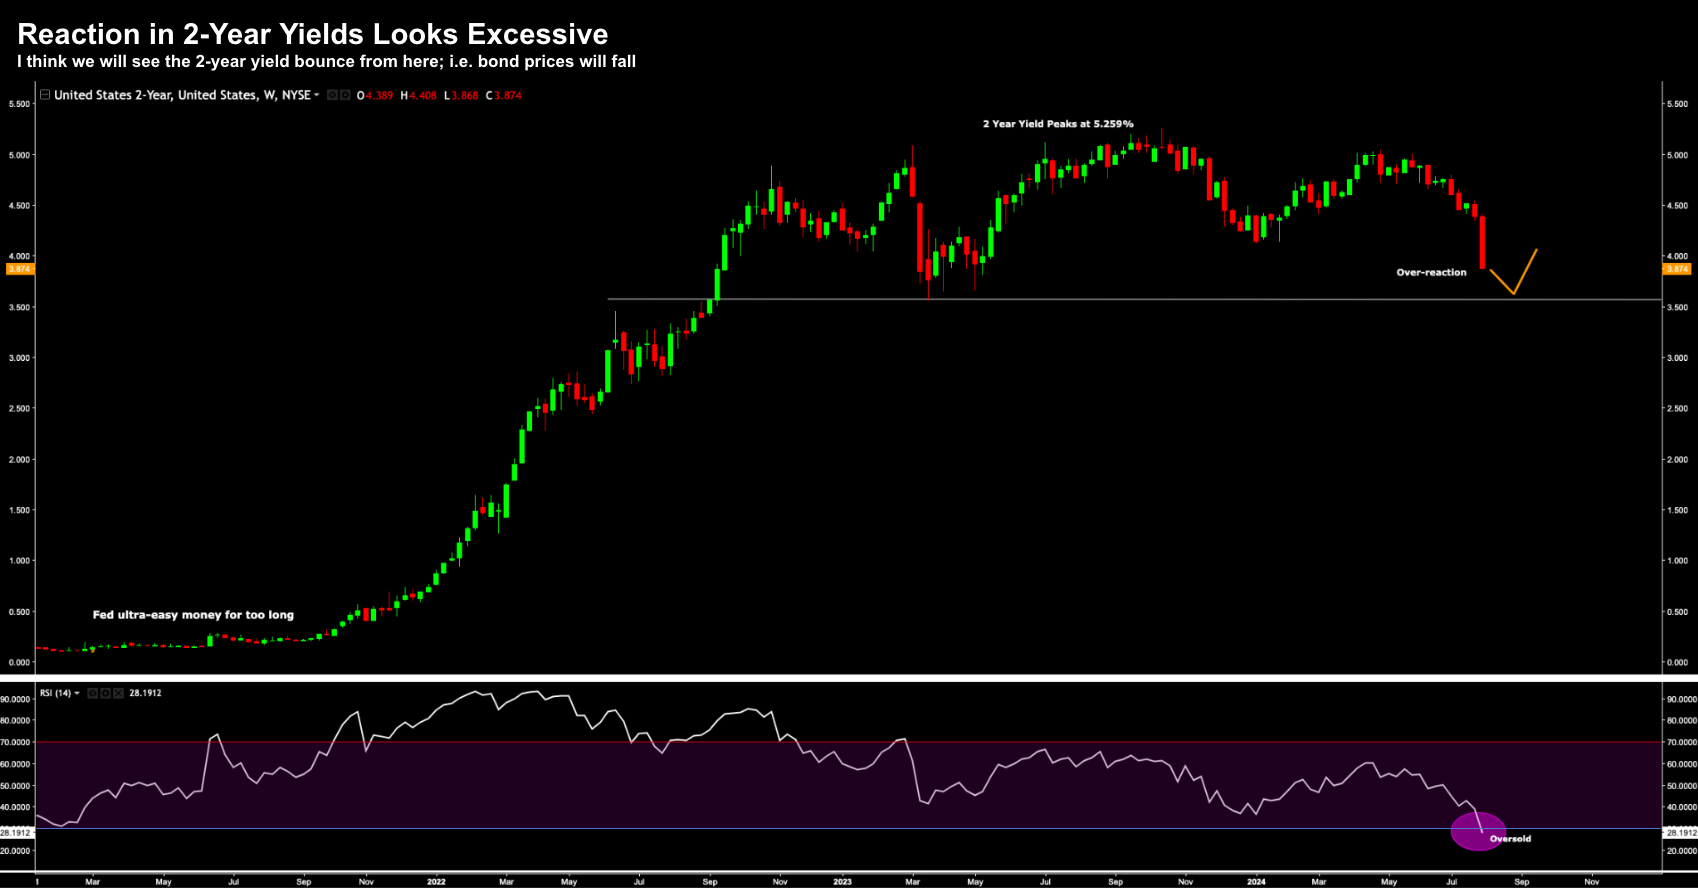
Let’s start with the two-year:
Aug 2 2024
The 2-year yield opened the week at 4.39%
At that point I said this was a good bet – as I felt yields would fall (i.e., the bond price would rise).
Well they dropped like a rock – all the way to 3.87% in a week
Put another way, this is the market now expecting the Fed to cut rates 50 basis points in September (not 25); and then follow through with further cuts this year.
I think that’s ambitious.
It’s now about 160 basis points ahead of the Fed.
My expectation from here is to expect a rally in yields (or bond prices to fall)
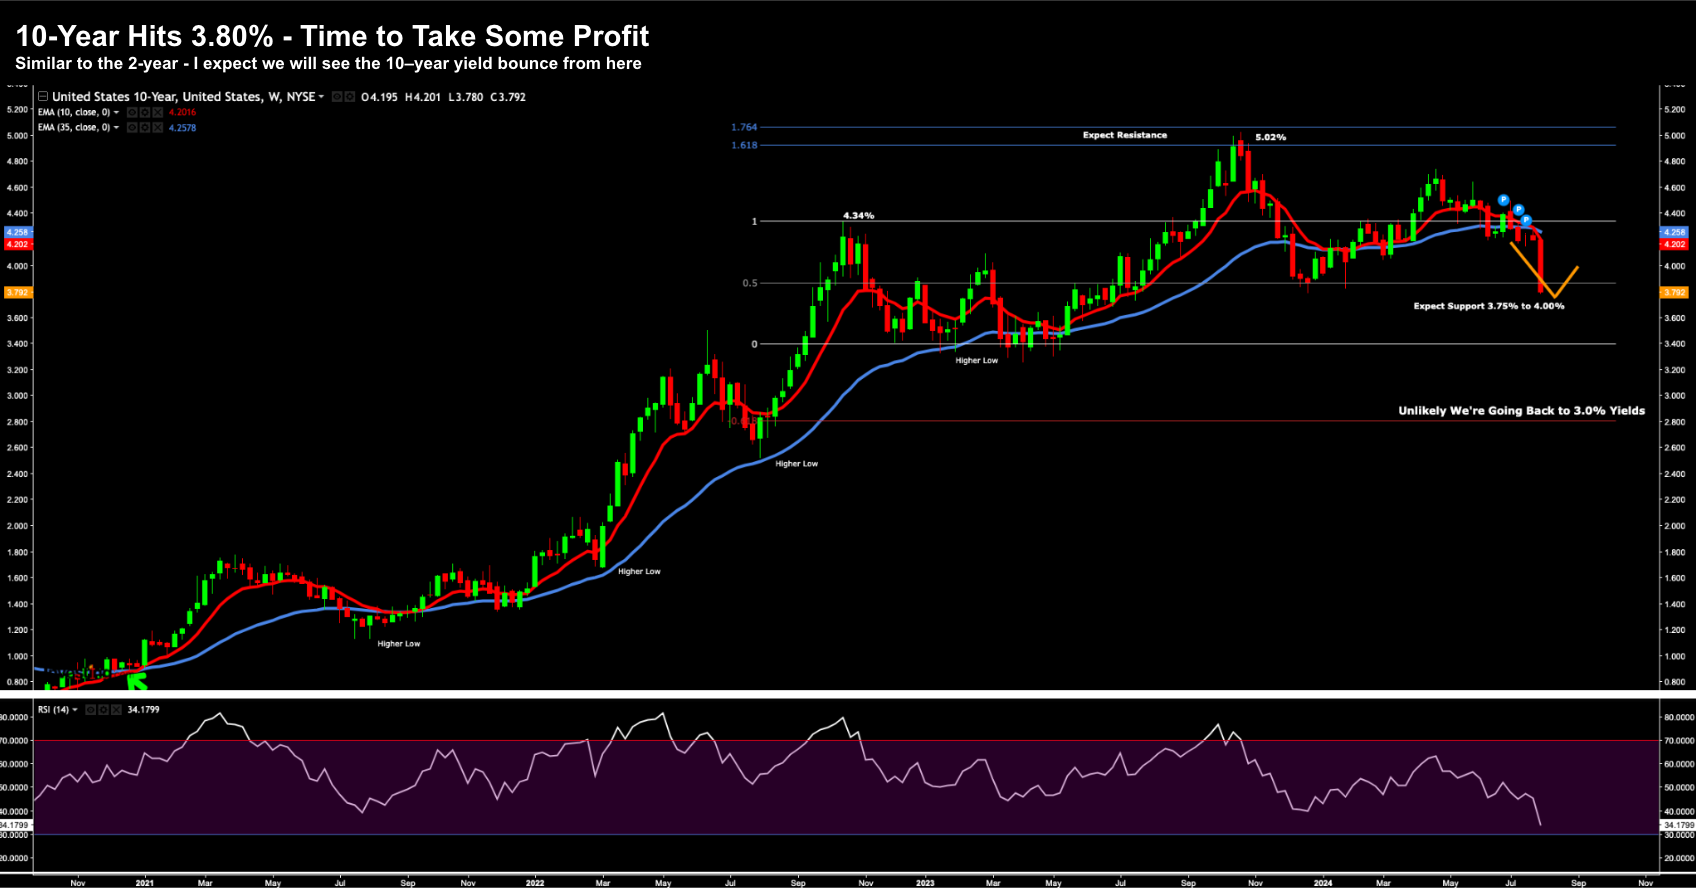
Turning now to the 10-year – we saw a similar reaction:
Aug 2 2024
The 10-year traded all the way down to around 3.80% (maybe a hair below) from 4.20% at the start of the week.
This is a massive move in bond speak… which feels (to me) like a panic into safety.
For example, we have been watching global equities sell off – which meant traders were looking for somewhere to put the money.
Where did that cash find a home?
In the most liquid (and safe) asset there is: US Treasuries.
However, as I was saying earlier in the week, I think we’re now in the realm of where the 10-year yield will find support (especially given the weight of the fiscal situation).
Put another way, bond prices will see resistance.
Given my long exposure to EDV (which benefits from falling long-term yields) – I used this opportunity to take profits on half my position.
With respect to the other half – I sold in-the-money calls – effectively hedging my remaining half position (in the event we see yields rally)
Those (sold) short calls against my long position yielded ~17% annualized.
S&P 500: Not Yet a Sell-Off
Last but not least – let’s take a look at what we saw with the equities.
Financial media headlines will read “big market sell off” or “Dow plunges 700 points” – exaggerated using images of growling bears.
Really?
It’s theatrics.
We’re merely 6% off the highs… that’s all
Maybe use those types of headlines when we’re 20-30% off the highs.
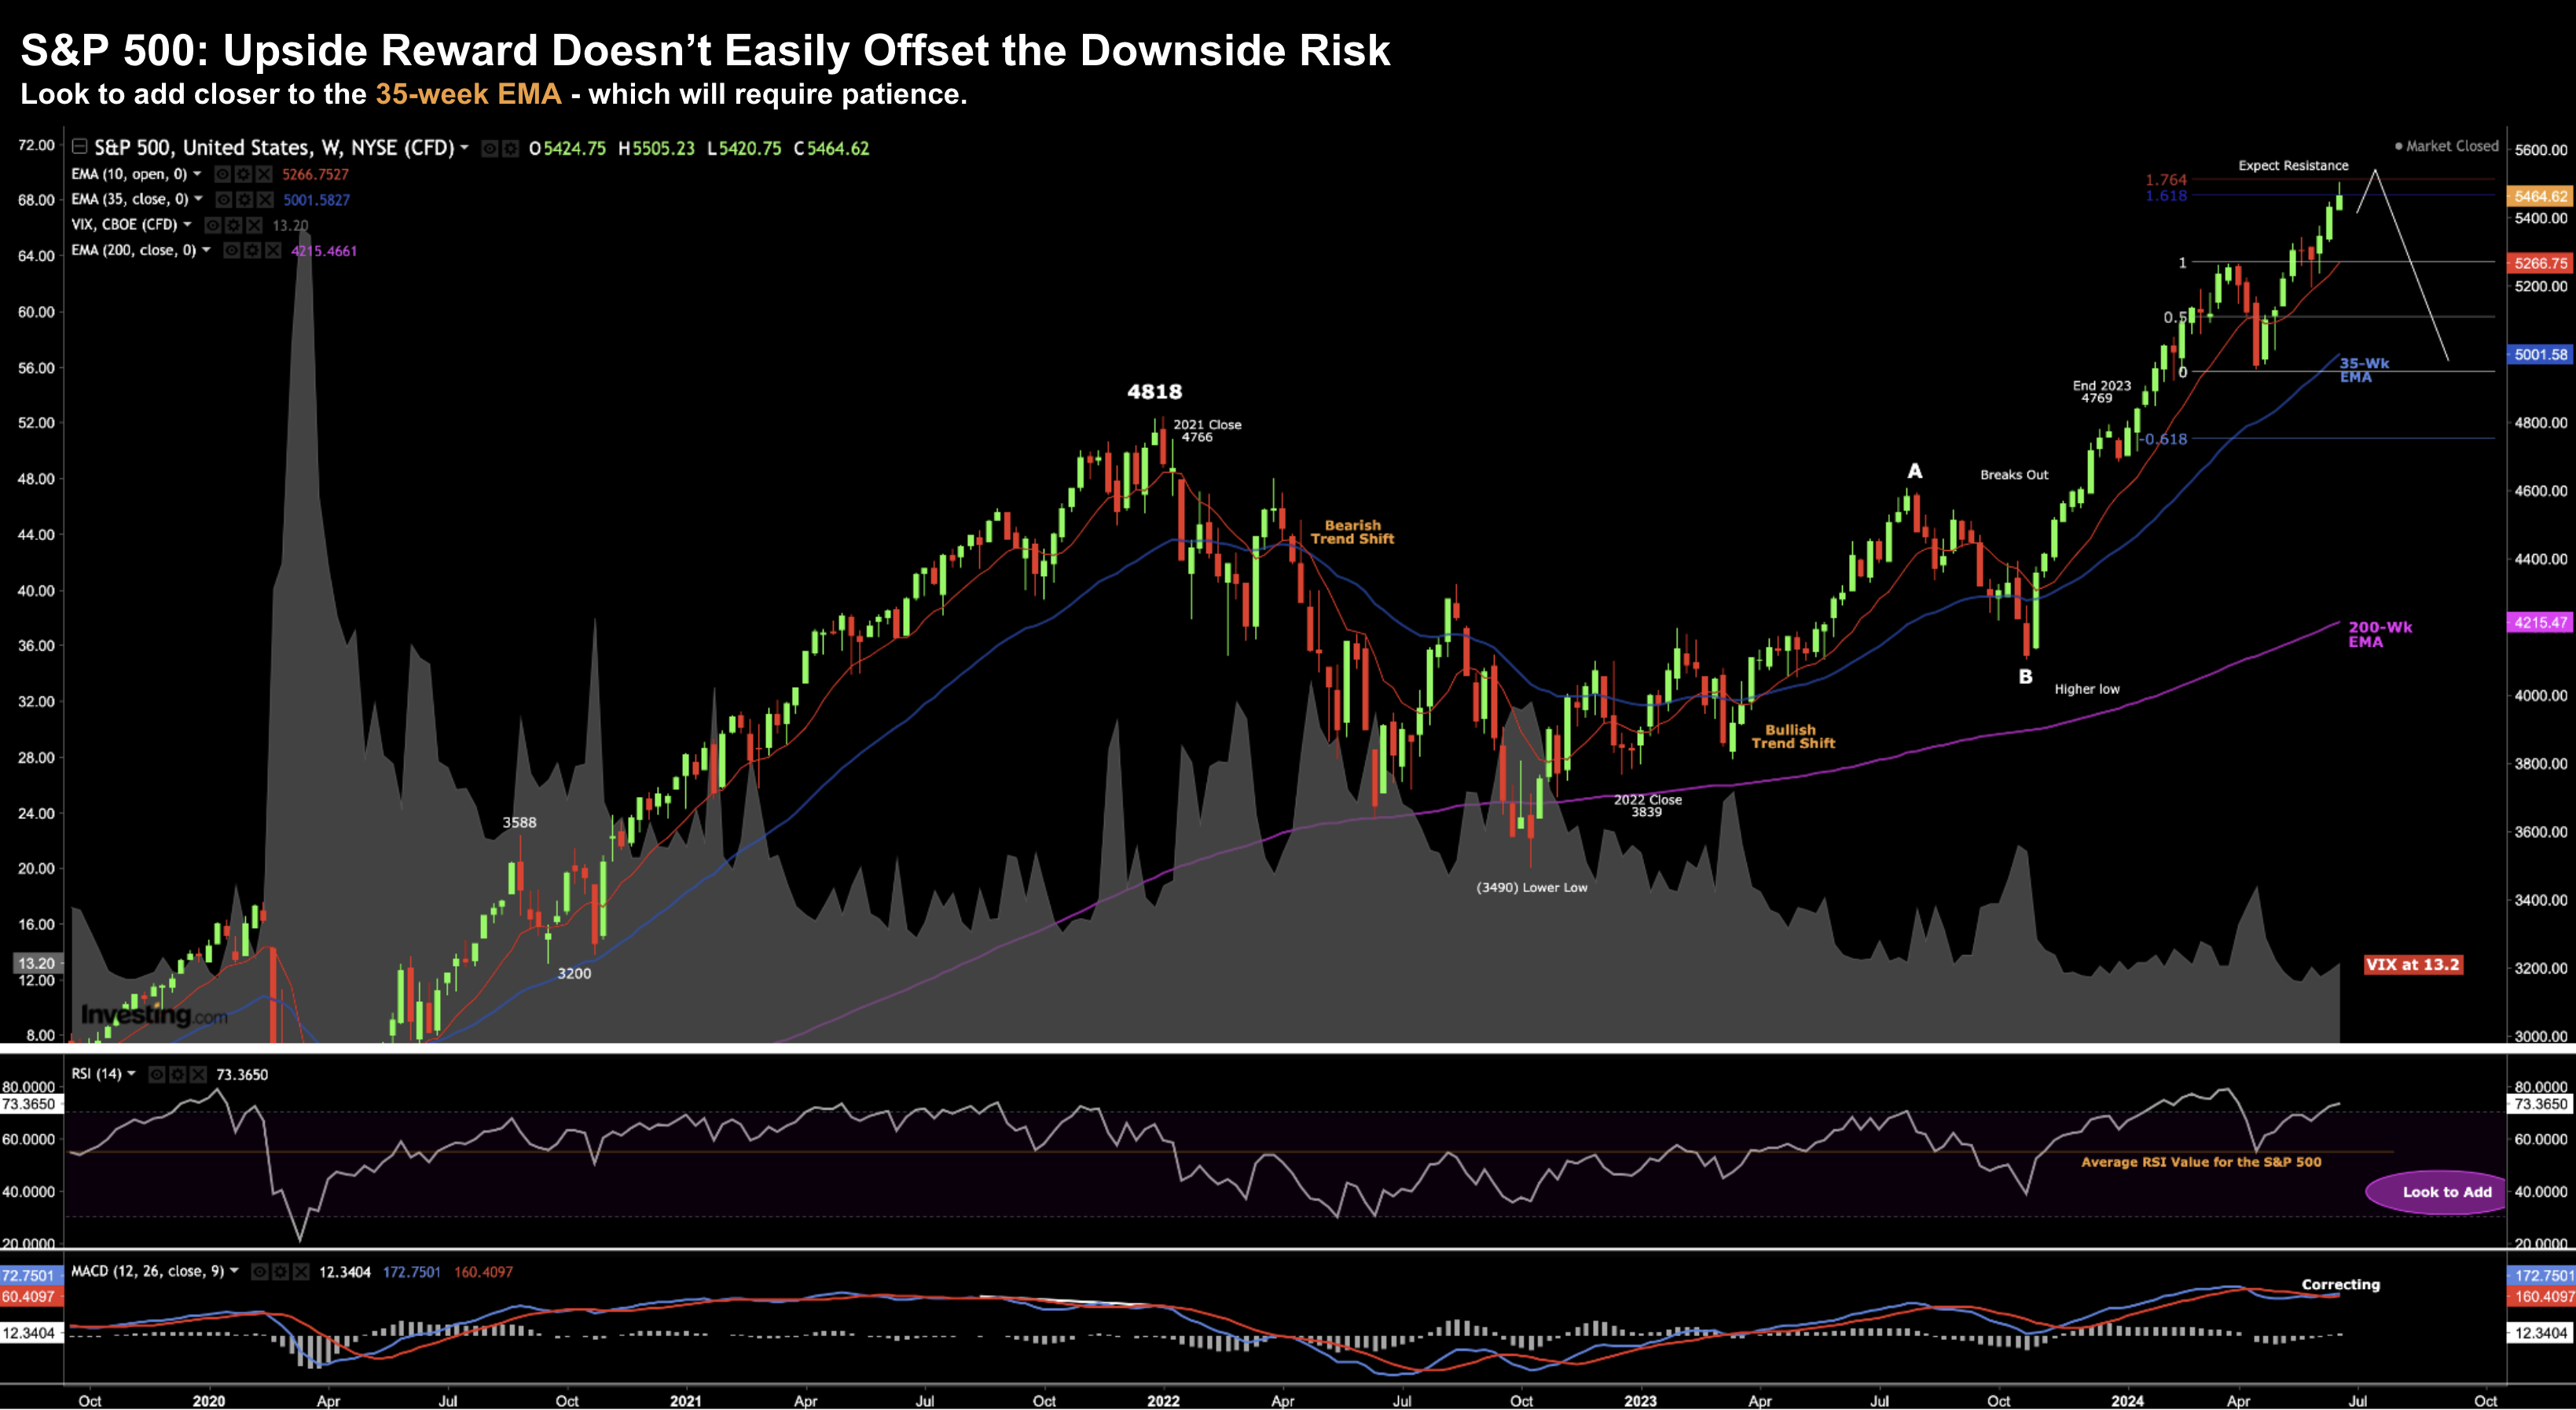
To kick things off – let’s go back to my post of June 22 “Buying is Easy – Selling is Hard”
I enjoyed writing this post as I felt it offered many valuable (life-long) lessons.
As part of the post I also provided this chart for the S&P 500
June 22 2024
Note the headline:
“S&P 500: Upside Reward Doesn’t Easily Offset the Downside Risk”
I also sketched in a white line which suggested the market could easily trade higher (e.g. to 5600) — however I felt like there would be a gravitational pull back towards the 35-week EMA at some point over the next few weeks or months.
Repeating my observations:
If anything – this is a warning to take partial profits (or as a minimum buy some protection).
We also see the price retracing to around 61.8% to 76.4% outside the pullback we saw over March and April. Often this is where we will see some resistance.
Finally, we see negative divergence with the weekly MACD. That means we see the MACD making lower highs whilst the price is making higher highs. Ideally we want these two signals to align. Divergence is a signal momentum is starting to wane.
In summary, technically I expect a pullback.
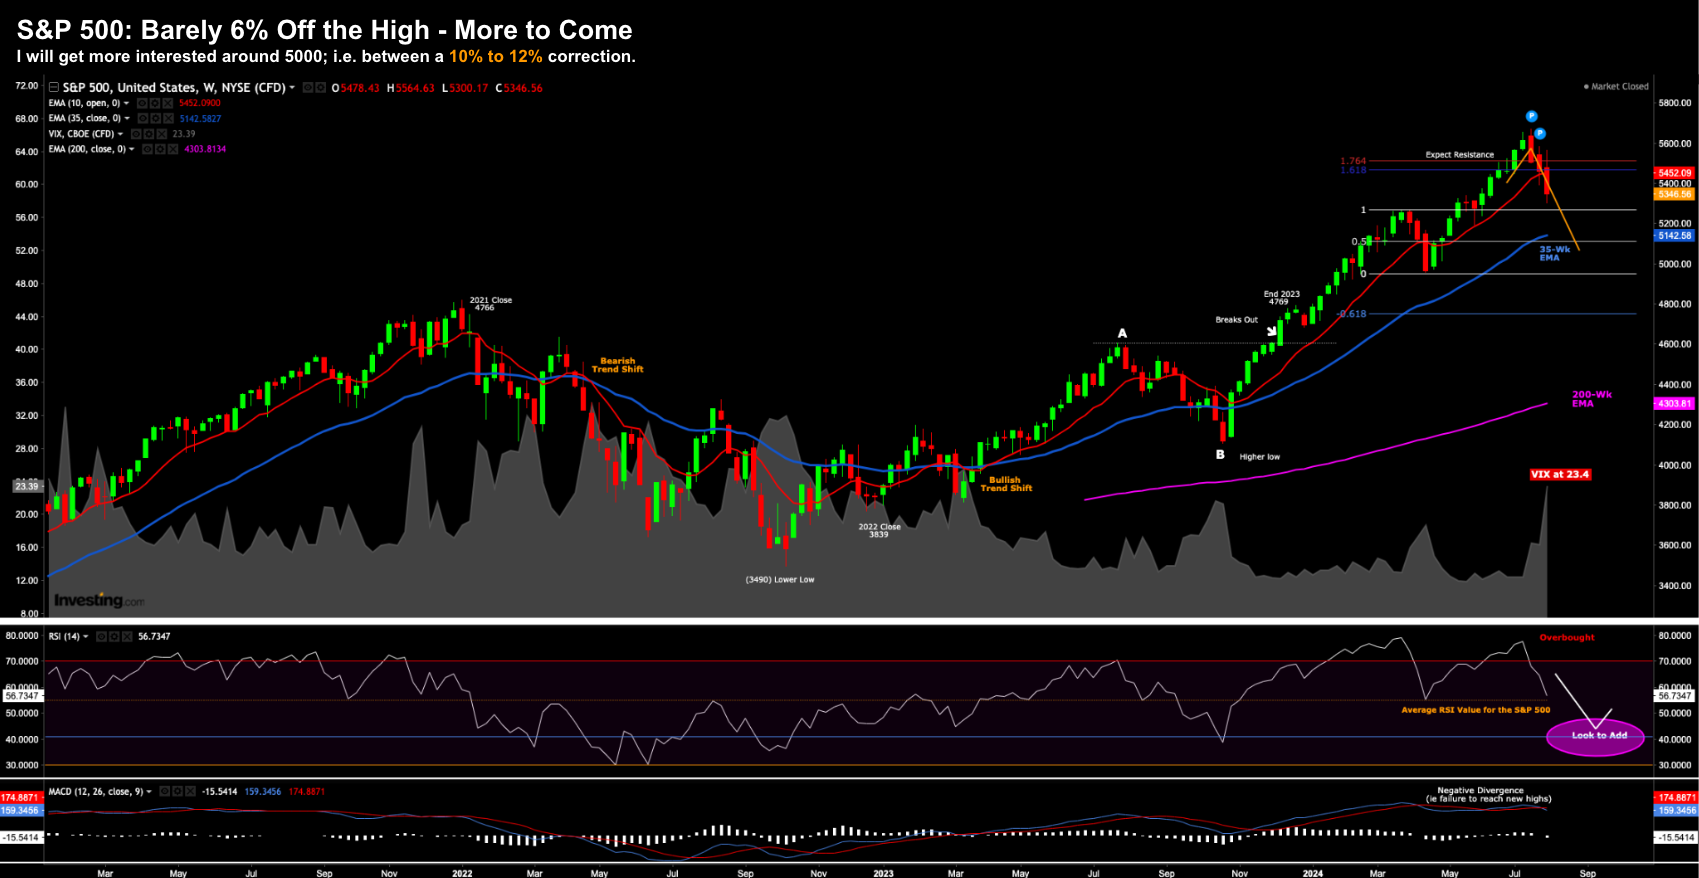
Aug 2 2024
In this case, things have largely traded per the script.
They don’t always happen this way – but occasionally it works out.
We found resistance in the zone which I felt was high risk; and we pulled back sharply from an overbought RSI.
The question you will probably ask is do you buy the Index here?
My answer is no. Not yet.
I did pick away at a couple of specific names (which I will get to shortly) – but if you are buying the Index – you can still afford to be patient.
Two things for me:
- We will likely challenge the zone of the 35-week EMA ~5150. That’s ~4% lower than this week’s close;
- The weekly RSI is at a value of 56 – I will get more interested at a value closer to 40
Something else to call out is the large (welcomed) move we saw in the VIX.
For months it’s been sitting around 12.
I’ve been saying (for months) this is an overlay complacent market – with an equally overly complacent narrative around a soft-landing.
Well guess what…
When all traders are leaning to one side of the boat (complacency) – what happens to the boat?
This is a powerful move in the fear index…. up more than 30% above its 30-day EMA
You don’t see that very often.
And I took full advantage of this with two trades….
Putting it All Together
- Nvidia (NVDA) and
- Amazon (AMZN)
As you know, these are two of the highest quality stocks available.
I really like both of these businesses – but I was not happy paying the premium being asked.
In fact, not long ago I dumped all my Amazon stock at ~$180 – only to watch it climb to around $200 (note: an area where CNBC expert Josh Brown said he was buying)
And whilst I think both NVDA and AMZN still have further to fall… I wanted to take advantage of the 26 VIX and the sell-down in these names.
Here’s what I did:
- NVDA – Sold Nov $75 Puts for $3.00 for a 13.90% annualized return; and
- AMZN – Sold Oct $150 Puts for $4.50 for a 14.20% annualized return
So what happens from here?
In the event these stocks trade below the strike price at the time of expiry – then I will take full delivery of the stock. For example, I will own NVDA at $75; and AMZN at $150.
However, if these stocks trade 1c above these strike prices at the time of expiry – then I simply bank the annualized returns above.
Again, I’m not unhappy walking away with 13.90% and 14.20%.
But more important, those are the prices that I’m happy to own these quality stocks.
How did I come up with $75 and $150?
This was a combination of both looking at the chart – but more so valuations.
With respect to AMZN, I expect them to earn in the realm of around $6.00 per share next year.
At $150, I’m paying 25x forward earnings.
Looking at their latest quarterly report – I liked what I saw with their cloud AWS business (it’s the clear leader and forging ahead) – and also their expanding (high margin) advertising growth.
And whilst the market was concerned with softer guidance – I’m okay paying $150 for AMZN with a 3+ year horizon.
From a technical perspective, $150 was major resistance for the stock during 2022 and 2023. Quite often we find previous resistance becomes new support.
With respect to NVDA – I expect them to earn in the vicinity of $3.75 per share next year.
At $75, I’m paying ~20x forward earnings.
Given their position in the AI chip market and growth expectations – I think $75 is a fair price to pay for a 3-year horizon.
From a technical perspective, $75 was the major low for the stock in April (not long ago!) Therefore, I think that also has the potential to act as support.
I also put on a number of other (similar) plays today… taking advantage of option premium in quality names.
The model was very similar…
In other words, I’m doing three things:
- Targeting very high quality stocks that are well off their highs;
- Allowing for the stock to correct a further 10%-20% (pending support levels); and
- Assessing if I’m being paid ‘15% to 20%’ annualized to write the contract against the stock
Just a quick note (as I get a lot of emails on this).
This blog is not about detailing every trade I put on (despite many requests).
I am not here to feed you fish… my goal is to teach you how to fish.
And if I’m successful – you will never need to read this blog again. You will feed yourself for a lifetime.
In closing, I think there is every possibility we see more selling Monday and Tuesday.
And I hope we do!
There are a number of orders I placed today which were not filled. They didn’t quite meet my criteria above.
And with respect to my long position in bonds – I used what I felt was ‘sheer panic’ in bonds today (a “recession-like reaction”) to lock in profits on these positions.
All of these trades required patience.
With respect to bond trade – I’ve patiently been waiting for yields to come down – and they did in a hurry.
And in terms of equities – I sold over-valued tech earlier this year (which was hard to do when everyone else was buying) – and waited for a correction.
In other words, I allowed the trades to come to me.
Let’s see how we go from here… I don’t think the selling is over yet.

