- S&P 500 gets back to my nominated 4100 to 4200 zone… what now?
- Tech benefits from sharply lower bond yields
- Core PCE inflation surges – reversing previous month’s decline
After a torrid first six months – the worst start to a year since 1970 – July felt hopeful.
From peak to trough – market’s plunged some 24% at its June lows.
The threat of stagflation – higher inflation in conjunction with contracting growth – loomed large.
Stocks suffered meaningful – but necessary – multiple contraction.
For some – it probably felt like 2000 or 2008 (for those old enough to remember!)
But this month the S&P 500 recovered ~14%
From mine, things have ‘mostly’ traded per the script from Q4 2021.
I felt the risks to the downside handily outweighed the risk when we were trading up around 4800.
However at a level around 3600 – the risk/reward equation shifted.
A lot of the headwinds were priced in.
Not all… but a lot.
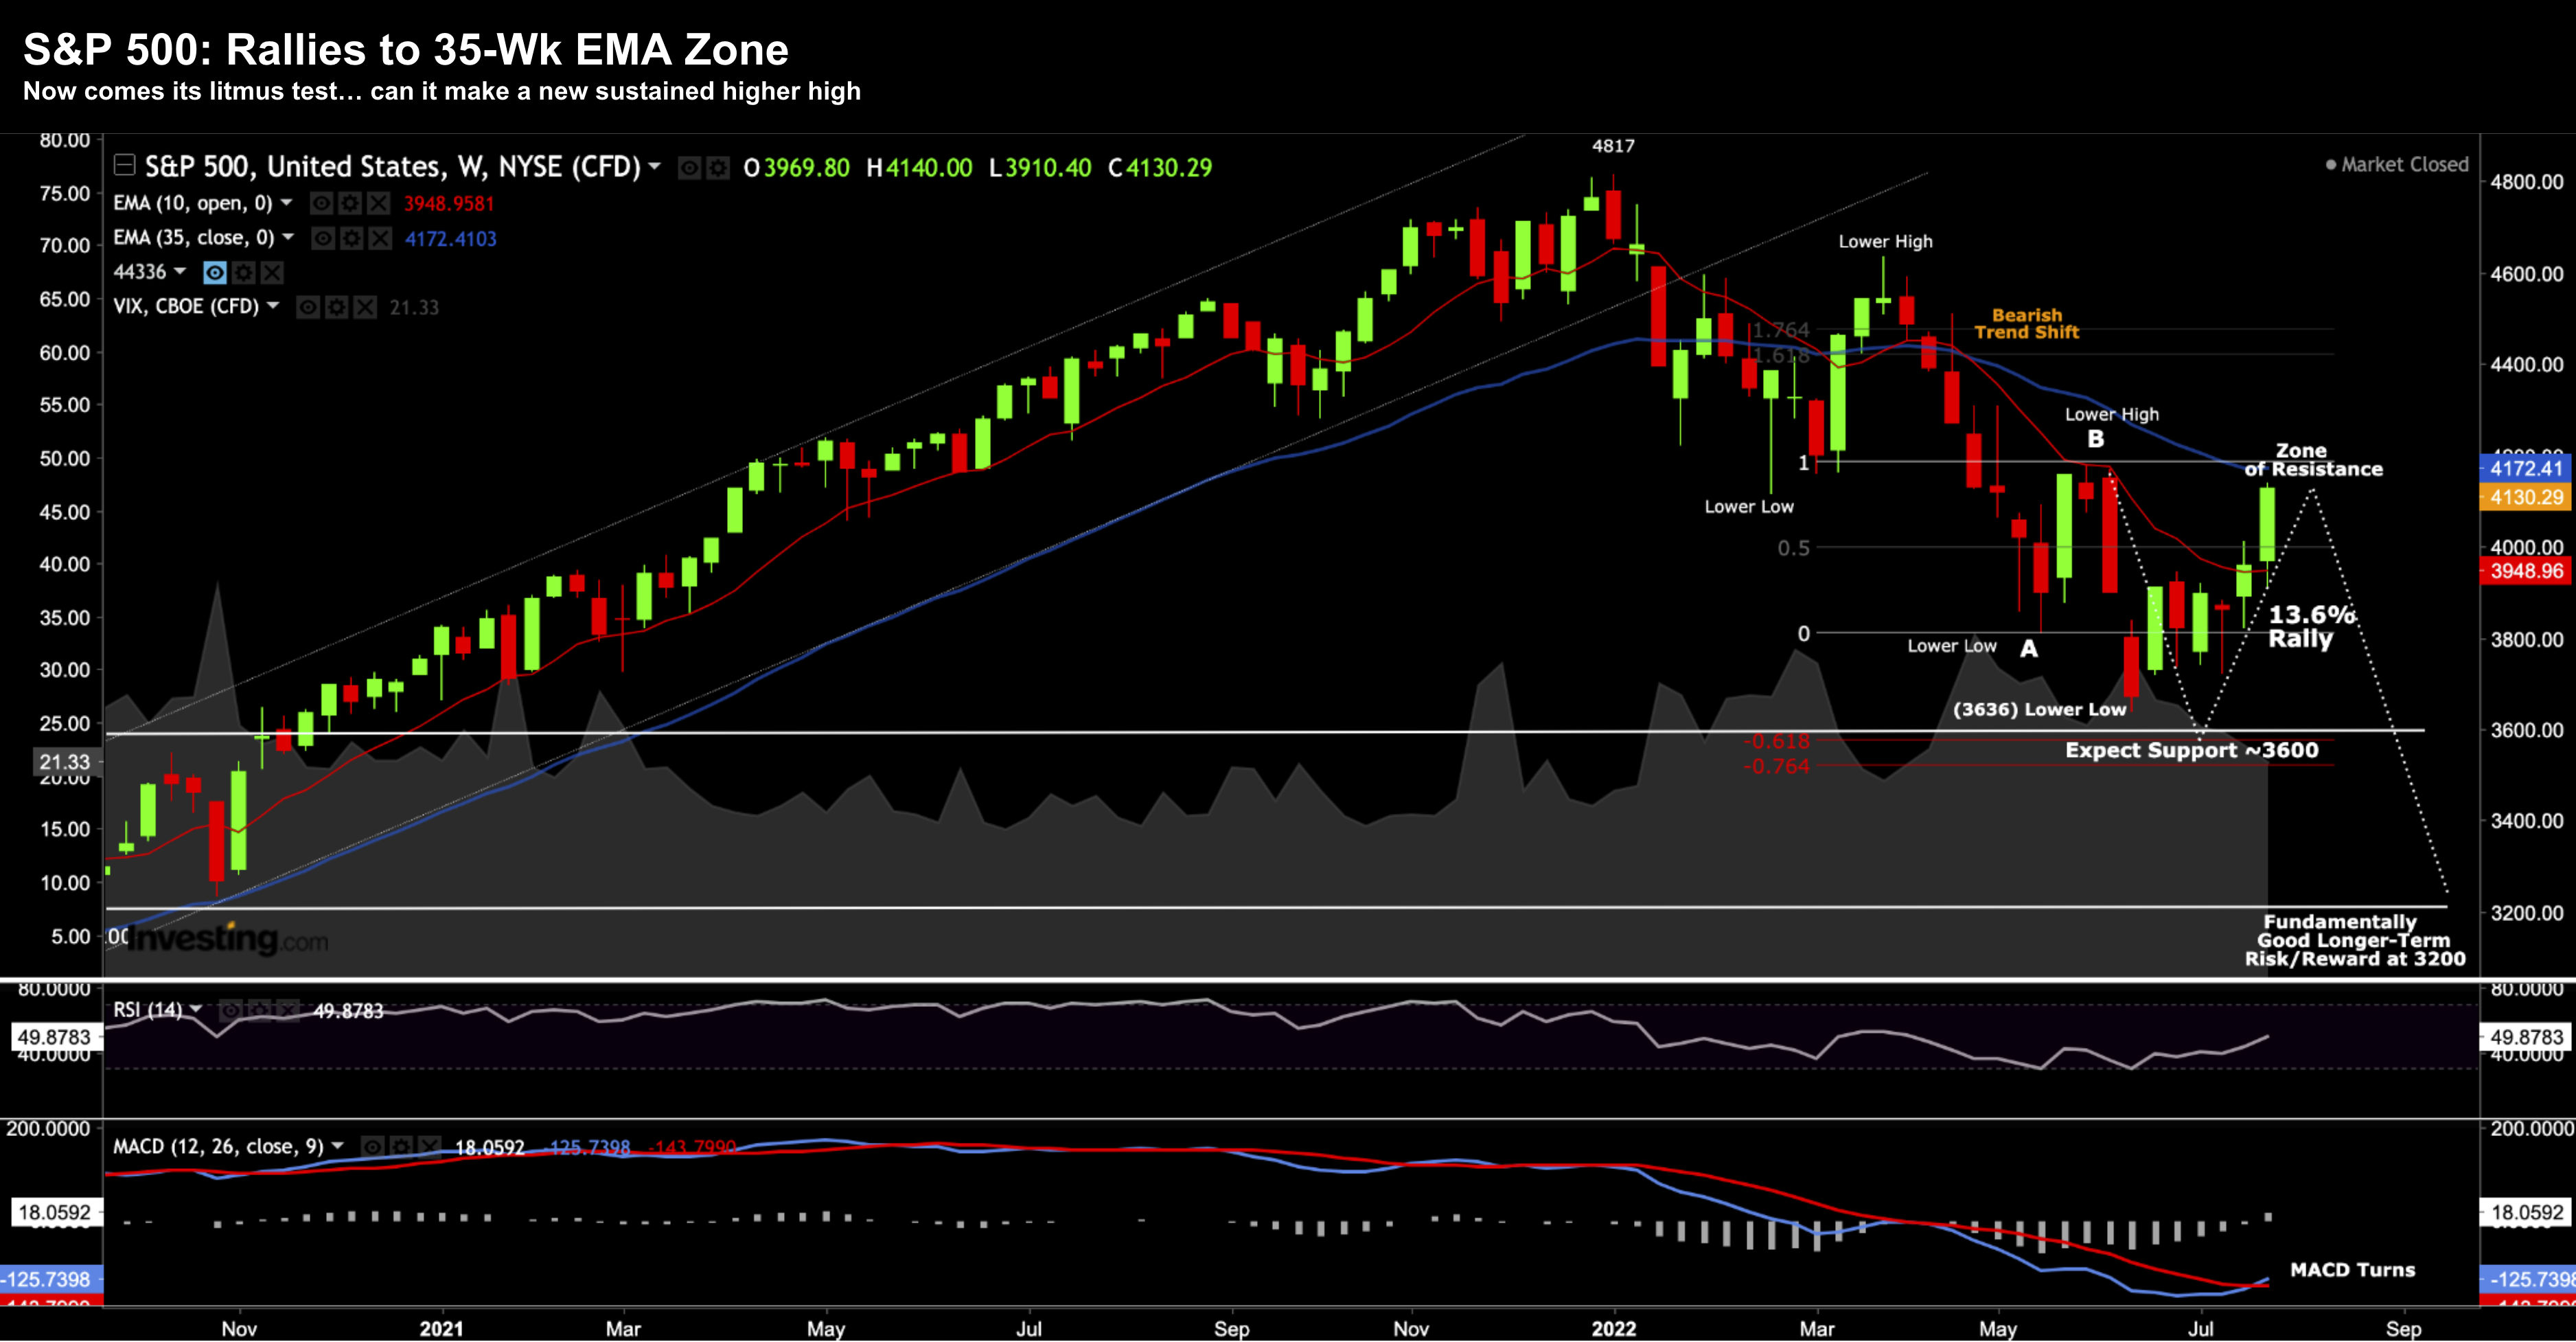
Of late, I was looking for markets to find interim support ~3600 and then potentially rally back to the 4100 to 4200 zone.
I offered this chart (and forecast) a little while back…
July 15th 2022
This week we closed 4130… just below the 35-week EMA (in blue).
Quite often (not always) the 35-week EMA will act as a zone of resistance in bearish trends.
So far, things appear to be trading per the script.
Thanks to some (arguably) dovish tones from the Fed – and better than feared Q2 earnings – stocks regained some of their 2021 mojo.

July 29 2022
But do you start popping the champagne corks?
Not me… not yet.
From mine, there are two important questions that are yet to be answered:
- Can the market exceed 4200 and sustain that high; and second
- Will the next retracement (which isn’t far away) form a new higher low?
That’s what I’m looking for.
My thinking is if we cannot achieve both of these objectives – it’s probable this is another “15% – 20%” bear market rally (e.g. not unlike what we saw during the 50% total retracements of 2000 and 2008 from peak to trough)
For clarity, I will be more than happy if the low is in for 2022 (especially given my ~65% long exposure)
And given I’ve been adding to ‘core’ positions the past couple of months (e.g. Amazon, Apple etc) – I will take it!
But you won’t see me celebrating the 14% rally just yet… despite my portfolio getting back into the ‘green zone’ year-to-date.
Why Tech Rallied?
Whilst the S&P 500 had a strong month – tech was on fire.
Quality names such as Apple, Microsoft, Google and Amazon all delivered Q2 results which were much better than feared.
What’s more, their guidance was robust.
And whilst no-one argues that growth has slowed – these companies are setting the bar with respect to how they are managing risk.
Consider Google – it still delivered double digit revenue growth from a meaningful base.
That’s impressive.
But these companies know that there will be ‘sunnier days ahead’ (there always is) – but for now they must work with deliberate focus and intent.
And that’s what they will do…
However, a big tailwind for tech (of late) has been the sharp reversal in bond yields.
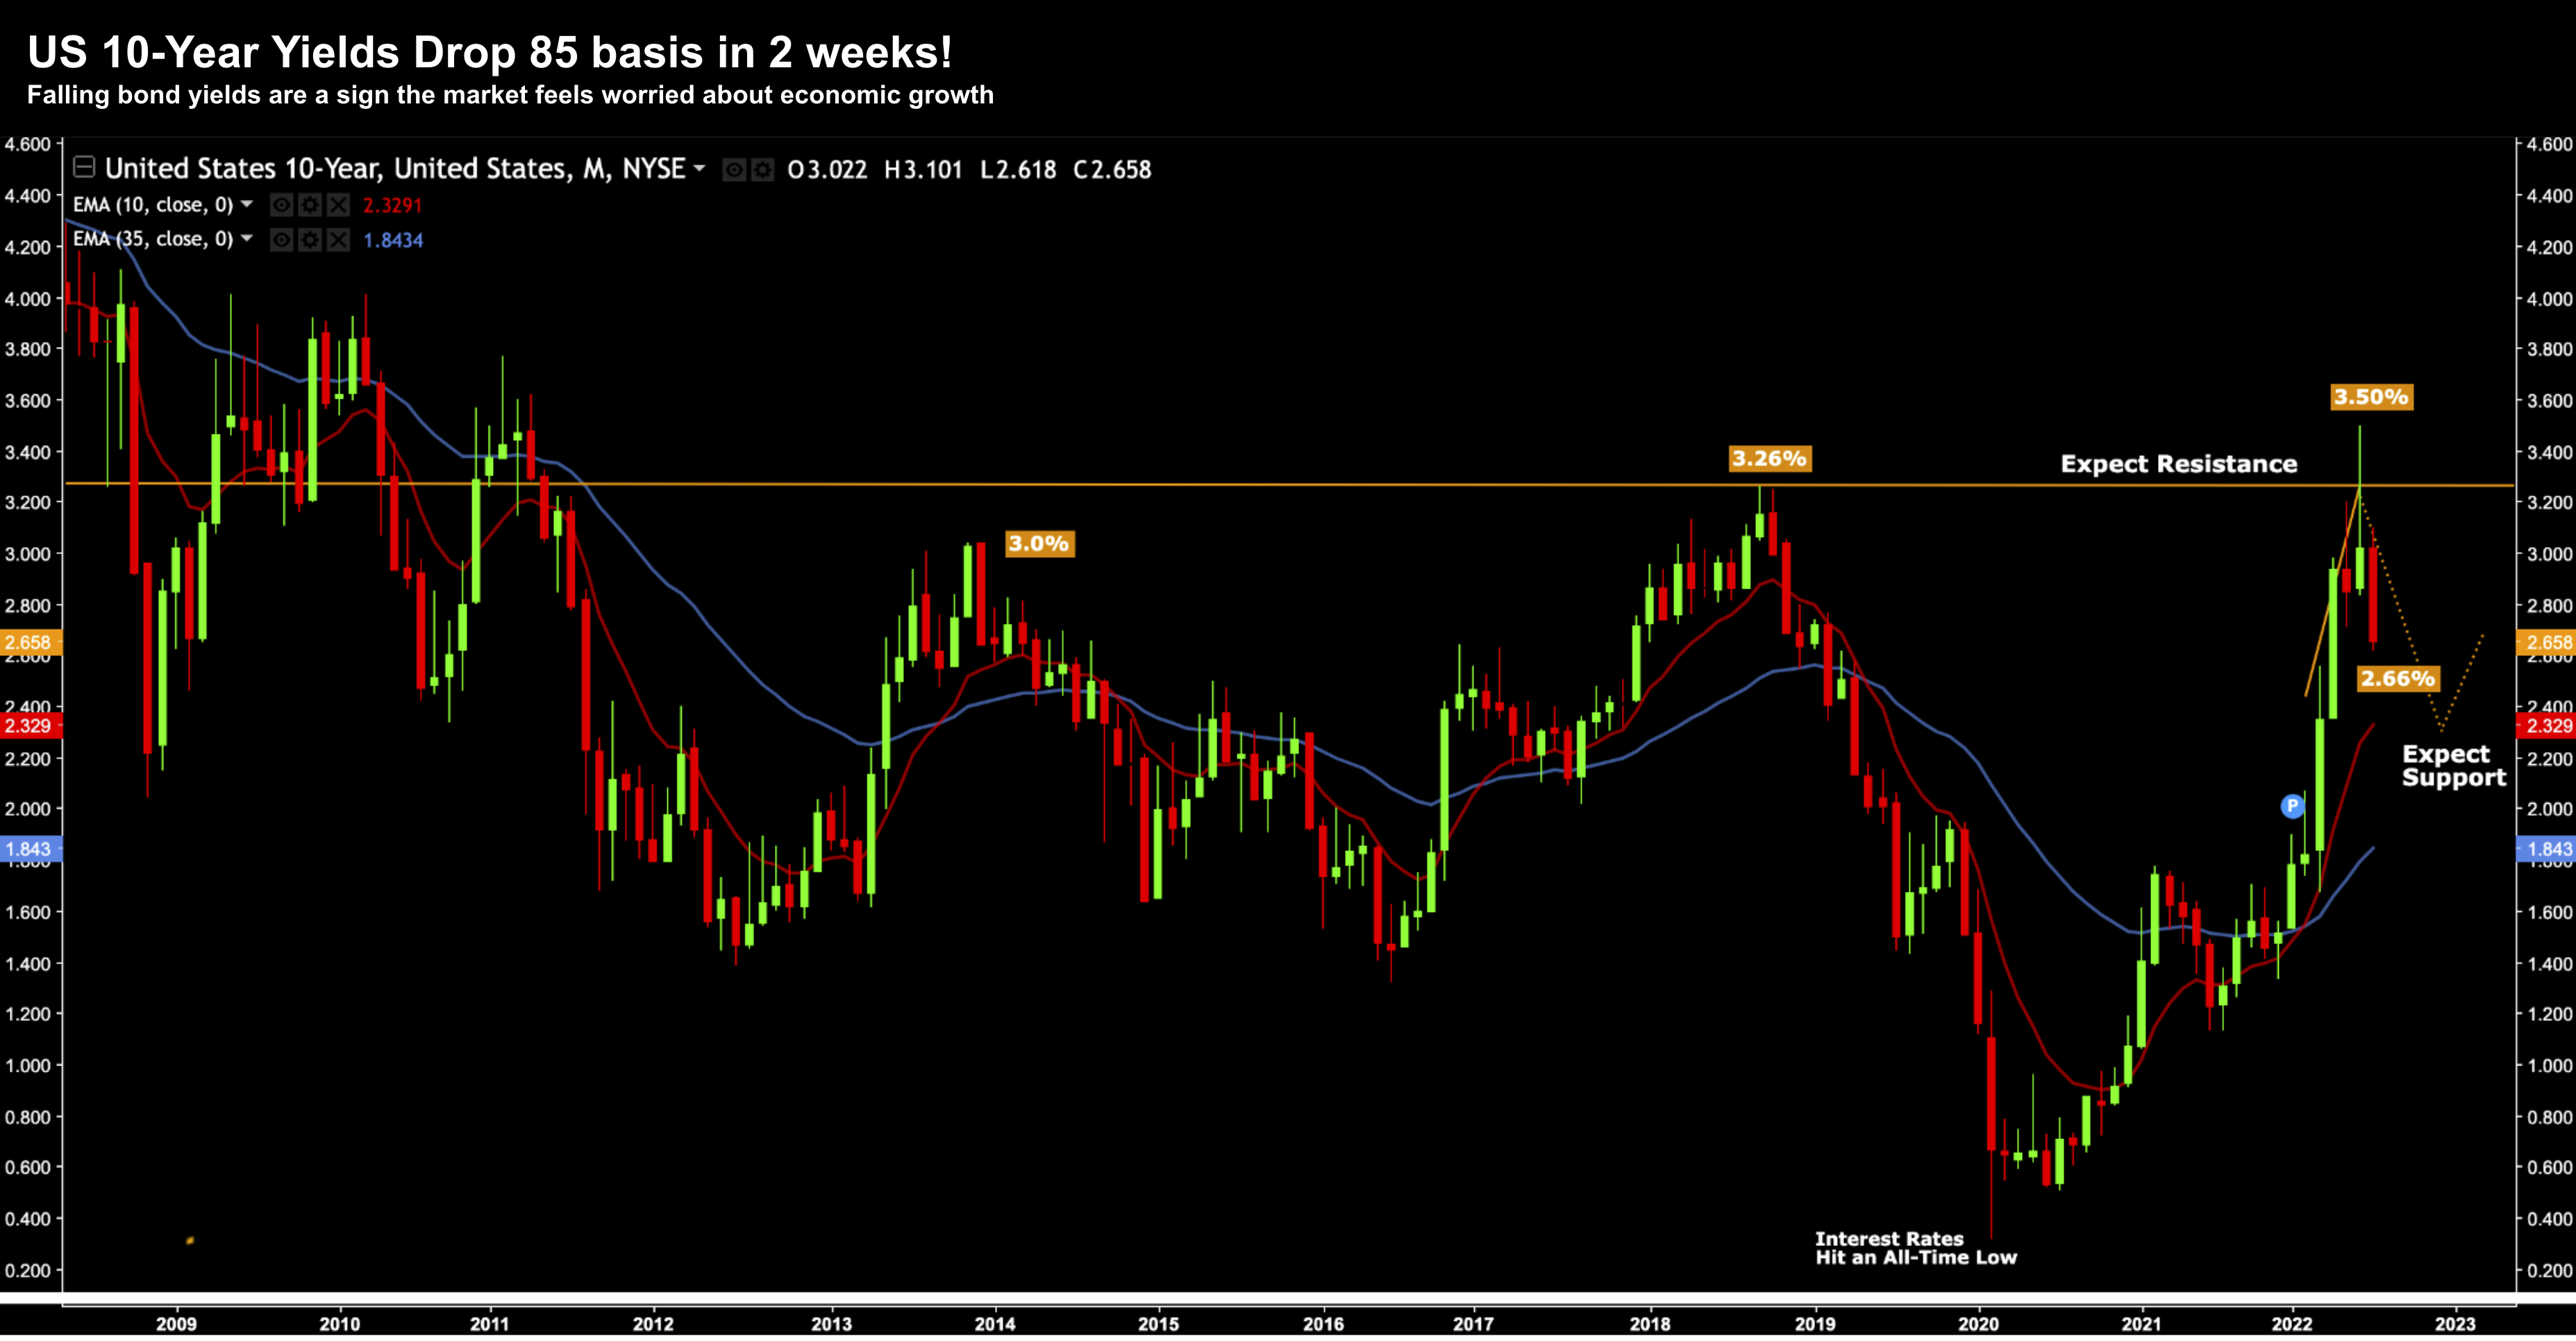
Take a look at the US 10-year – it has plunged a staggering 85 basis in just 2 weeks:
July 29 2022
My guess was the 10-year looked over-extended above 3.50% and I was looking for a reversal.
Turns out we made a “false break” of the 2018 highs (3.50%) – a strong reversal signal.
I’m now looking for these yields to trade as low as 2.20% in the coming weeks and months. And whilst that’s a bad sign for economic growth (and stocks more broadly) – lower yields are a boon for tech.
Why?
Because tech stocks are generally valued on their discounted cash flows.
And when you are discounting by a lower denominator (in this case — lower interest rates) – it makes for a higher valuation.
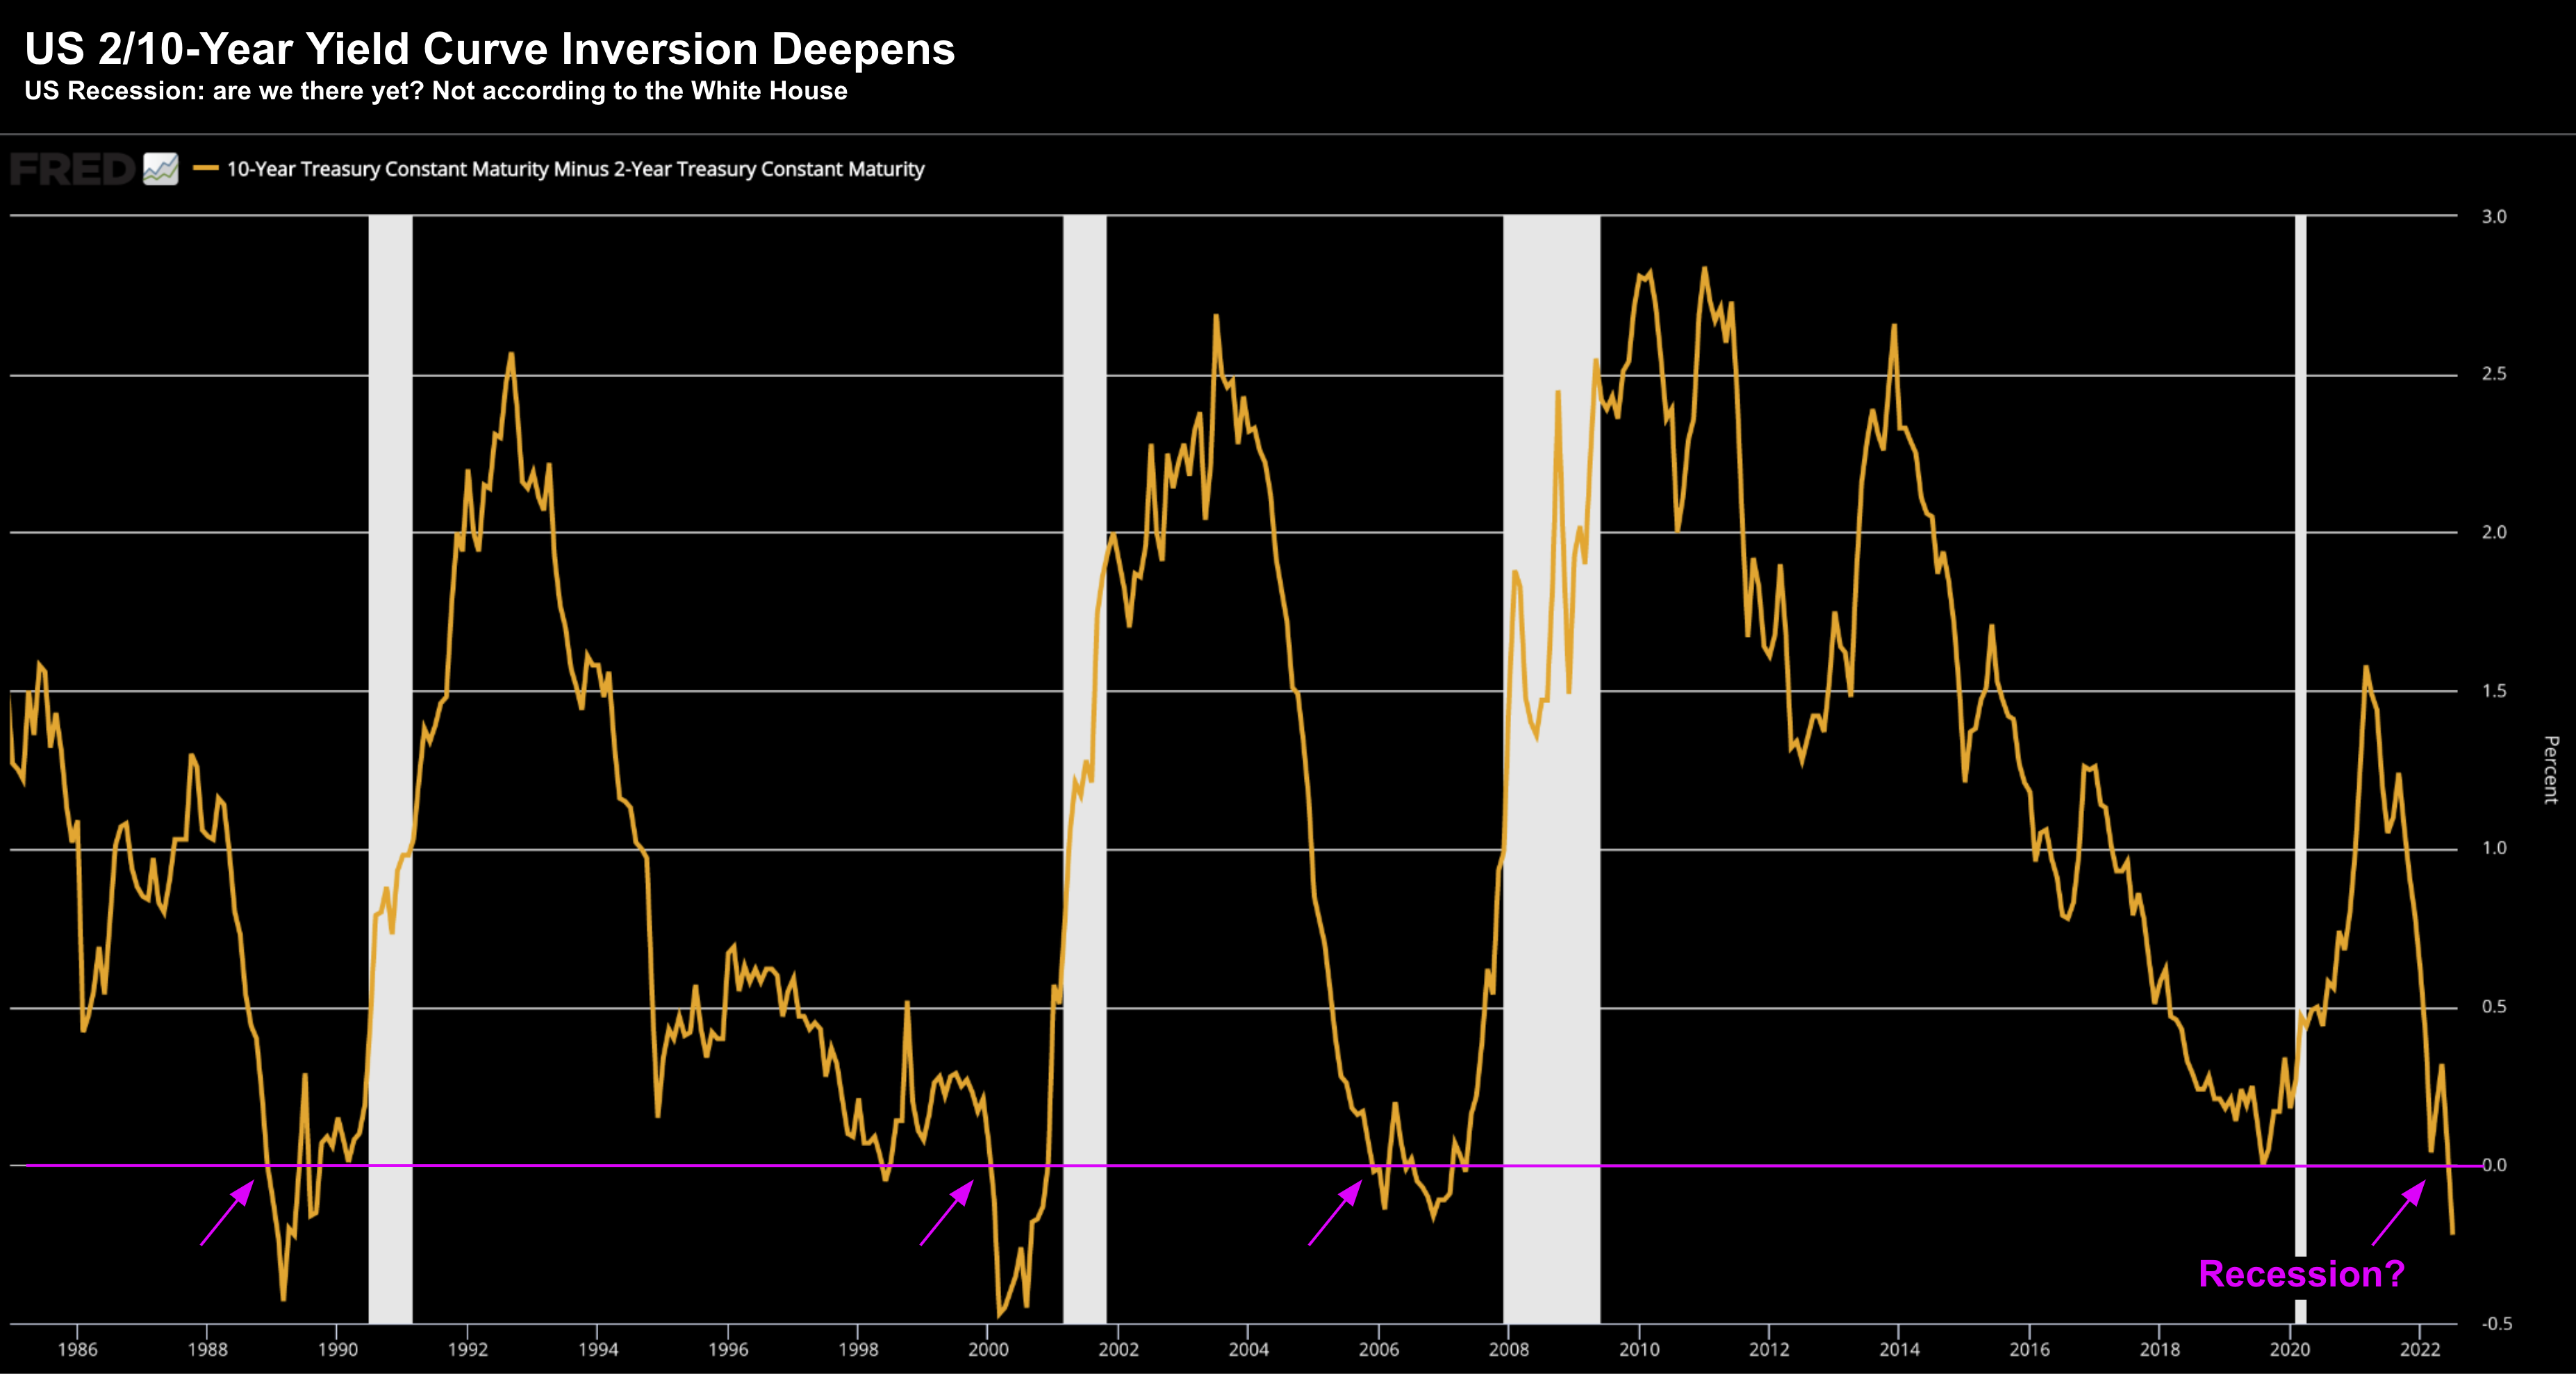
That said, take a look at the impact of the 2/10 yield curve – as it continues to trade well below zero
July 29 2022
We can debate what ‘officially’ defines a recession (it seems to be changing) – however you can’t refute that growth is contracting.
Here’s a snapshot from Bloomberg showing what we have seen with GDP from Q4 2020:
Here’s JP Morgan on the chart above:
“The economy is clearly losing momentum,” said Michael Feroli, chief US economist at JPMorgan Chase.
“All the interest-sensitive categories of final demand — housing, consumer durables, and business spending on equipment and structures — contracted last quarter.”
It’s pretty straight forward – households and many companies are succumbing to the weight of elevated inflation and rising interest rates.
Period.
As an aside, look how wrong central banks were with inflation:
Question:
When you dump trillions in new money into the economy opposite no increase in output or goods – how do you not get inflation?
For inflation to materially ease in the near-term – we need to see three primary things:
- Oil trading below US$70 for a sustained period;
- Rents falling; and
- Wages falling.
#2 and #3 could be 12+ months away… with rents trailing home prices by around 18 months.
Home prices are only just starting to ease… still up a good 20% YoY
From mine, it’s unlikely we will get any of these before the end of the year.
But that’s what we will need to see a 6-handle on CPI by year’s end.. with the biggest factor oil.
Moving on…
Meta: Value Trap or Opportunity?
Yesterday I explained why Apple, Amazon, Microsoft and Google constitute my Top 4 core holdings.
Based on how I assess a company’s financial health – they are among the highest quality of any business in the world.
But what is not part of my core holding is Meta (aka Facebook).
I do have a smaller position in the stock (which I established recently) – but I view it as more speculative play.
In other words, I am divided on whether this bet works out.
It may not.
But let me first recap their latest earnings result and why I think there might be value…
- Earnings: $2.46 per share vs. $2.59 per share expected
- Revenue: $28.82 billion vs. $28.94 billion expected
- Daily Active Users (DAUs): 1.97 billion vs 1.96 billion expected
- Monthly Active Users (MAUs): 2.93 vs 2.94 billion expected
- Average Revenue per User (ARPU): $9.82 vs. $9.83 expected (a decline of 14%)
September last year Meta traded at $383 per share giving it a market cap above $1 Trillion.
Fast forward less than 12 months – and the stock is some 60% off its highs – and a long way from being a considered a ‘growth‘ stock.
Its market cap has sunk to just ~$450B.
Train wreck.
Headwinds such as (but not limited to) Apple’s iOS privacy changes; increased government regulation; ad-spend slowdown; and of course intense competition from its primary social rival – TikTok – have all negatively impacted the stock and its revenue.
And throw in the “Facebook brand tax” (hence its rebranding to Meta) – it’s a mess.
So why would anyone buy it?
Well for one reason… it’s cheap.
But Cheap Can Always Get Cheaper!
The one thing in this stock’s favor is its valuation.
For example, when the stock traded ~$200 there were various reports saying how ‘cheap the stock was’.
So what are they saying now it’s below $160?
Cheap got cheaper! And that’s not to say it can’t get cheaper again.
And this will all depend on (a) how much the company earns; and (b) grows.
At the end of the day – we value a business on the free cash it generates.
It’s not much more than that.
And with strong cash generation – the company may choose to:
- re-invest that cash to pursue greater growth (e.g., Amazon);
- pay the cash out in dividends (e.g., energy, banks, utilities, telcos);
- buy back its stock (e.g., Apple, Google, Microsoft, Meta); or
- acquire other stocks (e.g., Microsoft buying Activision Blizzard recently for $65B).
Now one the compelling reasons to own Meta is it still produces cash… and a ton of it.
For example, it commands a healthy $47B on its balance sheet.
But is it a value trap?
“Value Trap” or Actual Value?
I think it’s fair to ask that question of META given its declining rate of growth.
But let me explain why the stock is fundamentally cheap (based on the lower end of their guidance)
- Trades ~9x forward earnings (if you back out the cash and reduced expenses on “Metaverse” projects)
- Maintains $47B of cash on the balance sheet (up from $41B last quarter)
- MAUs and DAUs are not falling – where DAUs are slightly up
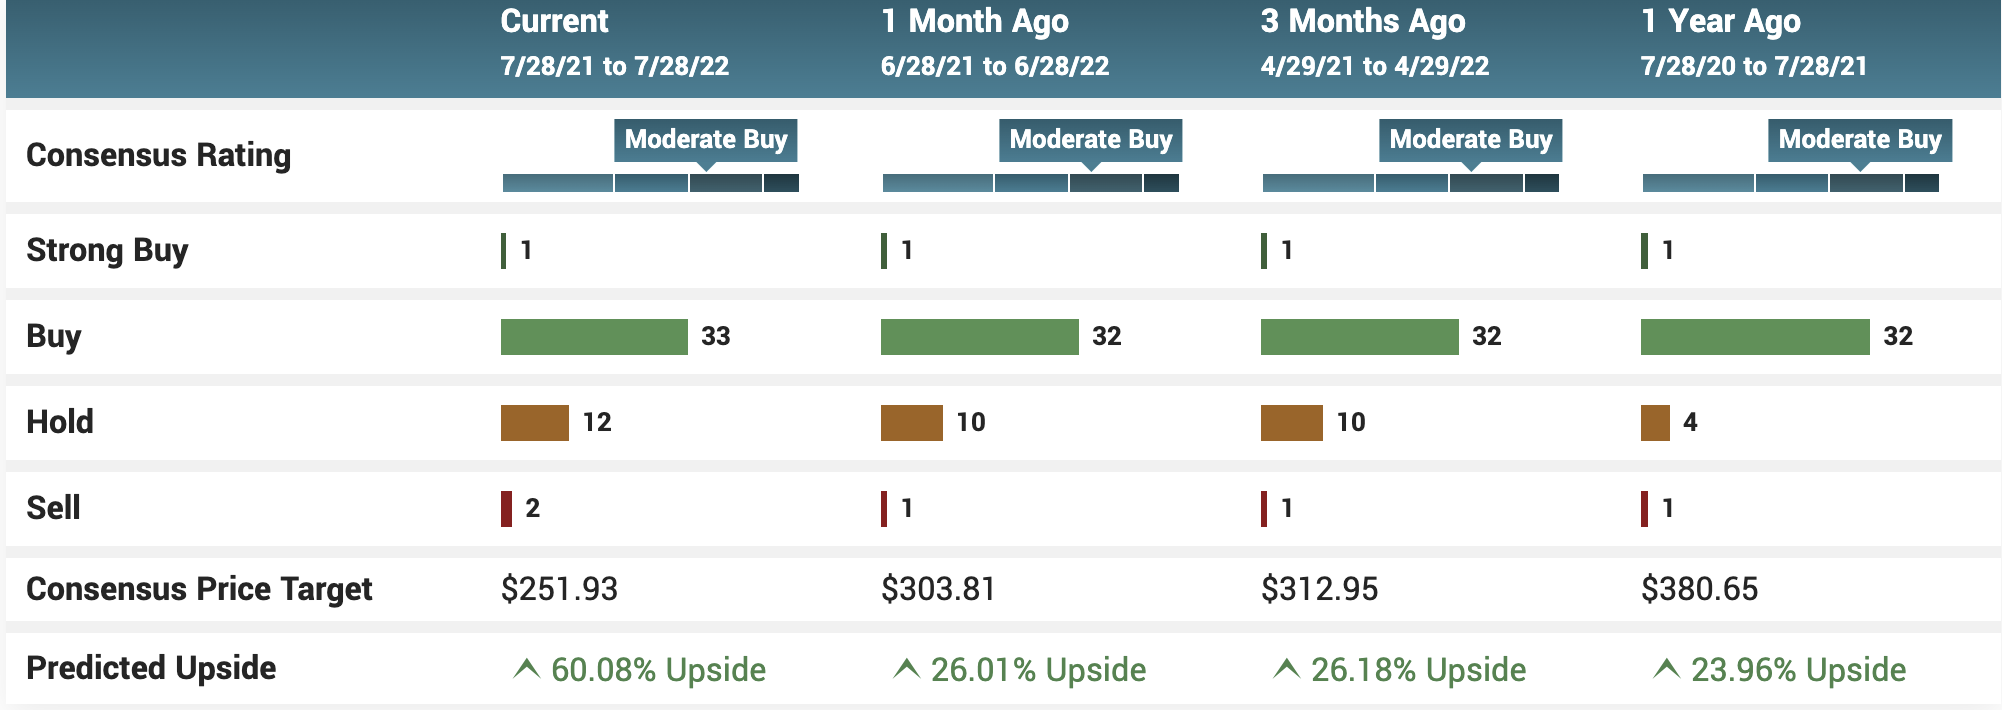
When I look at 47 analysts who cover the stock – most rate it as a buy (however price targets have come down)
What’s interesting is there are still 34x buys (70%); 12x holds; and just 2x sells – with a consensus target of $251.93 (implying ~60% upside)
KeyBanc has set a target of $196 per share (upside of ~26%) – with an overweight rating citing growth in DAUs; engagement with Reels and disciplined opex.
KeyBanc Capital Markets analyst Justin Patterson reiterated an Overweight rating on Meta shares and upped the price target from $190 to $196.
The Meta Thesis: Meta’s daily average users (DAUs) came in at 1.97 billion, slightly exceeding the 1.96 billion consensus estimate, Patterson noted. Reels showed strong engagement, with revenue surpassing the $1 billion run-rate, the analyst said.
Another positive takeaway is the operating expenditure discipline implied by the guidance, Patterson said. The company lowered its 2022 opex guidance from $87 billion-$92 billion to $85 billion-$88 billion, the analyst noted/ “We believe the opex guidance reduction demonstrates that Meta is willing to adjust spend to preserve profitability, and may also signal more modest investment in 2023E-2024E,” Patterson said.
So far Reels engagement is strong – boasting a $1B run rate.
But when I look at the weekly chart – it has a mountain to climb and warns of further downside.
July 29 2022
The bullish weekly trend ended for Meta earlier this year around $320.
Since then, the 10-week EMA (red) has acted like a “rail of resistance”
What’s more, our long-term trend line – formed by a series of lower lows – was recently broken.
I think we could easily see Meta trade down to the lows we saw late 2018... when its annual revenue was just $55B (less than half today)
However, based on the fundamentals outlined above, at this price the valuation feels just too cheap (and the risk/reward high)
As an aside, below is the revenue trend for Meta.
If this can turn around… the stock could easily rip straight back beyond $200 in very quick time.
Can Meta Continue to Grow Revenue?
Putting it All Together…
In closing, I think it pays to be wary of this rally.
And whilst it could still go further – I think we’re now getting close to the next pullback.
Question is will it make a “higher low”?
At a value of around 4200 on the S&P 500 – we are now getting back to the question of whether the upside reward handily outweighs the downside risks.
Remember:
The Fed is not done.
And to be honest – they have only just started raising rates (commencing in March!)
I heard a hawkish Fed this week – whilst most heard doves.
For example, today we received a hot Core PCE monthly number – which reversed May’s initial decline.
“Inflation continued to rise at a fast clip in June, according to the Federal Reserve’s preferred inflation metric.The core personal consumption expenditures price index, also known as the core PCE deflator, jumped by 0.6% in June, bringing the annual figure up to 4.8%, according to new data released by the Labor Department on Friday”
This doesn’t bode well for a rate pause… which the market is now pricing in.
Again, keep your eyes on oil, rents and wages. They hold the key to lower inflation (along with reduced money supply).
Let’s see how we go…


