Words: 1,095 Time: 5 Minutes
- US consumer continues to drive the train
- Quarterly Real PCE and Wages rise YoY
- Low probability of a sharp economic decline in the near-term
This week we received my preferred leading economic (and stock) indicator: real personal consumption expenditures (PCE)
As a preface to this missive – as a long-term investor – our job is to carefully assess the risks.
Part of that equation is knowing exactly where we are in the business cycle. For example:
- Do you think we’re at the beginning or middle of an economic advance (with more to go)?
- Are we about to encounter a significant change in direction?
- If so, is that change for the better or for the worse?
These are very important questions – because if we are taking more risk at the ‘wrong end’ of the cycle – it can be costly.
For example, let’s say you increased your exposure to stocks during 2006/07; or in 1999/00.
At the time, Real GDP was well above 2.0% and unemployment was very low.
Central banks also forecast solid 2.0%+ GDP growth for the foreseeable future – with very low recession risk.
And as investor – your portfolio and 401K had enjoyed stellar gains for last 5 years…
Why worry?
Now during this late stage in the cycle we also saw a negative change in quarterly real PCE of more than 2% YoY.
It was approx 6-9 months before this downward shift showed up in stocks.
If you increased your risk exposure at this point it proved very costly. You failed to see the pivot which was about to hit.
Chasing further gains came at the cost of taking on a lot of (subsequent) downside risk.
So what do we look at to understand if cyclical risks are increasing?
The best (and most reliable) indicator is changes in the long-term trend with real consumption (viewed on a quarterly basis).
It’s consumer spend which drives 70% of GDP.
From there, increased spend drives company profits. With greater profits – we get further business investment.
Increased business investment (capex) theoretically results in greater output – in turn leading to more hiring and so on.
But it all starts with the consumer.
💰 Q3 2024 Real PCE & Wage Trends
- The investor is better served by assessing the trend over a quarterly (3-month) period observing the change year-over-year; and
- The time series should be viewed over at least ten years
Datasets like (not limited to) PCE, GDP, inflation and employment are highly prone to shorter-term (monthly) noise – therefore subject to large revisions.
For example, monthly jobs were downgraded sharply for the prior two months this week – more on this shortly.
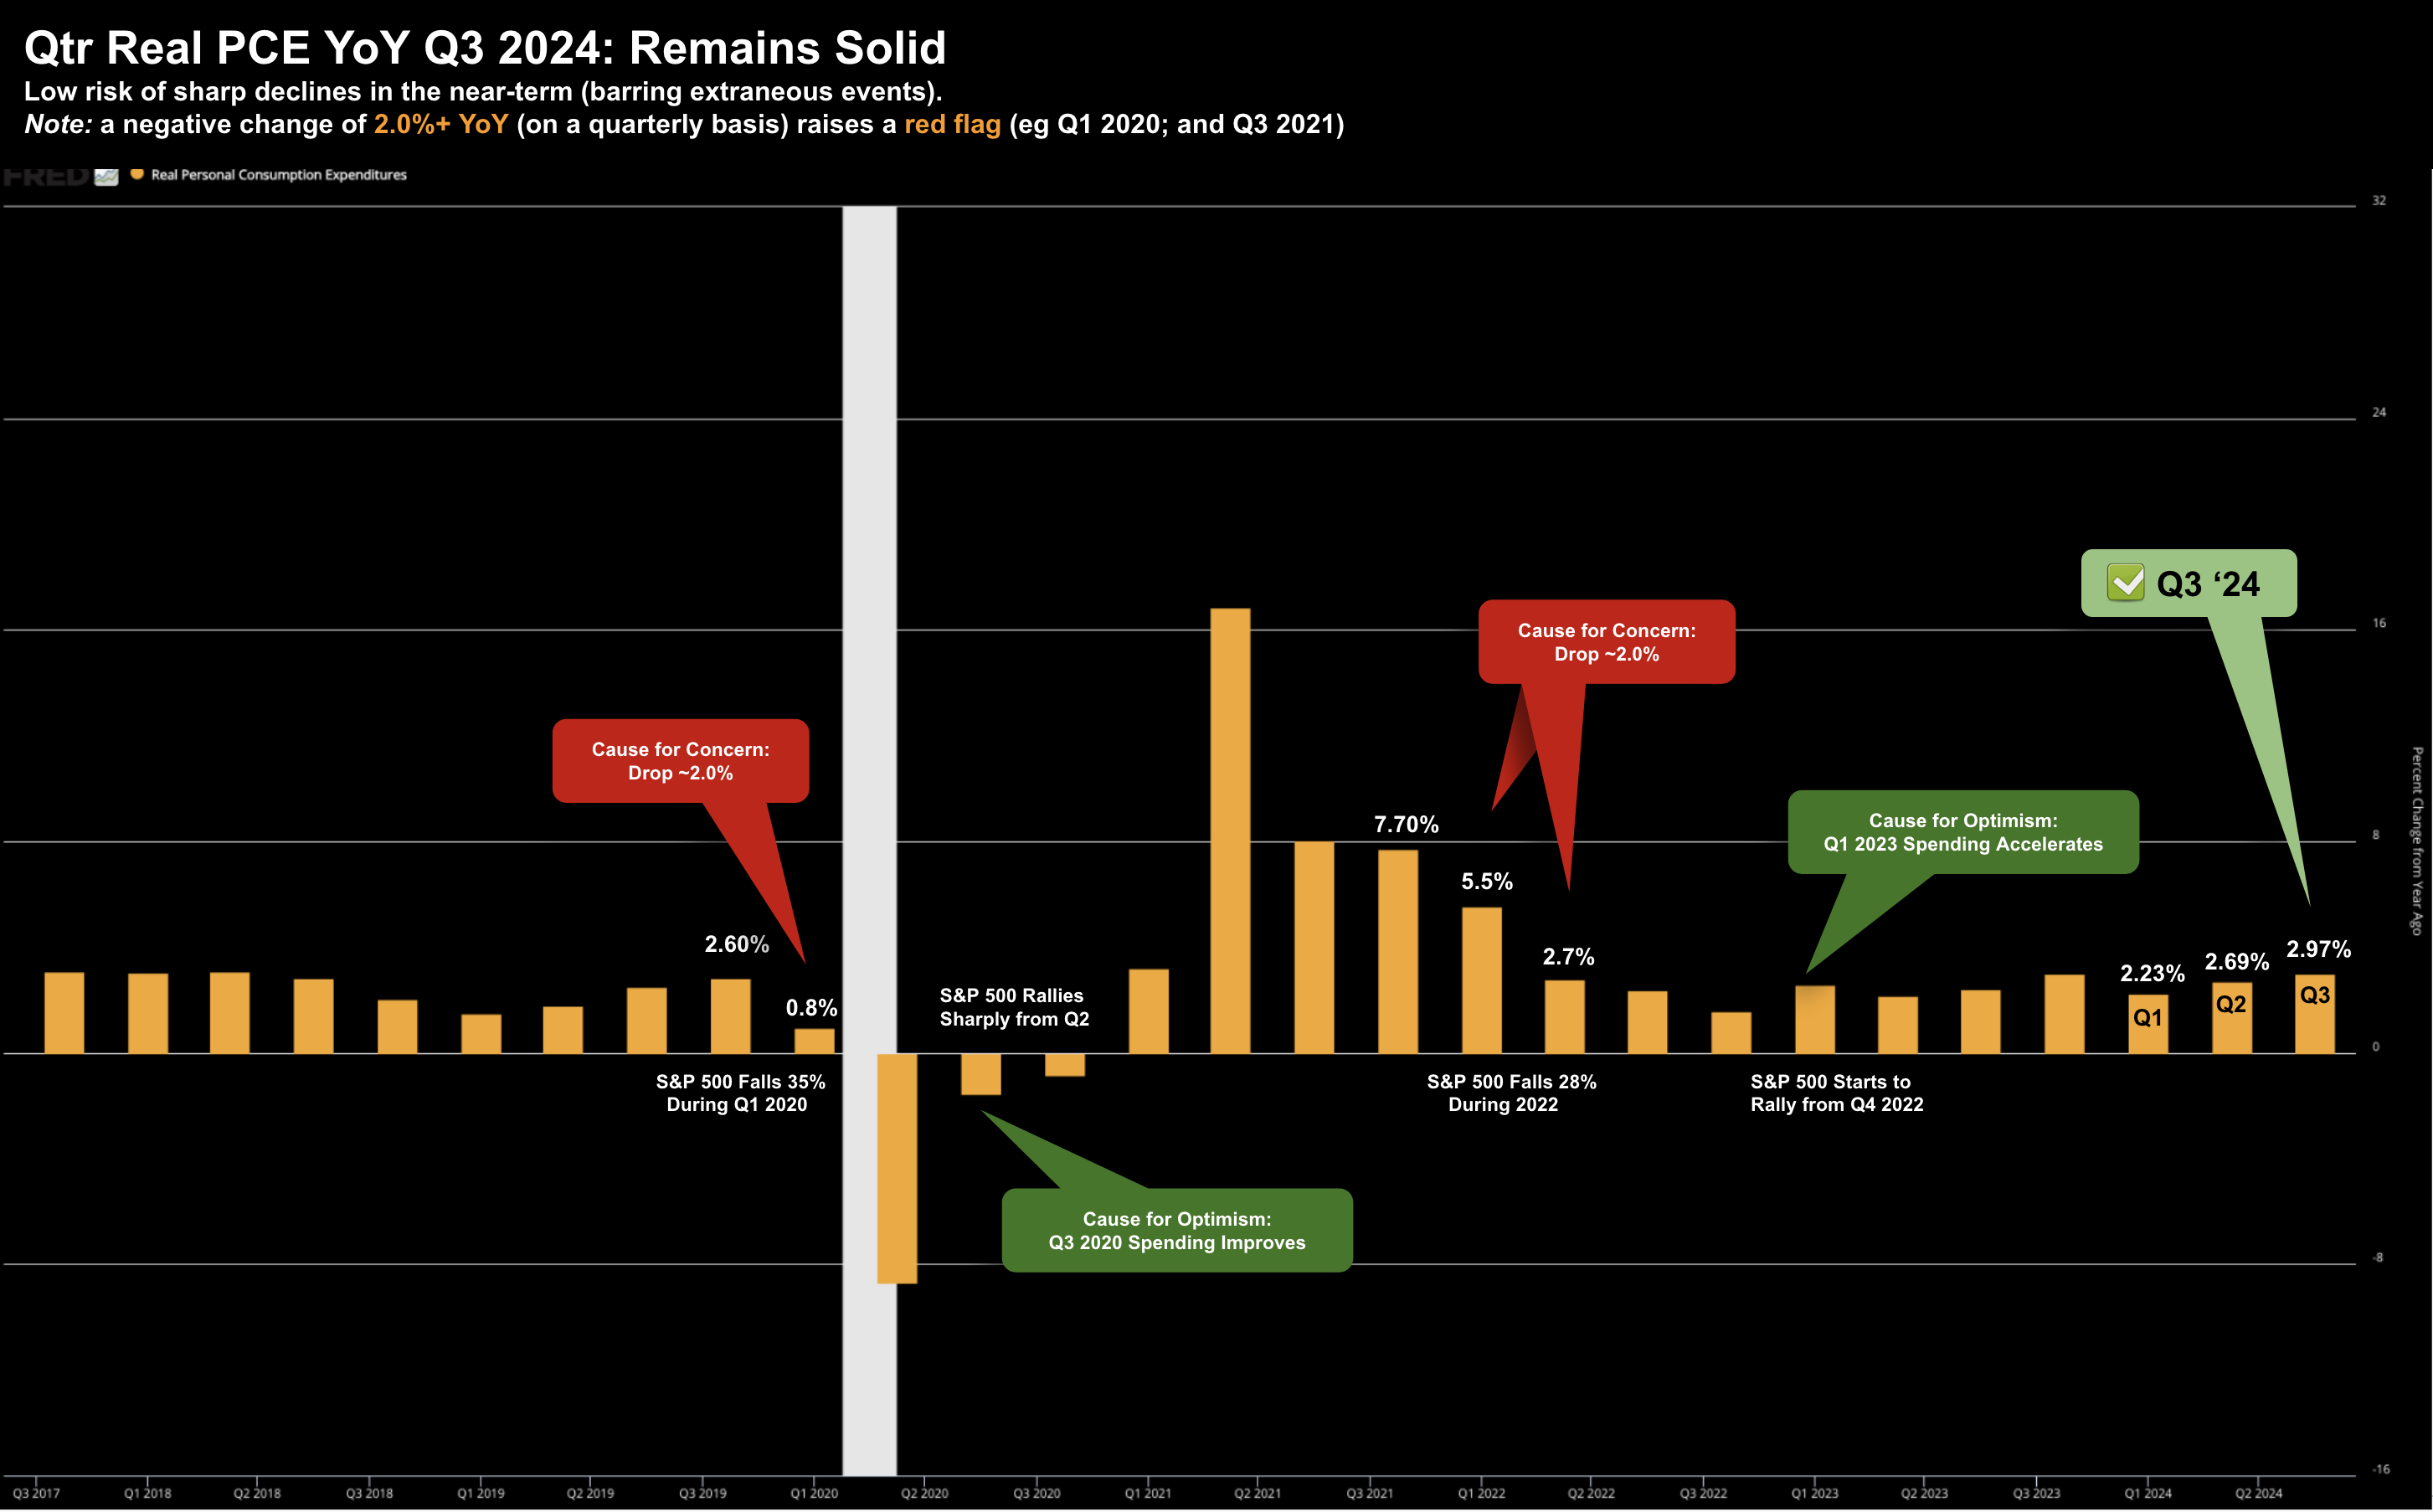
First, below is the long-term quarterly Real PCE trend – showing the percentage change on a year over year basis:
Source: Federal Reserve
Here you are able to see the most recent ‘pivot points‘ with Real PCE (and the resultant impact on markets – highlighted in red and green).
For the quarter just passed (Q3) – Real PCE was up 2.97% YoY – showing an improvement of 0.18% on the previous quarter.
This is good news and suggests the probabilities of a sharp downward shift in the economy is less likely in the near-term.
For the most part, people are employed (with unemployment at 4.1%) and they’re spending.
For example, we also learned this week wages grew 4.0% in nominal terms.
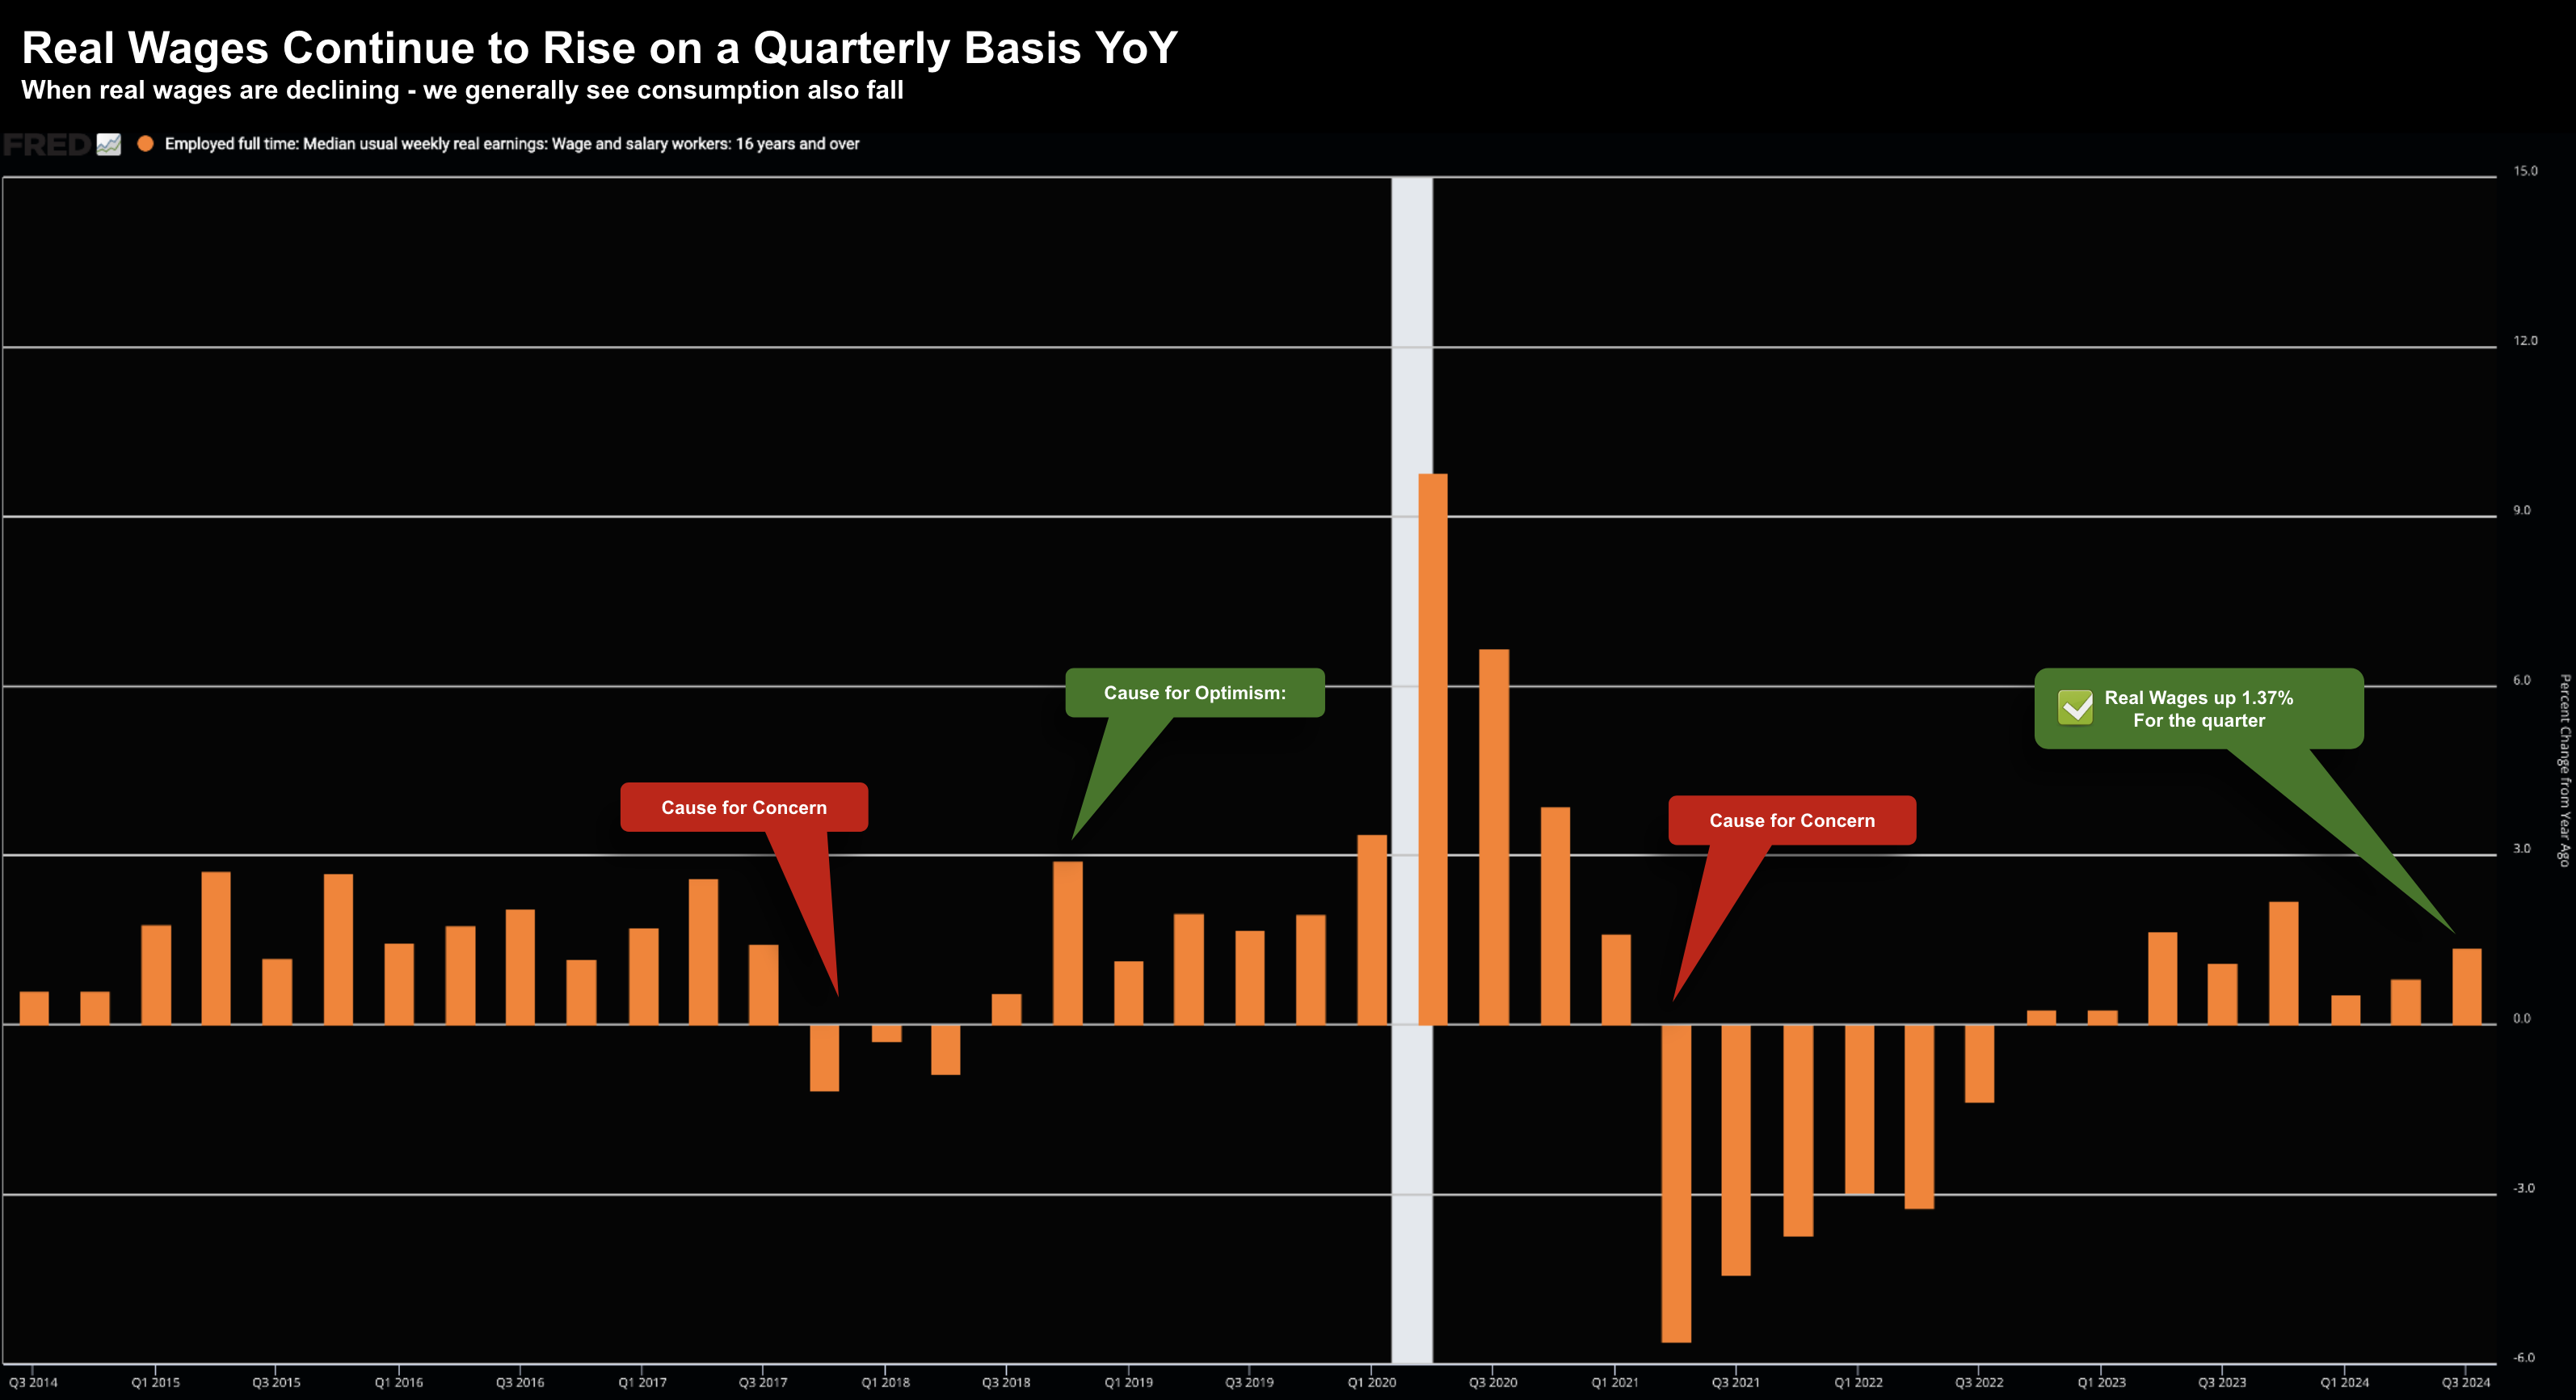
When adjusted for inflation (i.e., real wages) and viewed over a quarterly timeframe – the trend remains positive:
Put together, from my lens the economy remains in solid shape.
It’s not falling off a cliff….
However, there are underlying trends within employment that deserve close attention
👷♀️ Employment Trends
If you want to find a signal from the noise with employment trends – I recommend you read Mike Shedlock’s “Mish” blog
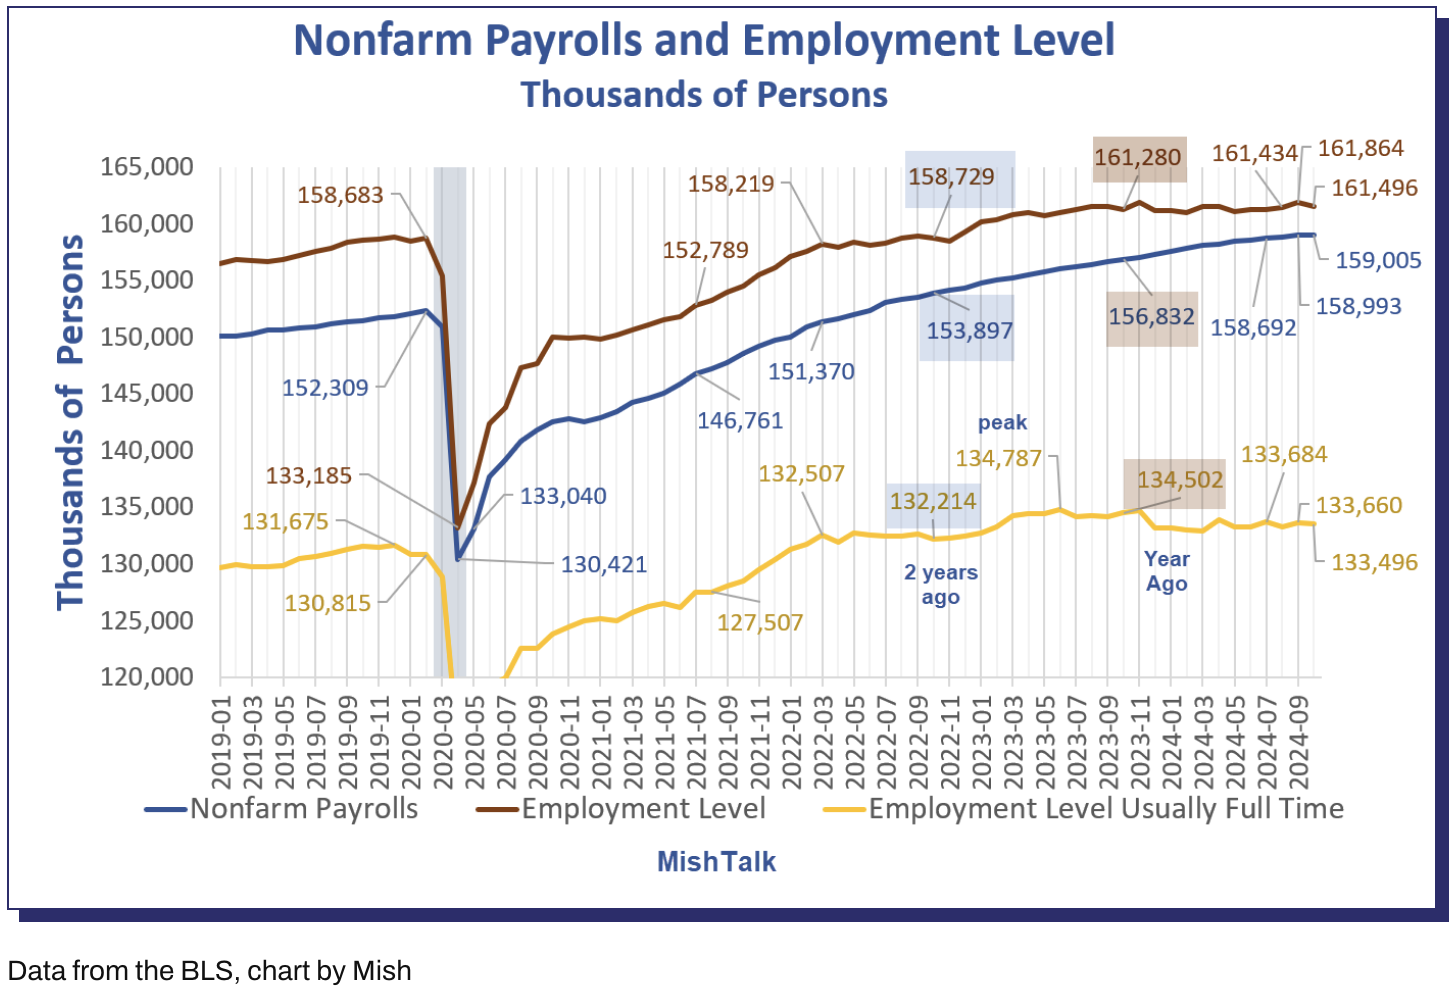
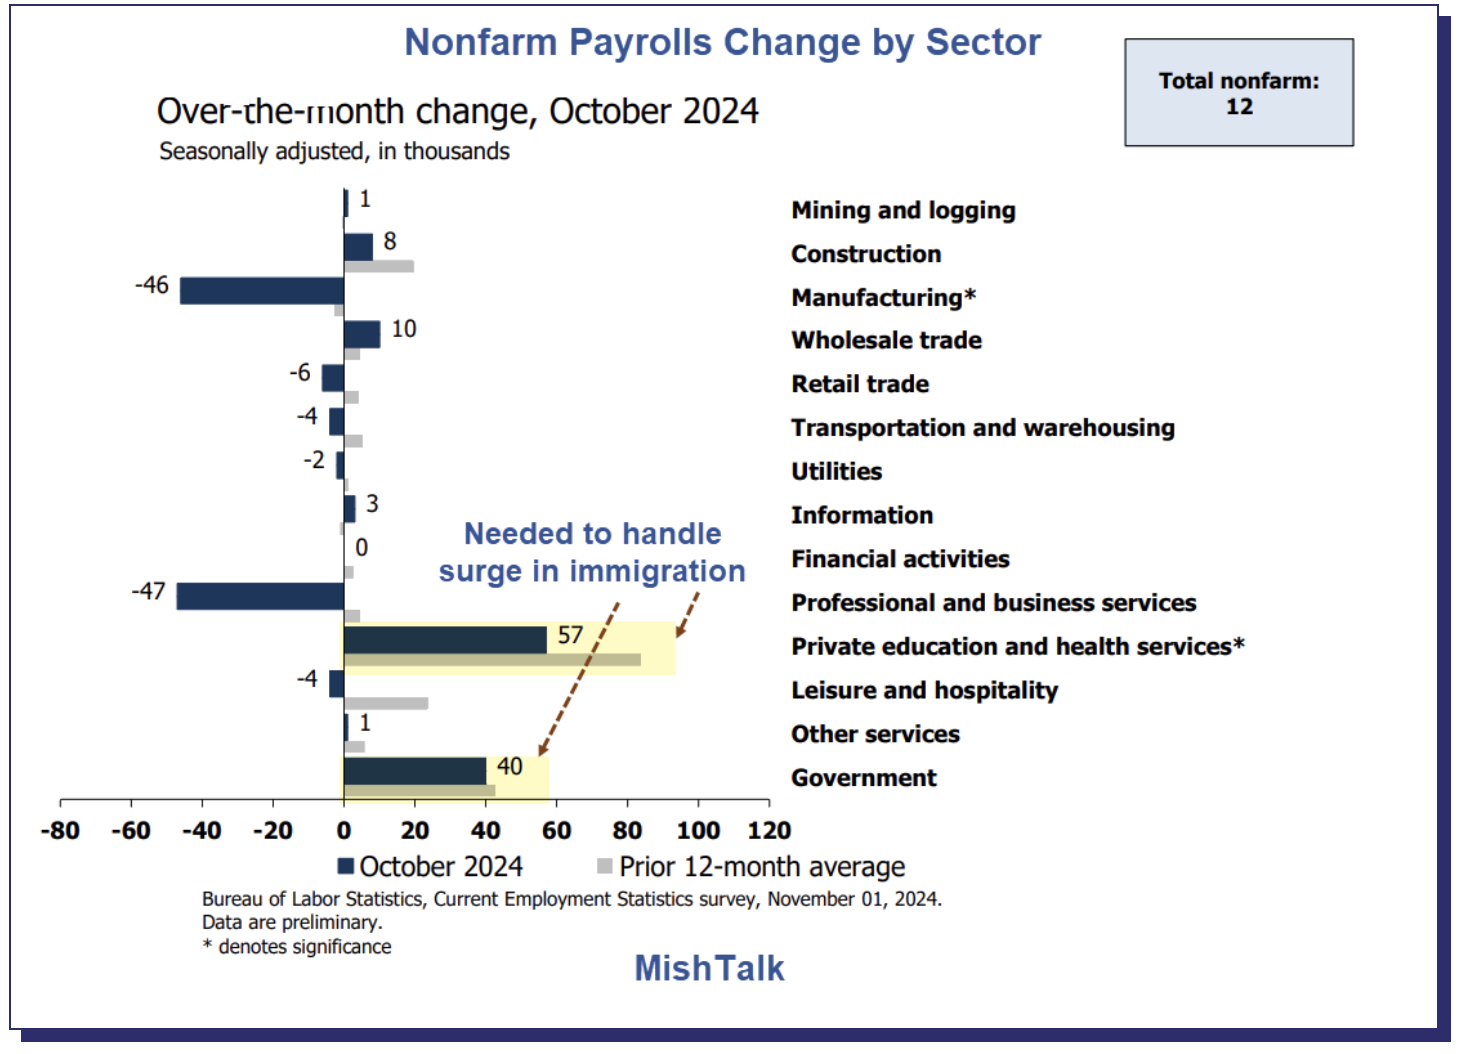
- Nonfarm Payroll Increase: +12,000 to a total of 159.1 million jobs, showing minimal job growth in October, with significant sector-specific declines.
- Full-Time Employment Decline: -1,000,600 over the past year, signaling a substantial decrease in full-time positions despite the increase in overall nonfarm payrolls.
- Unemployment Rate: Steady at 4.1%, showing no change from the previous month, but this rate is higher than the 50-year low of 3.4% seen earlier in 2023.
- Part-Time Job Changes: Involuntary part-time work decreased by 67,000, while voluntary part-time work dropped by 214,000, highlighting a shift in the labor market toward fewer part-time roles.
- Job revisions: 81,000 fewer jobs for August than initially reported (which is nothing to do with hurricanes or Boeing strikes)
- Wage Growth: Average hourly earnings for nonfarm workers rose by $0.13 to $35.46, a 4.0% increase from a year ago, slightly higher than inflation but not reflecting broader labor force challenges.
In summary, these figures collectively highlight minimal job growth and a decline in full-time employment.
However, the other (troubling) trend worth noting the outsized job additions from the public sector (40,000 jobs last month):
And whilst this report includes the 33,000 striking Boeing workers as part of the 46,000 job losses in Manufacturing – overall the job additions within the (tax paying) private sector are dwarfed by (tax consuming) public sector jobs.
According to Mish:
“October was a dismal. Some of it can be blamed on the Boeing strike and the hurricanes.
The negative 81,000 revision to August can’t be blamed on hurricanes. The household survey which sets the unemployment rate did not seem to be impacted by the hurricanes.
I remain highly skeptical of the glowing report last month (some of which has been revised away), and BLS monthly reports in general. The reports smack of oversampling large employers and under-sampling small employers where jobs have been trending lower.
Full time employment is down by more than a million from a year ago. Don’t pin that on hurricanes and do expect more negative revisions”
💥 What Matters for Investors
Never underestimate the U.S. consumer’s desire (or want) to spend.
This is a lesson I’ve come to appreciate over the past two decades… it’s relentless.
For example, despite consumer’s personal savings rate plunging to just 4.8% during the third quarter – they still find a way.
Who needs money for a rainy day? And when did a ~21% credit card rate be a deterrent?
Based on quarterly year-over-year Real PCE and real wage trends – consumers opened their wallets to buy cars, restaurant meals and vacations.
It’s a simple rule:
As long as people have a job and their wages are rising (in real terms) – that’s the basis for continued spending.
It’s the consumer which drives the “U.S. train” forward – comprising ~70% of GDP.
However, as I highlighted here – not all consumers are spending so freely.
Middle-to-lower income cohorts are increasingly looking for bargains.
They are the cohort hardest hit by inflation…. a poor man’s tax.
In closing, continue to separate the signal from noise by examining the longer term (quarterly) trends in real terms.
