- Say goodbye to three rate cuts for 2024 – as CPI rips higher
- Why small business is feeling the pain of ‘non-core’ inflation
- Another opportunity presents with the US 10-year yield
I’ll start with a quote:
I will come back to this snippet shortly…
But first the news which caught the markets attention – hotter than expected March CPI.
If you’re a regular reader of this blog – it would not be a surprise.
But it seems equities were caught off guard…
Given what we see with the energy, housing and food – it was hard to CPI falling.
All of these prices have been rising – with inflation remaining sticky.
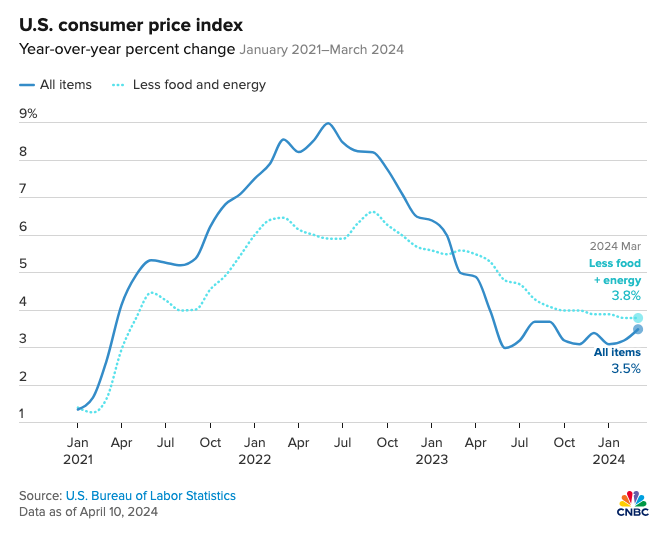
Here’s a recap from CNBC:
- Headline CPI rose 3.5% YoY in March – reaccelerating on last month;
- Shelter and energy costs drove the increase;
- Energy rose 1.1% MoM after increasing 2.3% in February
- Shelter costs jumped 0.4% MoM and up 5.7% YoY
Now Jay Powell told us recently that “two inflation prints doesn’t make a trend”.
Fair point. It doesn’t.
What about three? Or maybe four? When is it a trend?
Perhaps Powell’s next pivot could depend on what we see with Core PCE at the end of the month (which is expected to fall)
Repeating some comments I made February 2023:
“We can assume that inflation will gradually work its way lower. But it won’t be fast. Much of that is going to be a function of what we see in the labor market (which remains exceptionally tight). High inflation may come down only slowly. Bringing services inflation under control depends on a better balance in the labor supply and demand”
The good news is inflation is trending lower when measured over the past 12+ months.
As CNBC’s chart shows above – we are well off the highs from mid 2022.
However, that was the lower hanging fruit.
The hard work (and where it gets tough) is reducing inflation at the “core of the onion“
That’s proving to be far more difficult – as there is a strong labor component.
Getting inflation (headline and core) to 2.0% will mostly depend what we see with currently imbalance in the labor market and of course – shelter costs.
That’s going to take time…
Will the Fed Cut at All This Year?
Ahead of today’s print… I posed the question “How About Zero Rate Cuts for 2024?”
Personally I found it hard to make the case for rate cuts.
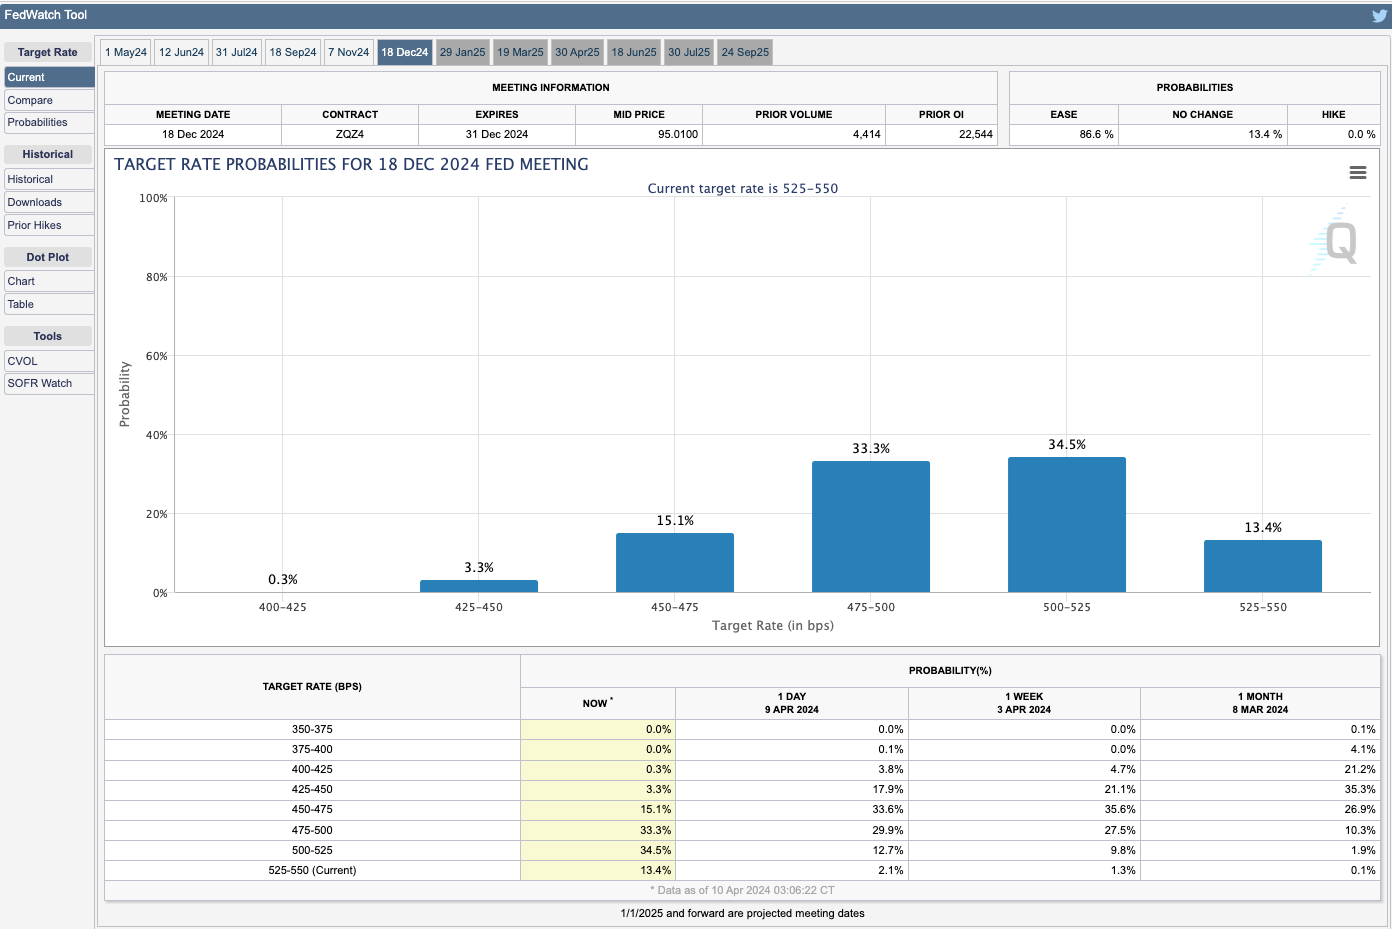
But that was at odds with the market – which up until today – was pricing in three rate cuts this year.
As it turns out – those expectations have shifted meaningfully.
For example, the market now sees no rate cuts in June.
What’s more, the odds for no rate cut this year increased from 2% (which I said was far too low) to 13% today.
However, I still feel equities are yet to come to terms with rates being a lot higher for longer.
Bond markets have been quicker to join the dots… with the 10-year surging (more on this in my conclusion)
Fixed income investors are typically early… but usually right.
With that, let’s get back to the small business snippet I shared earlier… I think it’s largely overlooked.
Small Business Optimism Falls
Whilst mainstream will typically focus on earnings (and sentiment) from ‘the big end of town’ – almost half of the US workforce is small business.
What’s more, small business also constitutes about 40% of all payrolls
Some other facts:
- Small businesses employ 61.7 million Americans, totaling 46.4% of private sector employees.
- From 1995 to 2021, small businesses created 17.3 million net new jobs, accounting for 62.7% of net jobs created since 1995.
- Small businesses pay 39.4% of private sector payroll.
- Small businesses generate 32.6% of known export value.
Small business is the “engine room” of the US economy.
Without them – there is no economy.
Large companies all depend heavily on a thriving ecosystem of business (large and small)
As a result, how small businesses feel about hiring, advertising, investing etc is critical to the economy’s ongoing growth.
The National Federation of Independent Business performs a very useful survey every month.
Not surprisingly it has a very good track record as a leading economic indicator.
But here’s why I think this makes sense…
Above all else, small business have their own skin in the game.
Unlike say the public sector, they risk their own capital (and livelihood) when it comes to starting and running their own business.
They take on the risk to hire people and support their ideas or passions.
They can’t simply “tax people more money” if they squander or waste resources.
They don’t have that luxury.
And they don’t have the financial flexibility of “billions in the bank” if things go wrong.
Most use debt to help with cash flow.
As such, their optimism (or lack of) is pivotal to where the economy is headed. If they are optimistic – they will hire and invest.
The opposite also holds true.
At the time of writing – small business has not felt this bad about the outlook for the economy since December 2012.
The March report tells us:
- The NFIB Small Business Optimism Index decreased by 0.9 of a point in March to 88.5, the lowest level since December 2012.
- This is the 27th consecutive month below the 50-year average of 98.
- The net percent of owners who expect real sales to be higher decreased eight points from February to a net negative 18% (seasonally adjusted).
- Twenty-five percent of owners reported that inflation was their single most important problem in operating their business (higher input and labor costs), up two points from February.
- Owners’ plans to fill open positions continue to slow, with a seasonally adjusted net 11% planning to create new jobs in the next three months, down one point from February and the lowest level since May 2020.
- Seasonally adjusted, a net 38% reported raising compensation, up three points from February’s lowest reading since May 2021.

Pessimism has not been this bad in a long time.
It wasn’t this bad during the Gulf War, the dot-com bubble collapse, or even the during the pandemic.
Now we did see a large spike higher in optimism from 2016 through to 2020.
Business sentiment was the highest on record over these four years.
However, from 2020 through to today, sentiment has continued to drop (despite the so-called “strength” in the economy)
Why?
Small business say their single biggest concern is inflation – citing higher input and labor costs.
It’s not surprising.
We see real-estate costs rising; food prices going up; energy costs rising; and labor costs going up.
None of these expenses are discretionary.
But they are real.
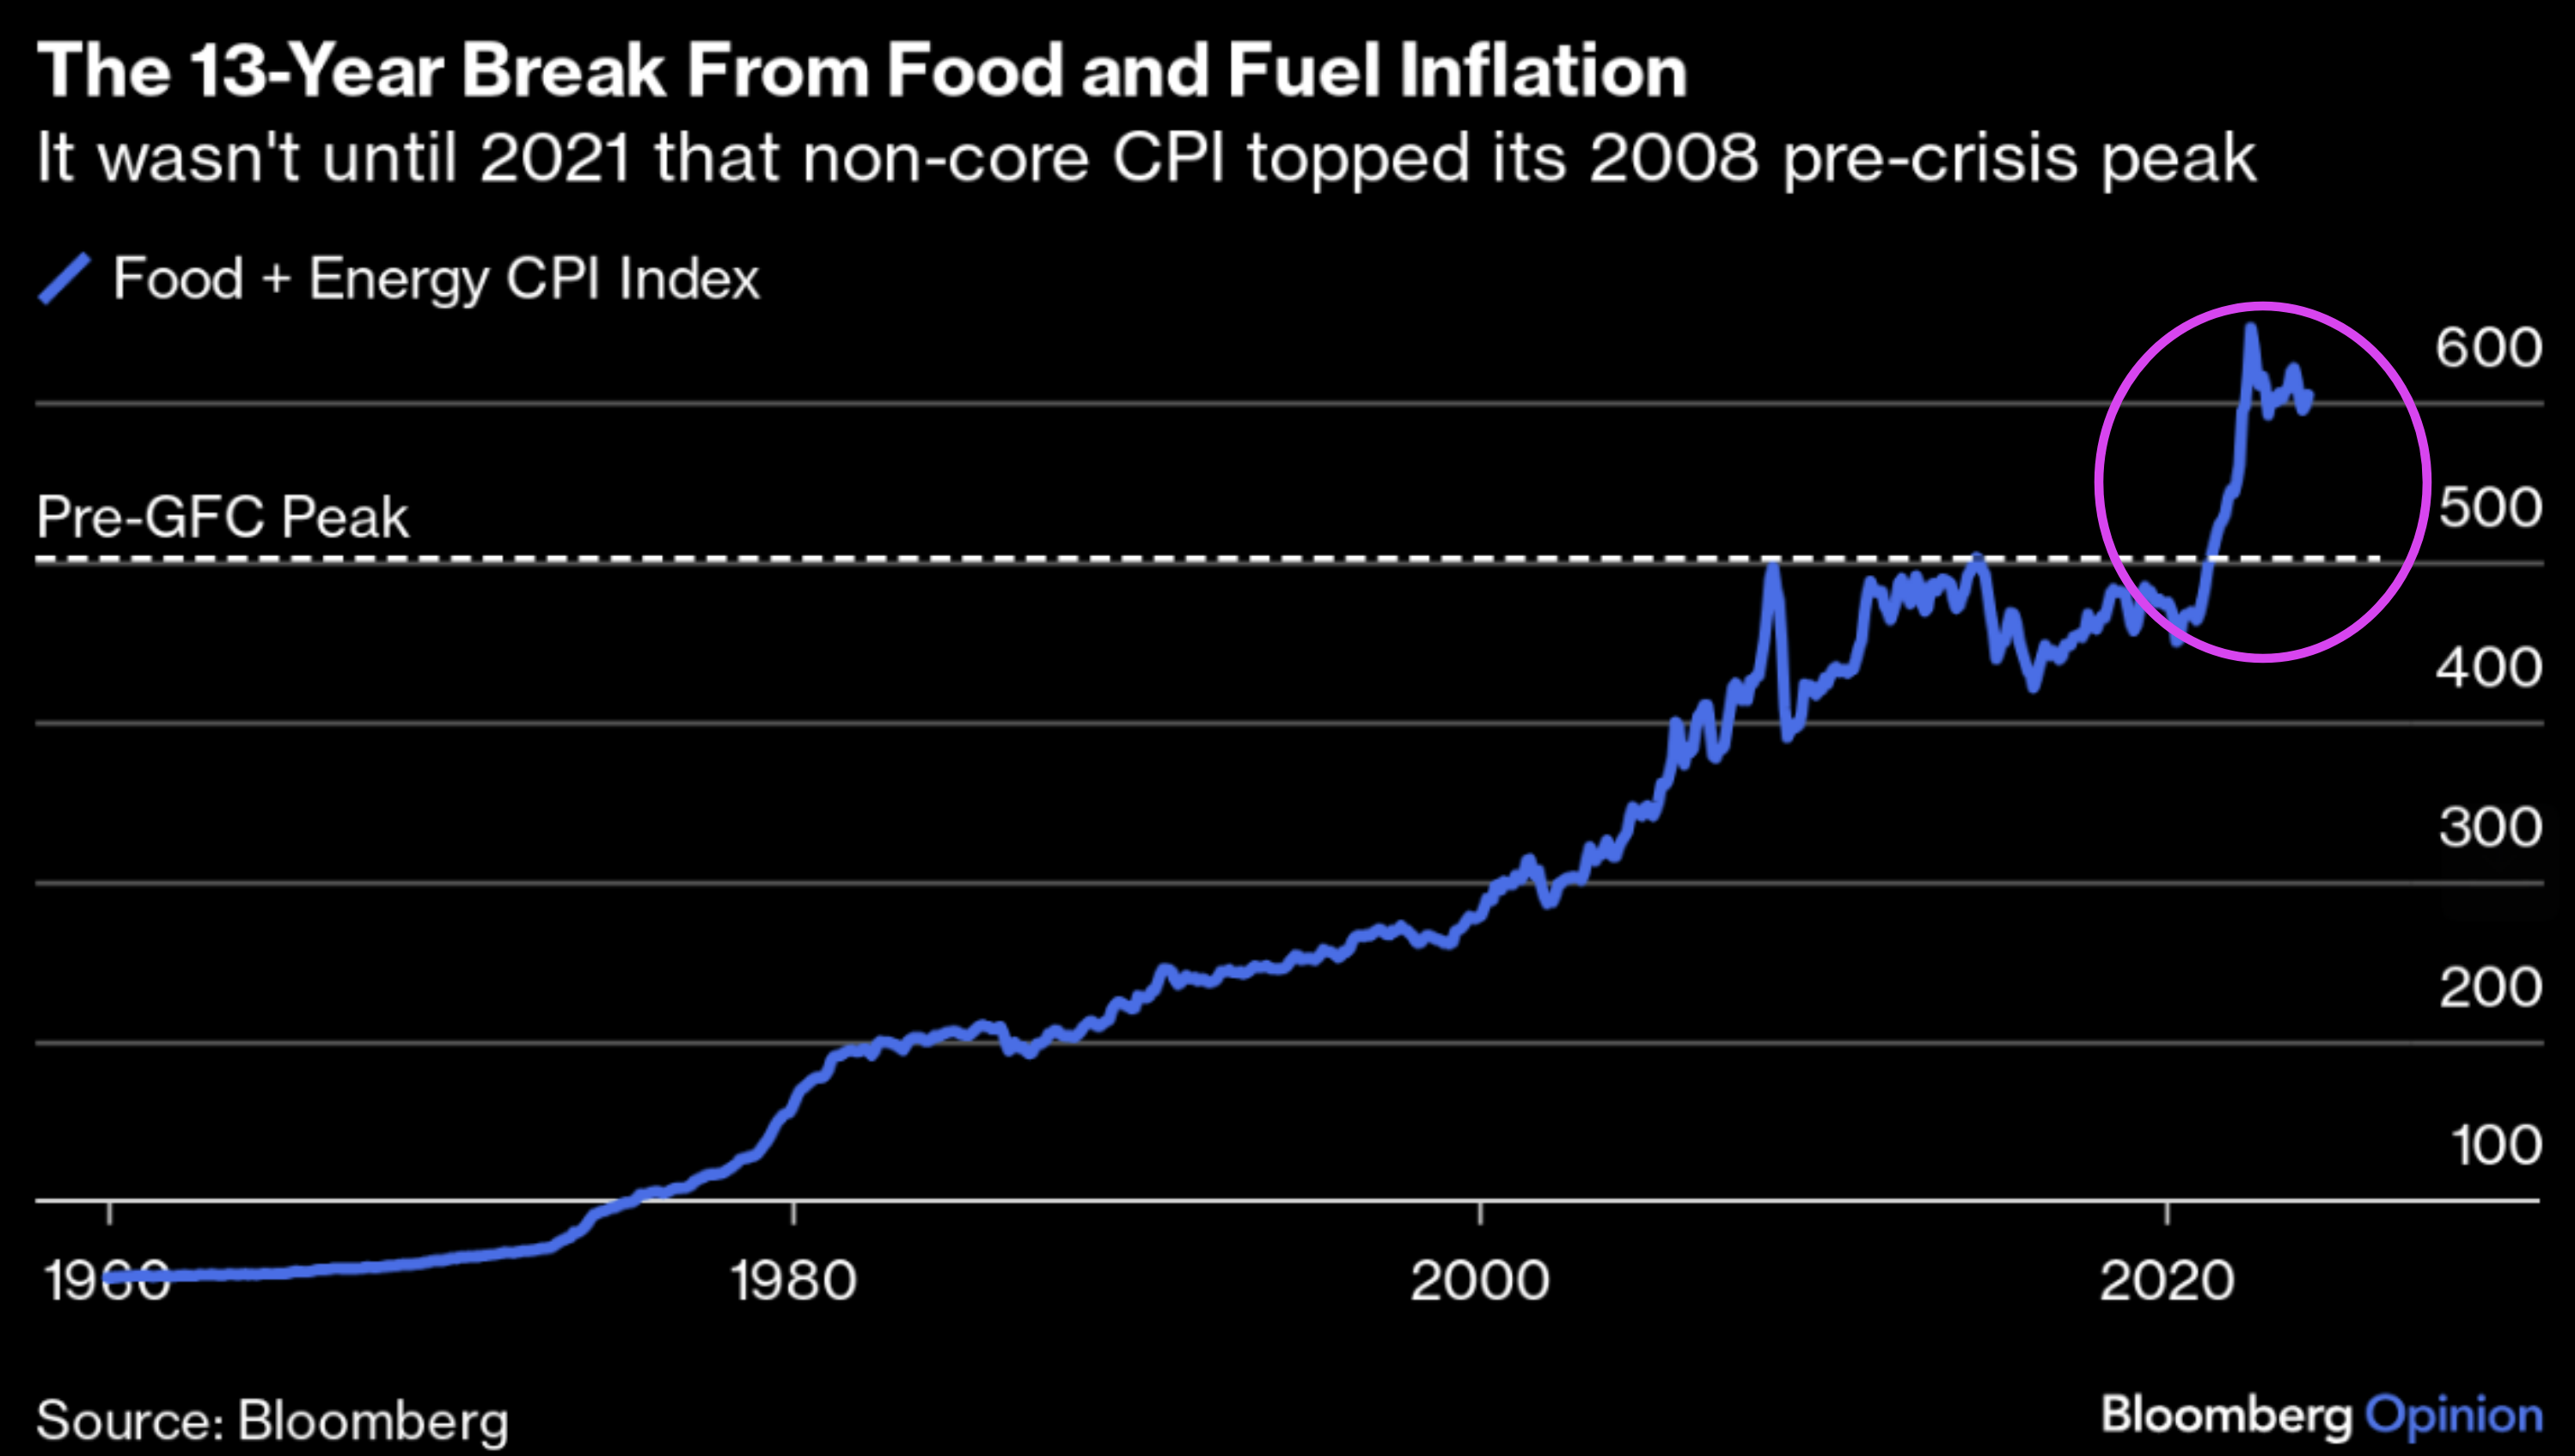
Now as we know, The Bureau of Labor Statistics doesn’t publish a measure for all “real costs” (like just food and energy)
However, they have indexes for both categories stretching back to the late 1950s.
From Bloomberg:
In January 1960, energy stood at 22.4 and food at 29.5. By the end of February this year, energy (327.7) had overtaken food (276.3).
Below is how year-on-year inflation of this measure has moved since 1961.
It’s been hugely variable, but the spike in the summer of 2022 was quite something.
Indeed, it was the worst “anti-core inflation in 42 years”; it was higher even than during the horrors of the oil crisis of the 1970s.
Here’s a chart produced by John Authers showing the “real” pain (i.e. food and energy) being felt with non-core inflation:
As Authers states, when viewed this way, “it’s glaringly obvious why the spike would feel like an outright insult, breaking an implicit contract that had lasted more than a decade”.
So yes, Fed officials (and the government) will say inflation is coming down.
But it’s still very present for people.
We have not come back to the prices we saw prior to the pandemic..
And whilst inflation may slow – it’s unlikely we will see those prices again.
Be Careful Here
With rate cuts now less likely this year – all eyes turn to earnings.
Banks will kick things off Friday – which are expected to be strong.
However, if the S&P 500 is to justify its current 21x forward PE multiple, then earnings will need to be stellar.
Right now, the market expects 11% to 12% earnings growth this year.
That implies a strong (spending) consumer; and a business climate which is investing.
Are they?
We will find out over the course of the coming few weeks – but that’s what will be required if the market is to sustain this rally.
Otherwise it will be a quick trip lower.
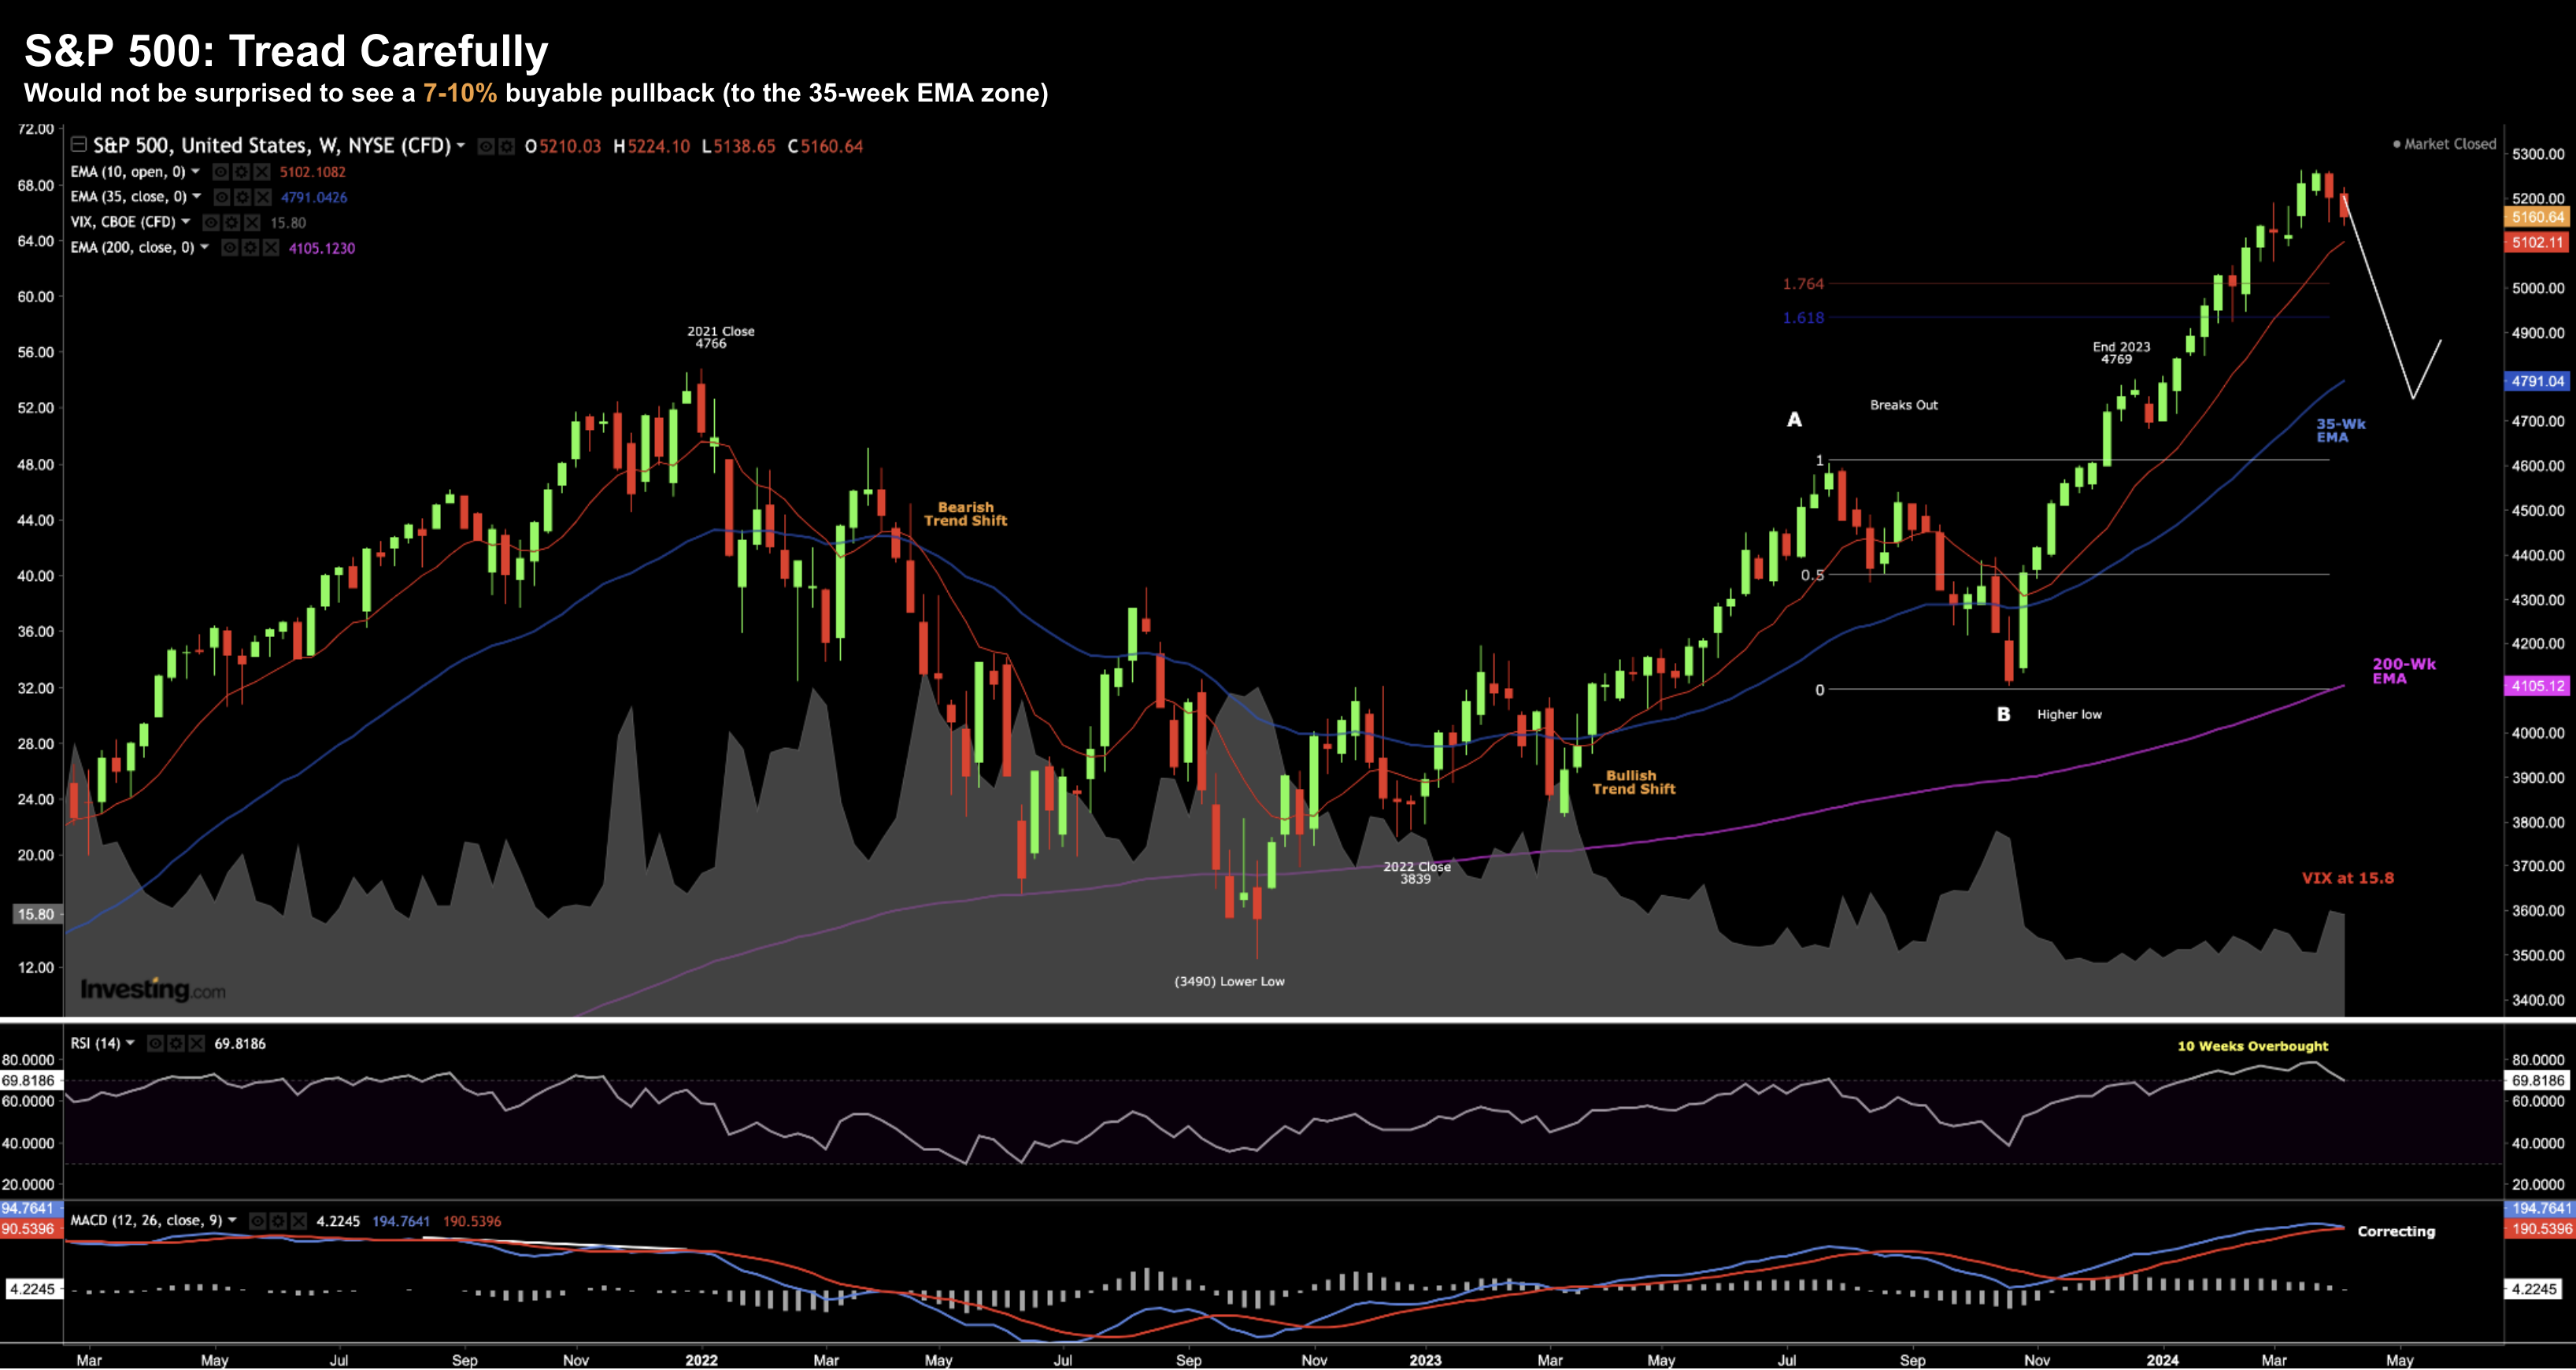
Below is the S&P 500 using the weekly timeframe
April 10 2024
From a technical perspective (i.e. ignoring earnings and fundamentals like PE ratios) – the market looks poised to move lower.
A few observations…
We’ve seen it trade in overbought territory for 10 weeks (as seen with the RSI – middle window)
What’s more, we can see the momentum starting to fade, evidenced by the weekly MACD (lower window).
Whilst the signal line of the MACD is yet to cross – it’s getting dangerously close.
The last time we see this weekly indicator cross – the market gave back near 20% (labelled A-B)
As I’ve been saying for a few weeks – I’m looking for a move towards the 35-week EMA zone (or around 4800)
That would represent a pullback in the realm of ~7%
That’s the area I would be looking to add to quality.
However, I think there is every chance we get lower than 4800 should:
(a) 12% earnings growth fail to materialize; and
(b) 10-year yields continue to trade between 4.50% and 5.00%
Putting it All Together
Before I close… a quick note on the US 10-year yield.
Today the all-important 10-year surged back above 4.50% – putting renewed fear into equity markets.
And with good reason – future cash flows should be discounted.
What’s more – the risk premium investors should expect by owning equities continues to diminish (vs risk free returns).
In short, I believe the two primary ingredients behind the rise in the 10-year are;
(a) higher than expected inflation; and
(b) the massive $1.5T in government debt issuance coming down the pike.
To me the latter is far more troubling (but I digress). Goverment auctions for the 10-year bond this week were just awful – driving up yields.
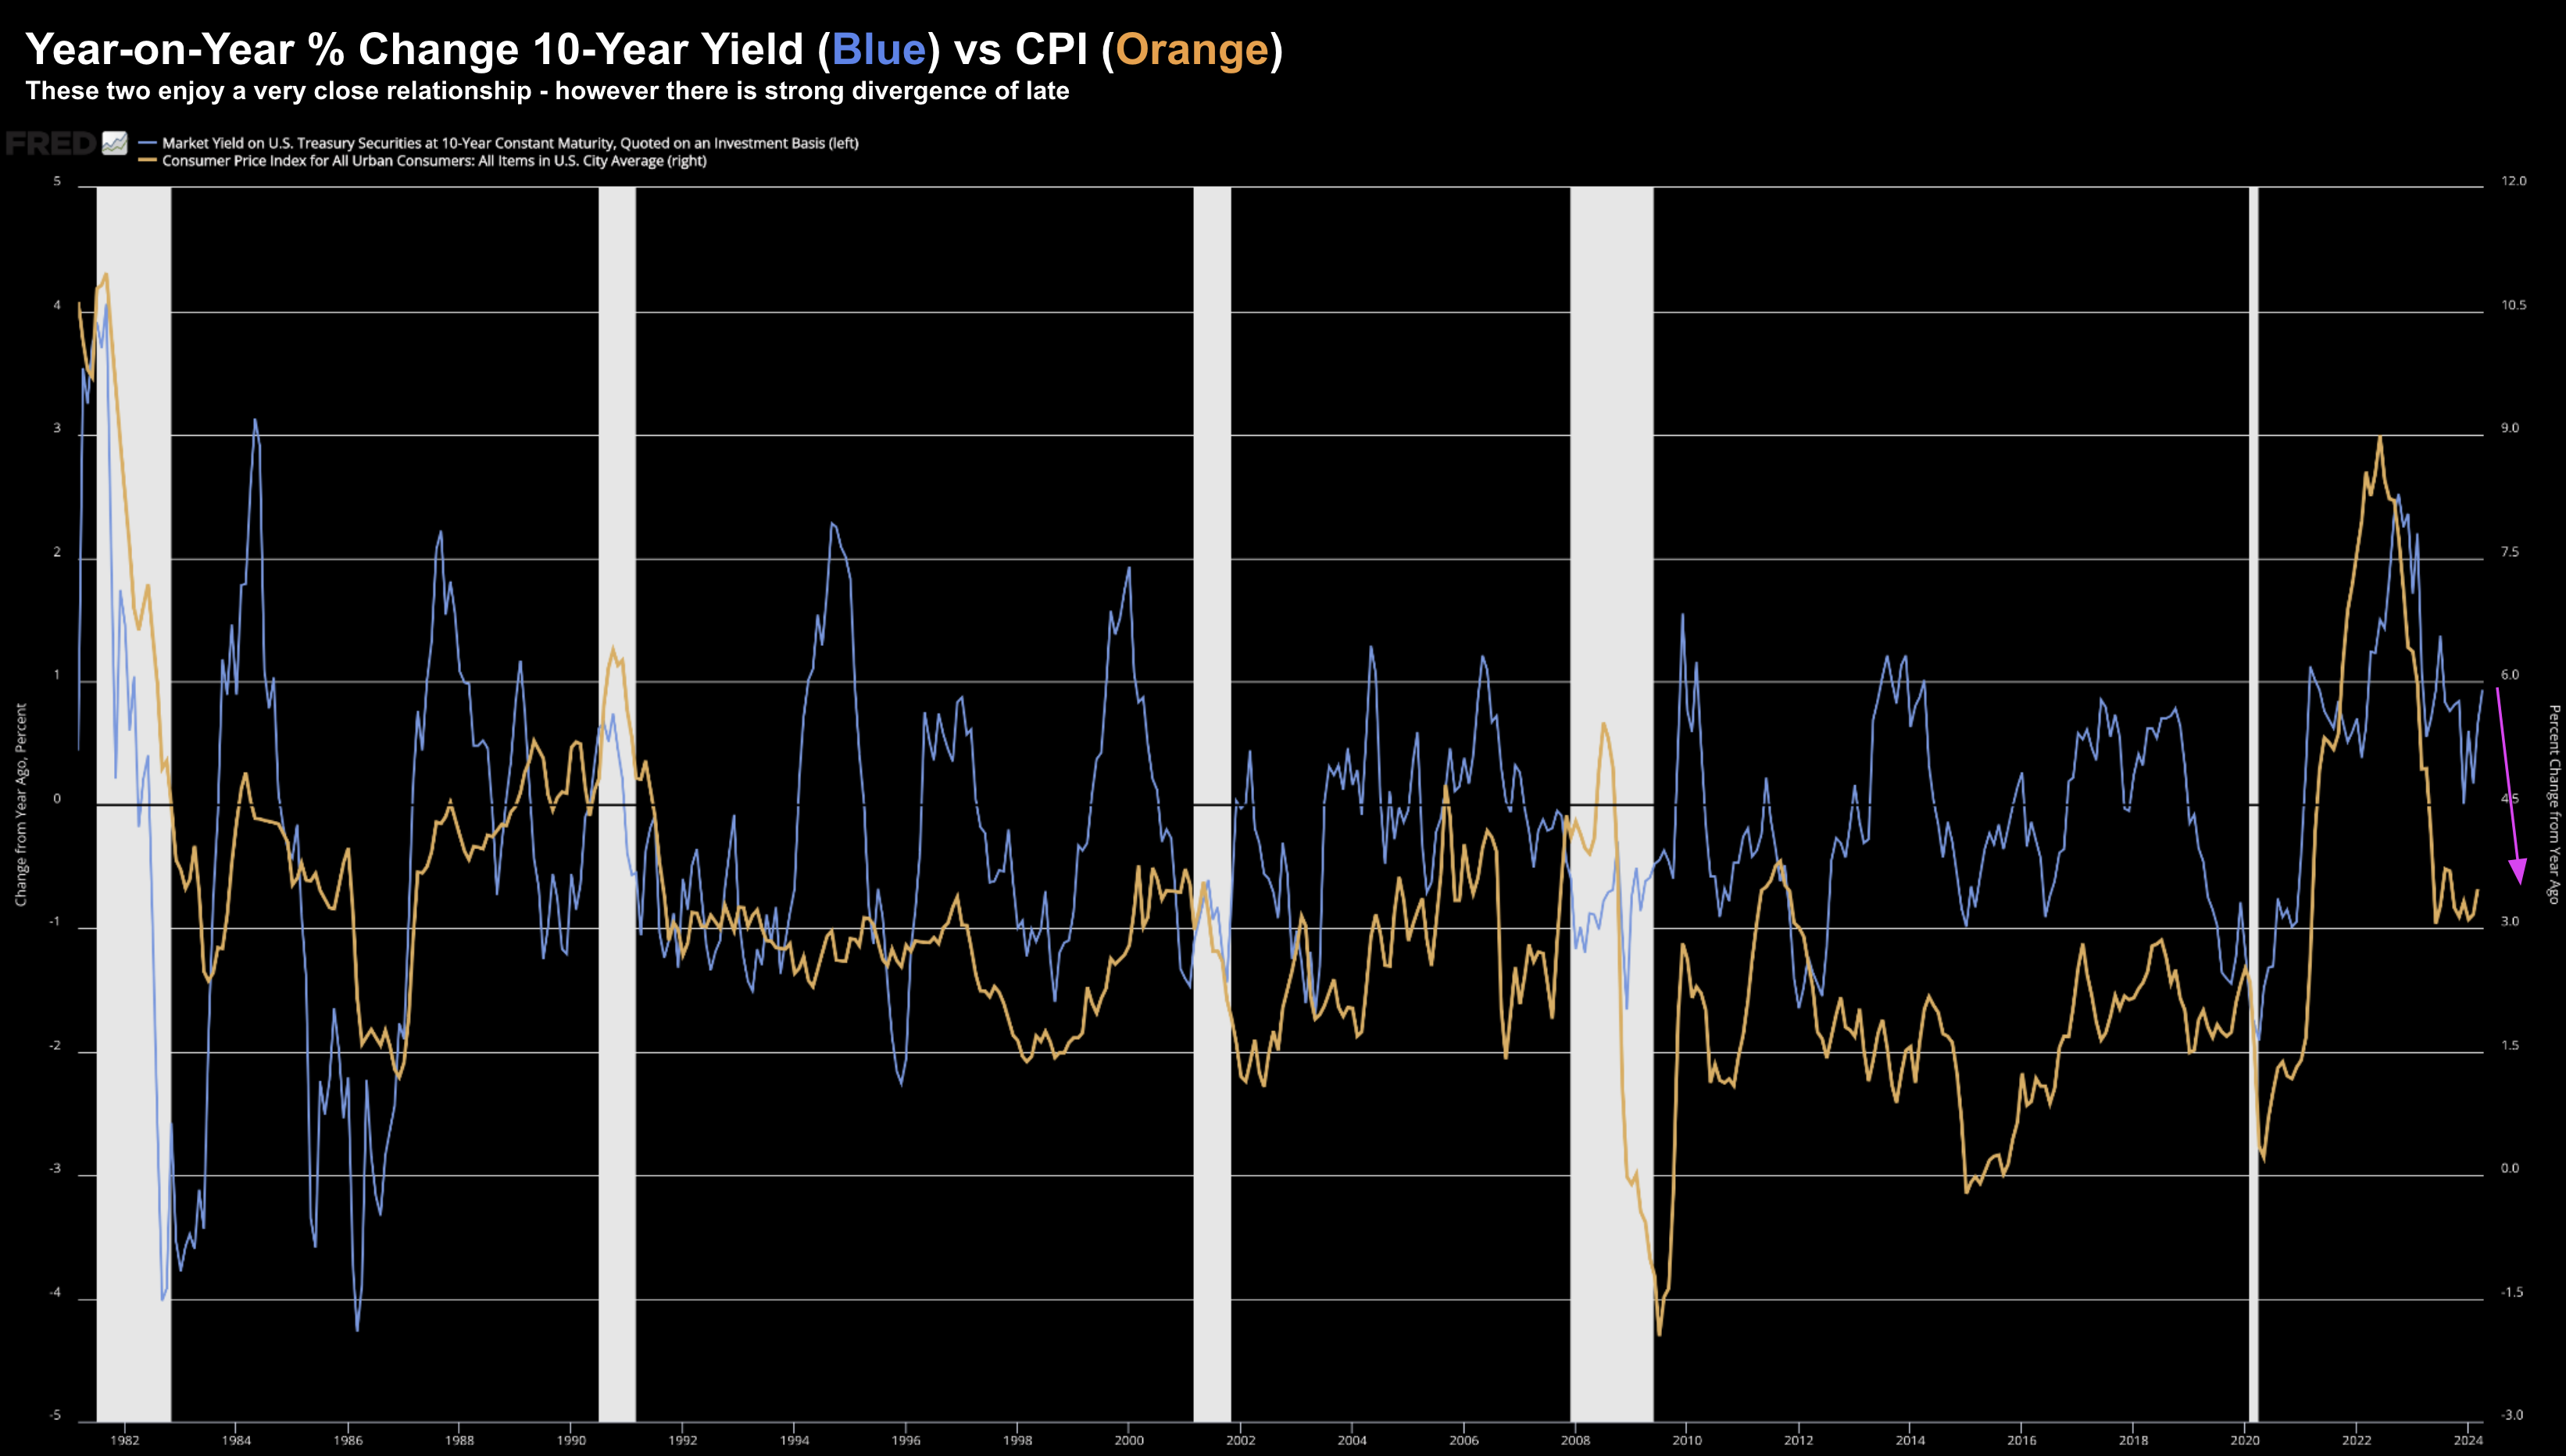
Below we see how these two variables (CPI and 10-year yields) enjoy a strong correlation.
And whilst there are often periods of strong divergence (which we see now) – over time this gap always closes.
April 10 2024
The pink arrow on the right-hand side is what I expect to see with the 10-year yield (i.e. they will push lower over time)
Therefore, a 10-year yield above 4.50% represents a good long-term opportunity (as bond prices trade inversely to yields)
My thesis is predicated on inflation gradually coming down over time (and the Fed will eventually reduce rates – perhaps H1 2025).
Now, should inflation reaccelerate meaningfully, then we can expect yields to rise (i.e. bond prices will fall)
And if that happens (where a 10-year is sustained above 5.0%) – then everything is in trouble (including stocks!)
For clarity, whilst the 10-year could easily continue to trade higher in the near-term (e.g., back up to 5.0%) – I think anything above 4.50% represents a good risk/reward over the long run.
Using the 40-year chart above, the best time to capitalize was during periods of very strong divergence with the change in CPI.


