- Real PCE – the most reliable leading economic indicator – rises YoY
- ‘Yellow flags’ with savings rate and rising credit delinquencies
- Keeping a close eye on real wages (which drives spending)
The market received three important data points this week – inflation, wages and consumer spending – and it was mostly good news.
First up, inflation continues to moderate.
The Federal Reserve’s preferred inflation index – Core PCE – showed prices increased at a moderate pace for June— confirming excessively high inflation is now well behind us.
And whilst essential (non-discretionary) items such as food, rent, energy, insurance etc remain (on average) ~30% higher than 3 years ago – the ‘good news’ is prices are rising at a slower pace.
Here are the key inflation numbers for June:
- Excluding food and energy, the core measure rose 0.2% MoM, a tick faster than in May.
- From the same month a year ago, PCE rose 2.5% in June compared to May’s 2.6%. Core PCE held at 2.6%.
On the whole inflation print came in mostly as expected – setting the Fed up for rate cut in September (which the market sees as a near 90% probability).
And whilst inflation metrics are important (more on this in my conclusion) – what I was more interested in is whether consumers continue to spend?
For example, we have seen a series of weaker real retail spending numbers (i.e., nominal data is largely flat) – it had me asking questions.
As explained here – Real Personal Consumption Expenditures (PCE) – have a consistently predictable relationship with both the direction of the economy and the stock market (given spending constitutes around 70% of GDP)
The good news is Real PCE (i.e., where spending data is adjusted for inflation) showed positive year-over-year change on a quarterly basis.
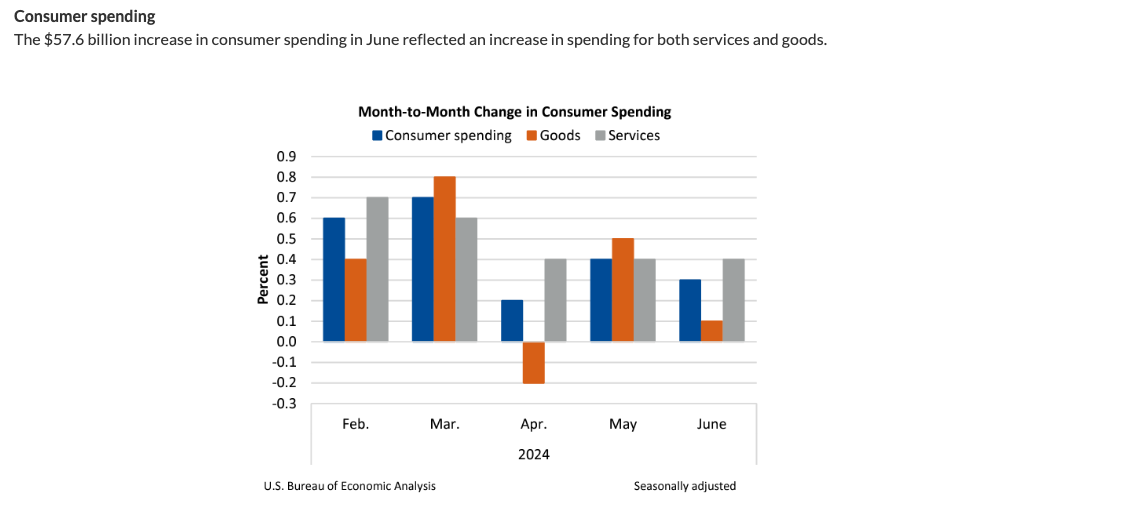
The ‘noisier’ monthly print saw spending increase 0.3% month-over-month – and 2.6% year-over-year.
Let’s take a deeper look.
Consumers Continue to Spend
I often like to say never underestimate the American consumer’s willingness to spend.
It’s relentless.
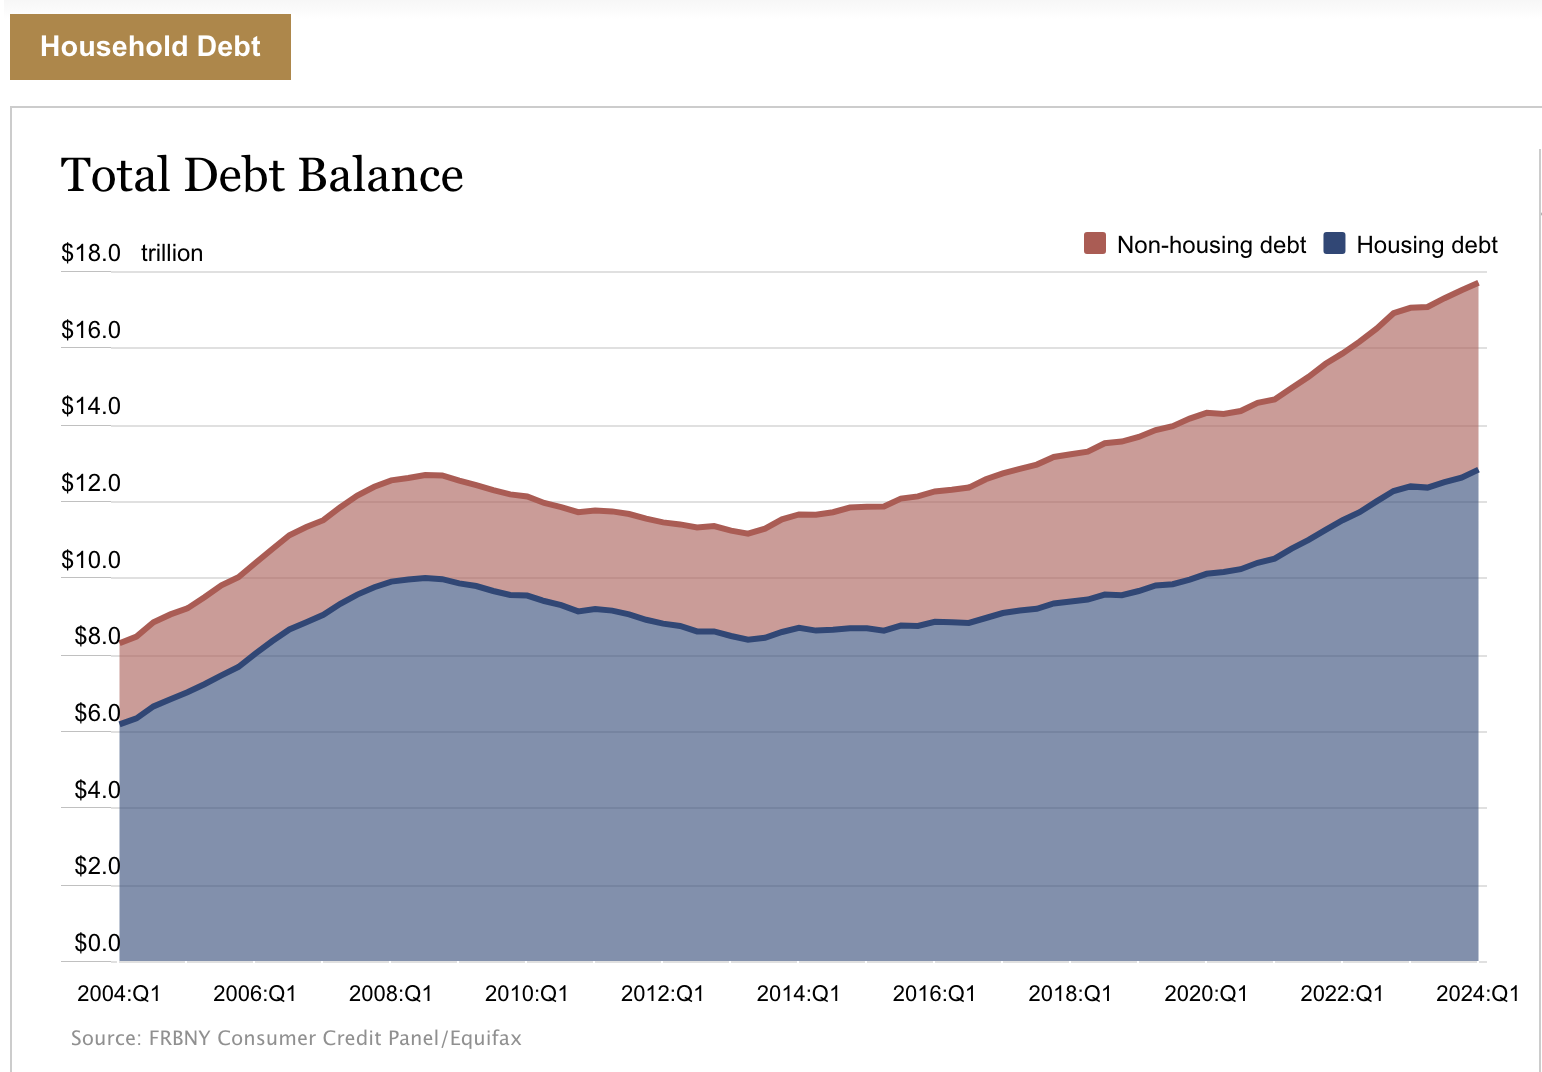
Over the past couple of years – U.S. consumers have broken spending (and debt) records – with personal debt pushing $18.0 Trillion in aggregate.
So what are we spending money on?
Here’s the June breakdown from the US Bureau of Economic Analysis:
- Within services, the largest contributors to the increase were international travel, housing and utilities
- Within goods, the largest contributors to the increase were other nondurable goods (led by pharmaceutical and other medical products); and recreational goods and vehicles (led by information processing equipment). These increases were partly offset by decreases in motor vehicles and parts (led by new motor vehicles), based on Wards Intelligence unit sales data, and gasoline and other energy goods, based on projections from the Energy Information Administration.
Monthly prints are helpful – but tell us nothing of the longer-term trend(s).
What’s more, such a short timeframe also contains a lot of noise (which we want to remove).
We’re better served by looking at the 3-month average (quarterly) year-over-year percentage change in Real PCE.
This gives us insight into any prevailing trends (and from there any cause-and-effect; e.g., trends in savings and wages – which I will talk to later)
Long-Term Real PCE Trend
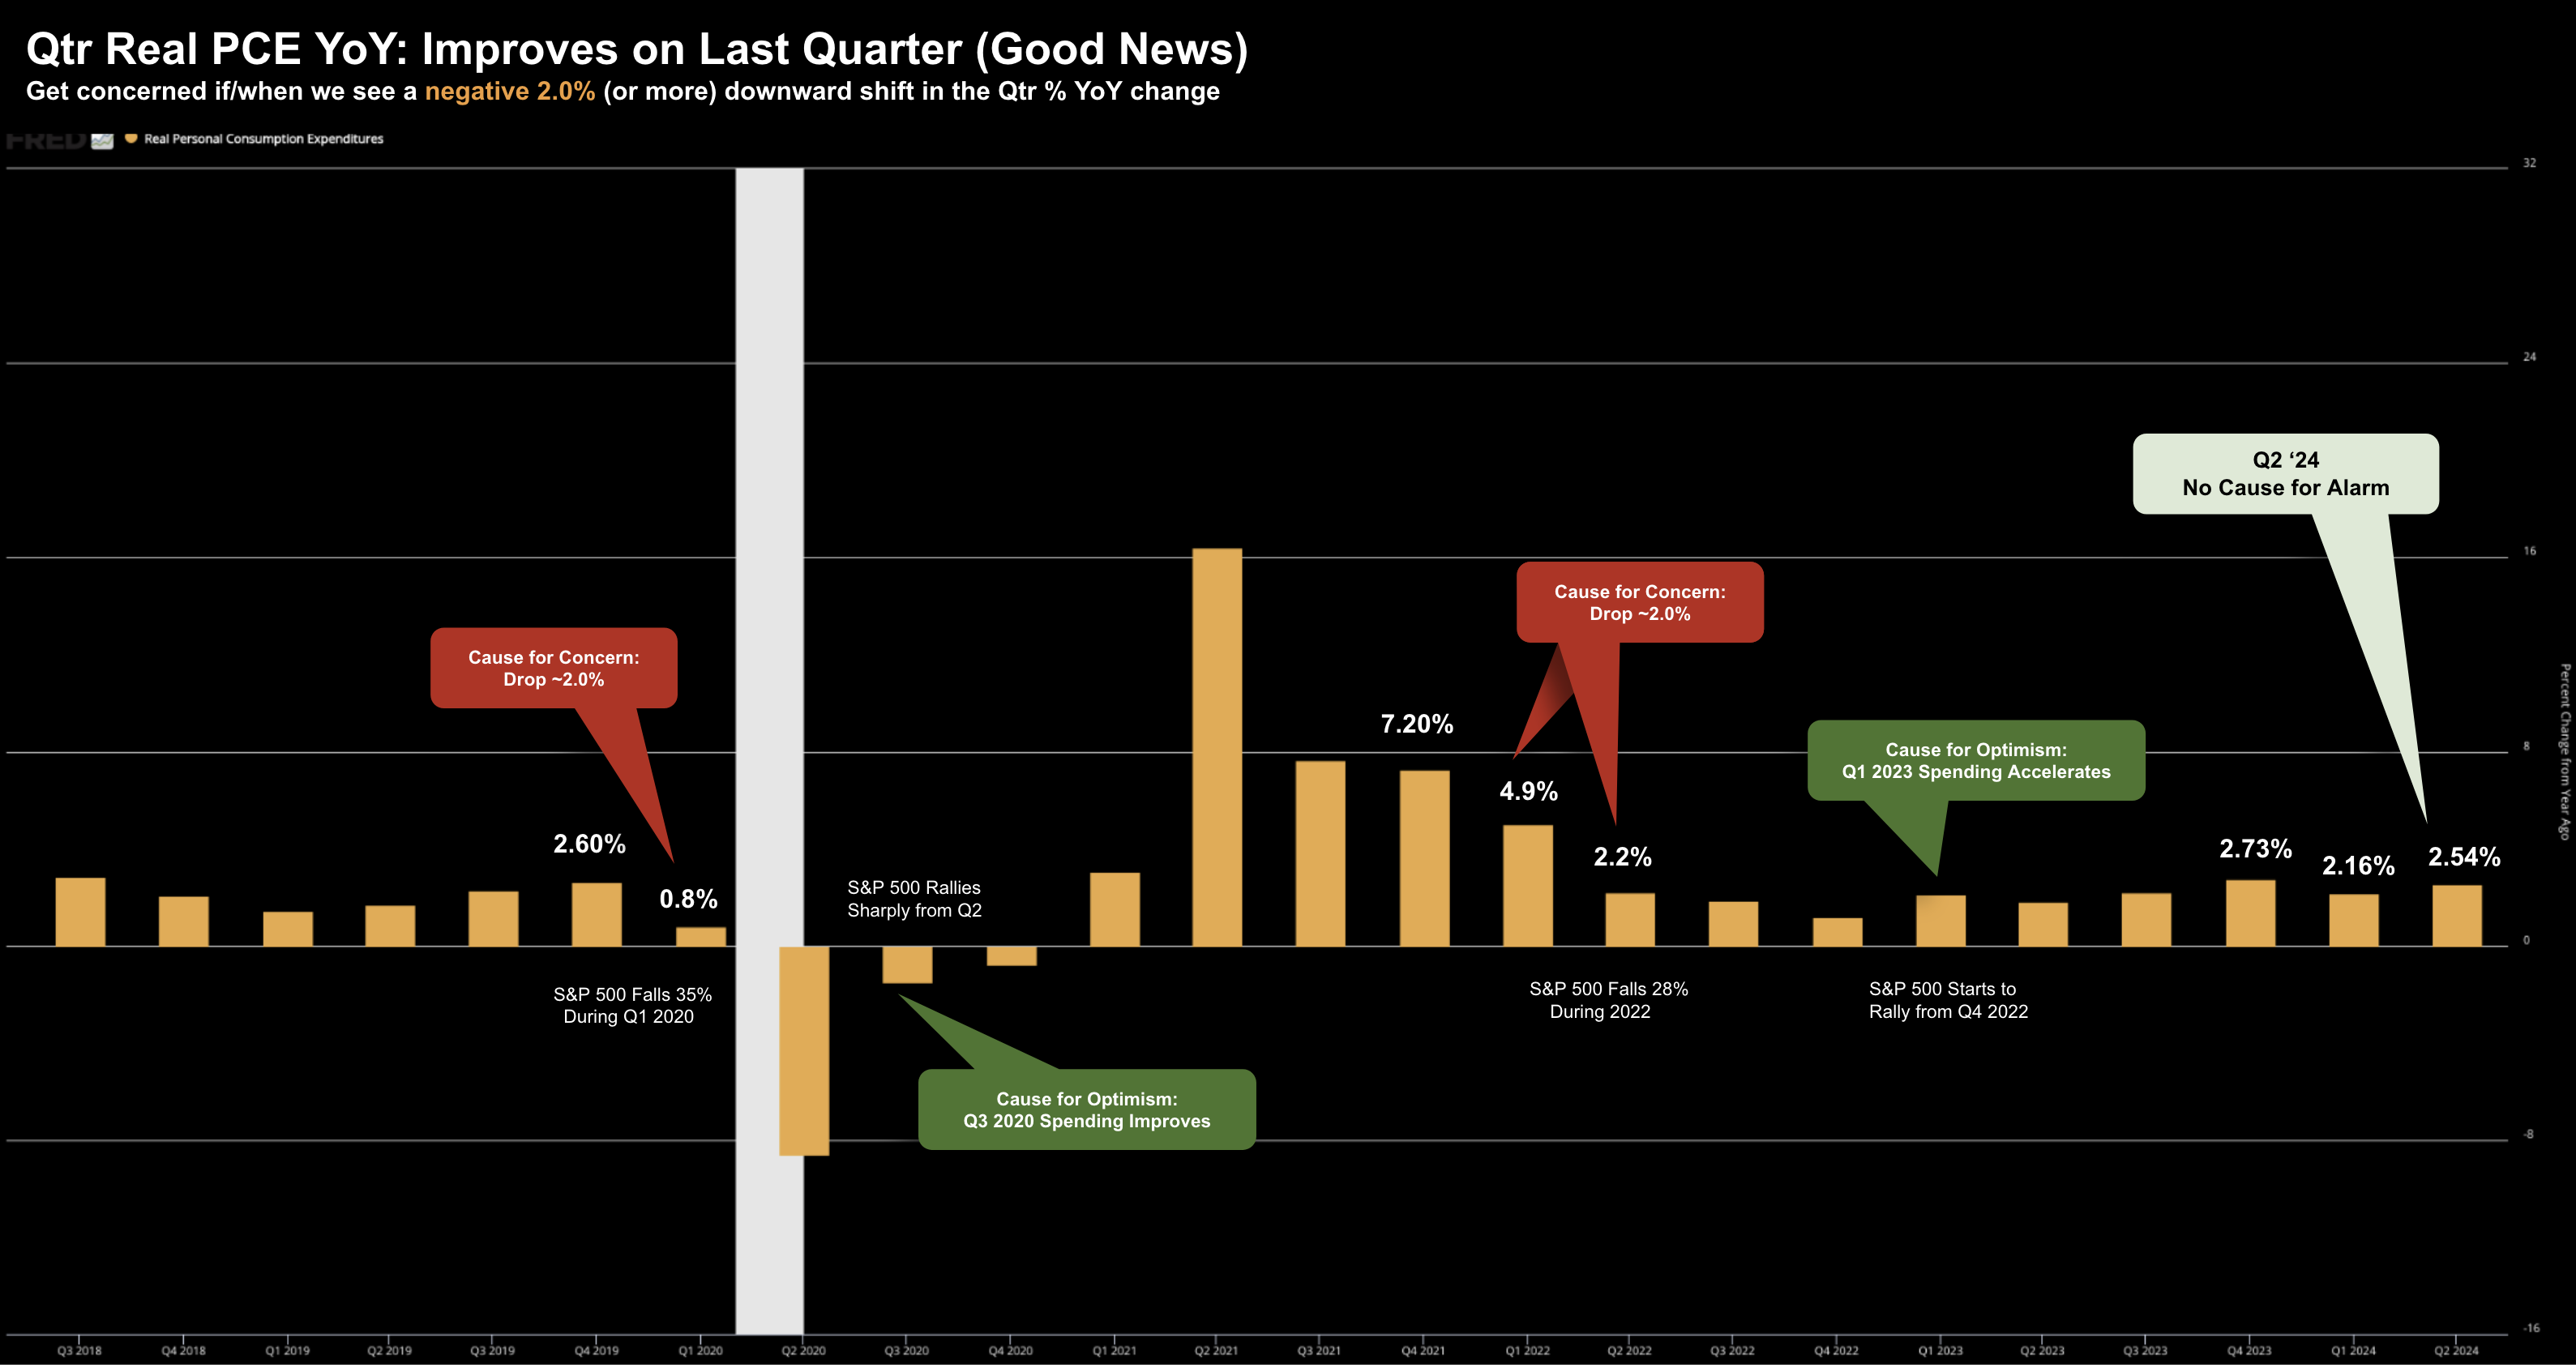
Below is the quarterly trend for Real PCE – where I’m most interested in the percent change year-over-year for that quarter.
July 27 2024
For Q2 2024 – we saw an increase of 2.54% YoY – which is good news for equities.
This is also up from 2.16% the prior quarter (however below the 2.73% for Q4 2023)
TL;DR – the consumer is not falling off a cliff – which is good news for earnings (in turn, stock prices).
For those less familiar with this leading metric – if I see a change of negative 2.0% or more between quarters (measured year-over-year) – it’s time to get very defensive.
The two instances (see red bubbles annoted above) we’ve seen over the past 5 years have seen material (20%+) declines in equities in the 6-9 months ahead.
Again, there does not need to be recession to have a material negative impact on equities (a point often missed by mainstream and analysts)
And on the flip side – when we see acceleration in Real PCE (on a quarterly YoY change basis) – it’s time to get aggressive.
You can apply this analysis (using the Fed’s charts) for any period and the same cause-and-effect pattern appears.
For example, we also saw it in 1999 and 2007 – where both recessions were preceded by a 2.0%+ decline in quarterly YoY in Real PCE.
And whilst you may have looked incorrect with your thesis for a good 6-9 months (which will often attract criticism) – being early was far better than being late.
In summary – consumers continue to spend in real terms. Good news.
But let’s turn to what enables consumers to spend. Three primary forces:
- Savings rates (which we saw build during the pandemic – as consumers were locked-down)
- Credit cards (which have been rising); and
- Real wage increases (vs nominal)
Real wage increases (those adjusted for inflation) is by far the most powerful enabler of spending.
And whilst savings and credit cards act as a spending ‘buffer’ – the most important factor is whether consumers are taking home more money (after the impact of inflation)
When we see real wages decline – there is a direct correlation with a decline in Real PCE (absent any material government intervention – as we saw during after the pandemic – with trillions in handouts)
Savings Rates Drop
When we get monthly PCE from the BEA – we also receive income data.
Whilst this is a broad simplification – if people are spending more than they earn (i.e., living beyond their means) – generally it means a decline in savings.
That’s the very loose interpretation.
However it’s what we are seeing….
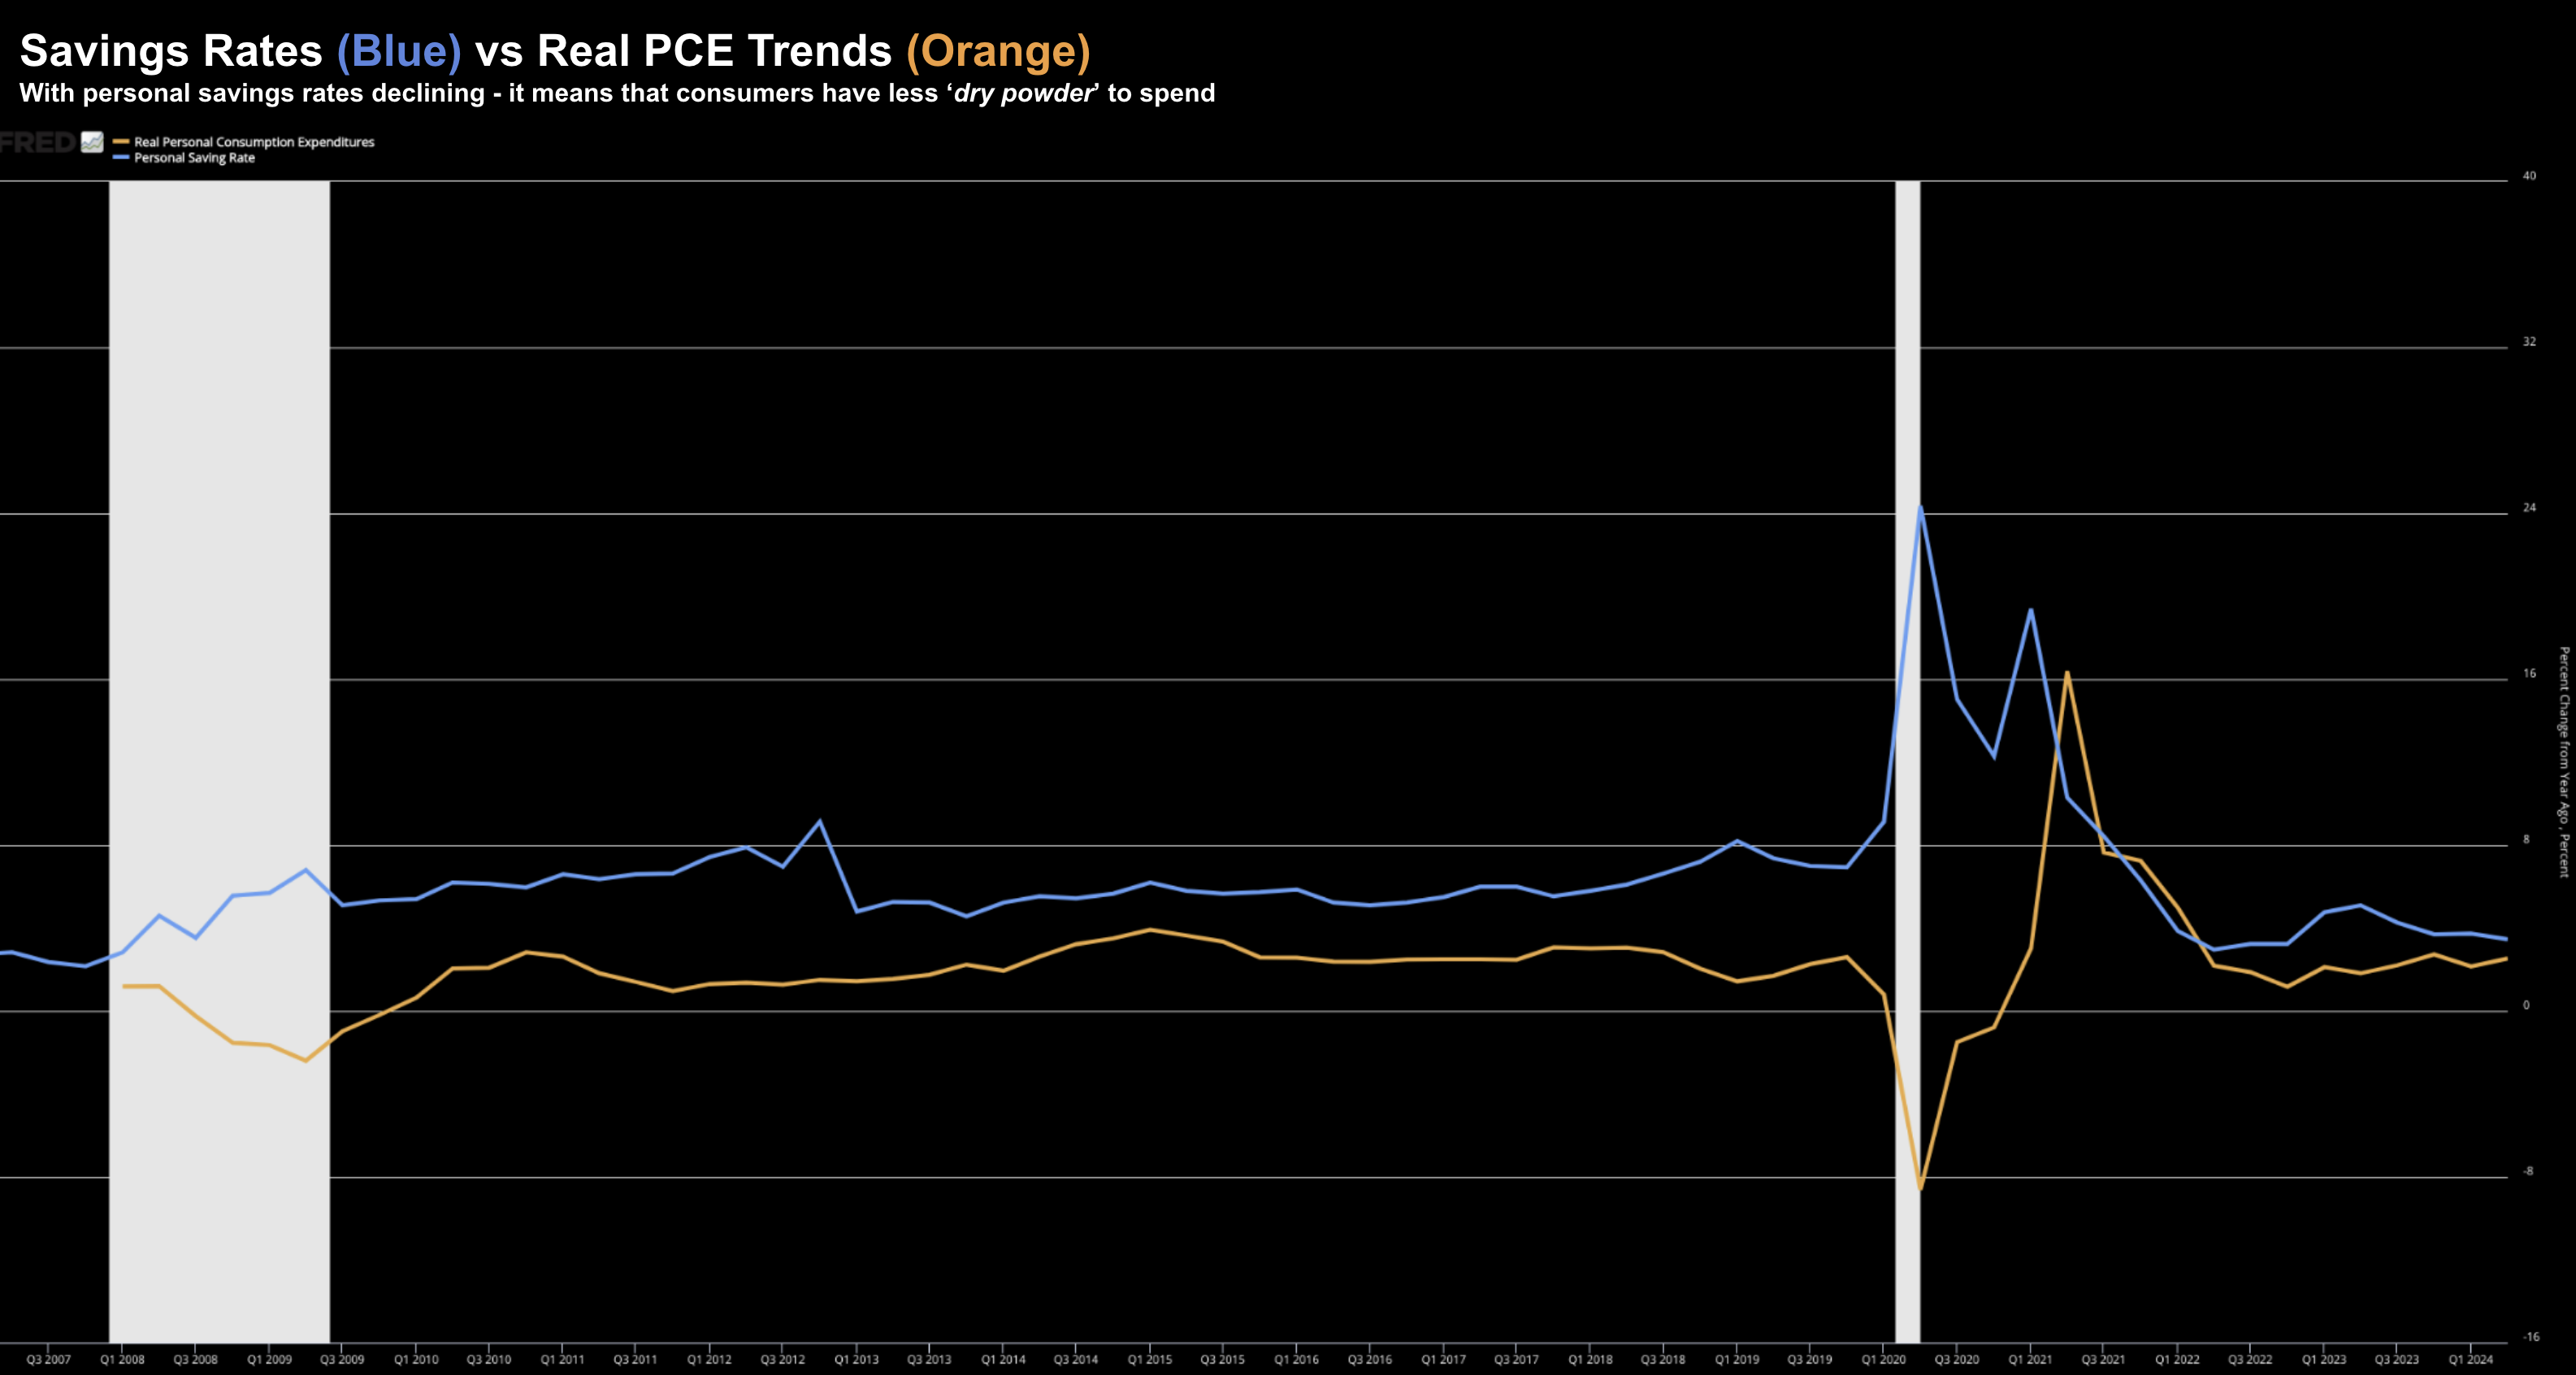
The U.S. consumer’s savings rate hit just 3.14% and appears to be trending lower.
The last comparable print was the mid 2000’s.
For clarity, this doesn’t mean they are so stressed that they can’t spend – not at all – however the level of 3.14% is a yellow flag.
In short, it means consumer’s “dry powder” is less.
July 27 2024
Taking a step back – this aligns with various warnings from leading retailers (e.g., Walmart, Nike, Lululemon etc) on discretionary spend.
Retailers are telling us consumers are now more discerning with their money.
Walmart created a new word for this behavior… “choicefulness“
Fast food – very much a discretionary item – has seen McDonalds react with a $5 Meal Deal – which they plan to extend.
My read is retailers realize they no longer have the same pricing elasticity as they did shortly after the pandemic. And whilst consumers still have money – it’s less.
Therefore, retailers are being forced to reduce prices to meet consumers where they are (mostly due to the impact of inflation on essential items).
Price reductions means inflation comes down.
We were not hearing these warnings from retailers when consumers had pent up savings (combined with unprecedented government handouts) a couple of years ago. You might say consumers were flush with cash.
Here’s a related statistic…
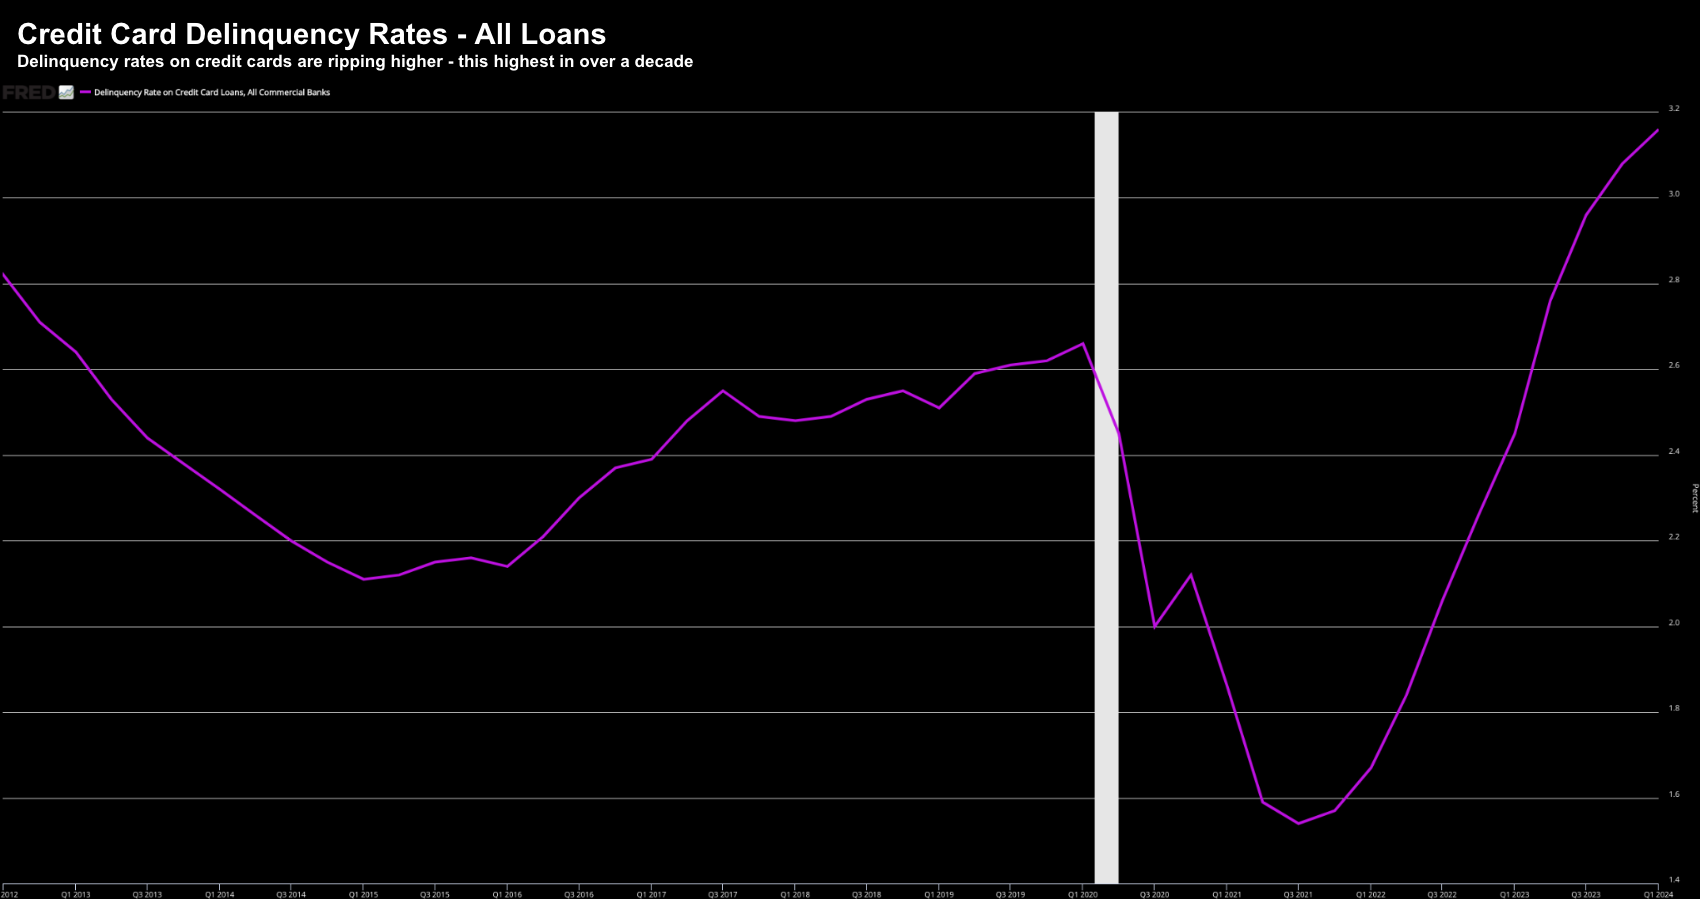
As savings dry up – not surprisingly – we are also seeing a sharp rise in credit card delinquencies…. the highest level in over a decade.
July 27 2024
Repeating what I said earlier – never underestimate the American consumer’s willingness to spend.
If they don’t have the savings – there is always the credit card.
For me, this is another ‘yellow flag’.
However, it’s not something to be overly concerned with yet. It simply bears watching.
Let’s now turn to the most important trend which leads Real PCE … Real Wages
Real Wage Trend
Not surprisingly, there is a strong consistent correlation between how much we earn and what we spend.
When we earn more – we tend to spend more.
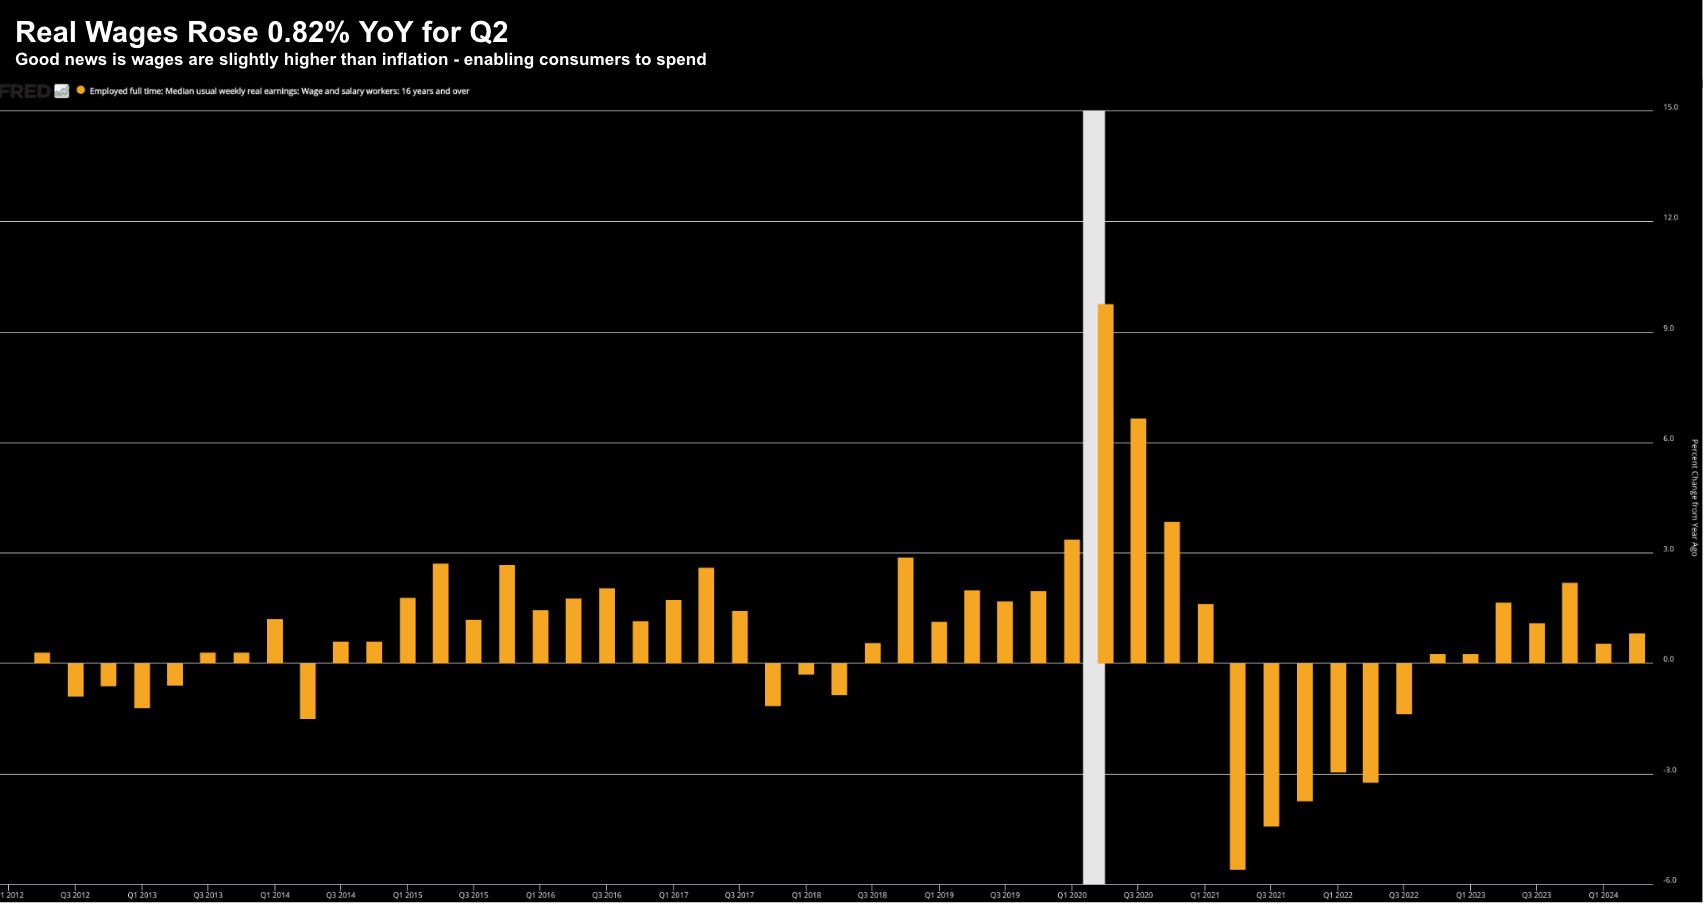
The good news is the rise in real wages is still above inflation (0.8%) for the seventh straight quarter.
This is far better than what we saw ~2 years ago – when consumers were getting belted by inflation in real terms.
July 27 2024
However, the trend in real wages bears watching.
For example, if we see this trend lower, then I will raise a red-flag with respect to the trend in Real PCE
For me, declining real wage growth is a yellow flag (which is good news for the Fed if they decide to cut rates this year)
Putting it All Together
Based on what I see with the quarterly YoY change in Real PCE – the popular ‘soft-landing’ narrative remains in-tact.
And whilst consumers are spending – I see yellow flags in terms of their ability to keep spending.
For example, the cautionary trends with savings rates, credit card delinquencies and real wages bear watching.
This is why things are generally slowing.
Consumers are being stretched to continue spending at the same pace they were a year ago.
That is, they are being forced to turn to credit and other means.
As it relates to equities in the near-term (i.e. next 6-months) – I think they continue to muddle along.
Two questions readers will most likely ask:
1. Could we see a 10% technical correction in the weeks / months ahead?
Definitely. That’s what I expect.
But that is not what I would consider meaningful (especially given how far we’ve rallied the past two years)
For example, should the quarterly YoY trends in Real PCE and Real Wages continue to hold up (and don’t materially decline) – then I would consider that an opportunity to buy quality.
However, if Real PCE and Real Wage growth deteriorates – all bets are off. In that case, I will start calling for a recession (or a material slowdown) 6-9 months hence.
2. Does this week’s PCE data give the Fed more ammunition to cut rates in September?
Yes.
Inflation is going to slowly moderate over the coming months. And whilst we may not get to their desired “2.0%” by the end of 2025 – I don’t think that matters a great deal.
Disinflation will likely continue opposite demand destruction (which we are seeing).
As I explained last month – the narrative from the Fed is about to shift from inflation concerns to growth risks.
Economic growth (for the U.S.) is largely a function of consumers continuing to spend at the same pace.
Put another way – when the consumer quits – you will see a domino type effect with a lag.
And that lag includes the reaction in equities.

