Words: 2,073 Time: 9 Minutes
- Business sector now very optimistic on the outlook
- Why reduced government spending can help ‘unlock’ private investment
- S&P hits record highs… however it’s very expensive
Markets could not be more optimistic about the future.
We can see it with consumer sentiment, spending and in the stock market.
For example, the S&P 500 surged to a new record high 6090 – far exceeding the most bullish of forecasts from 12 months ago.
Will analysts be equally bullish about 2025?
I will review the weekly chart shortly.
Post Trump’s Nov 5th win – the bulls have found another gear.
Trump has painted a compelling vision of a US economic resurgence built on three primary pillars:
- Lower taxes
- Sweeping deregulation and government reform; and an
- Emphasis on domestic production
The general view is that a far smaller government (i.e., less bureaucracy and reduced wasteful spending) will unleash entrepreneurial energy, driving economic growth and prosperity.
And markets believe this can happen…
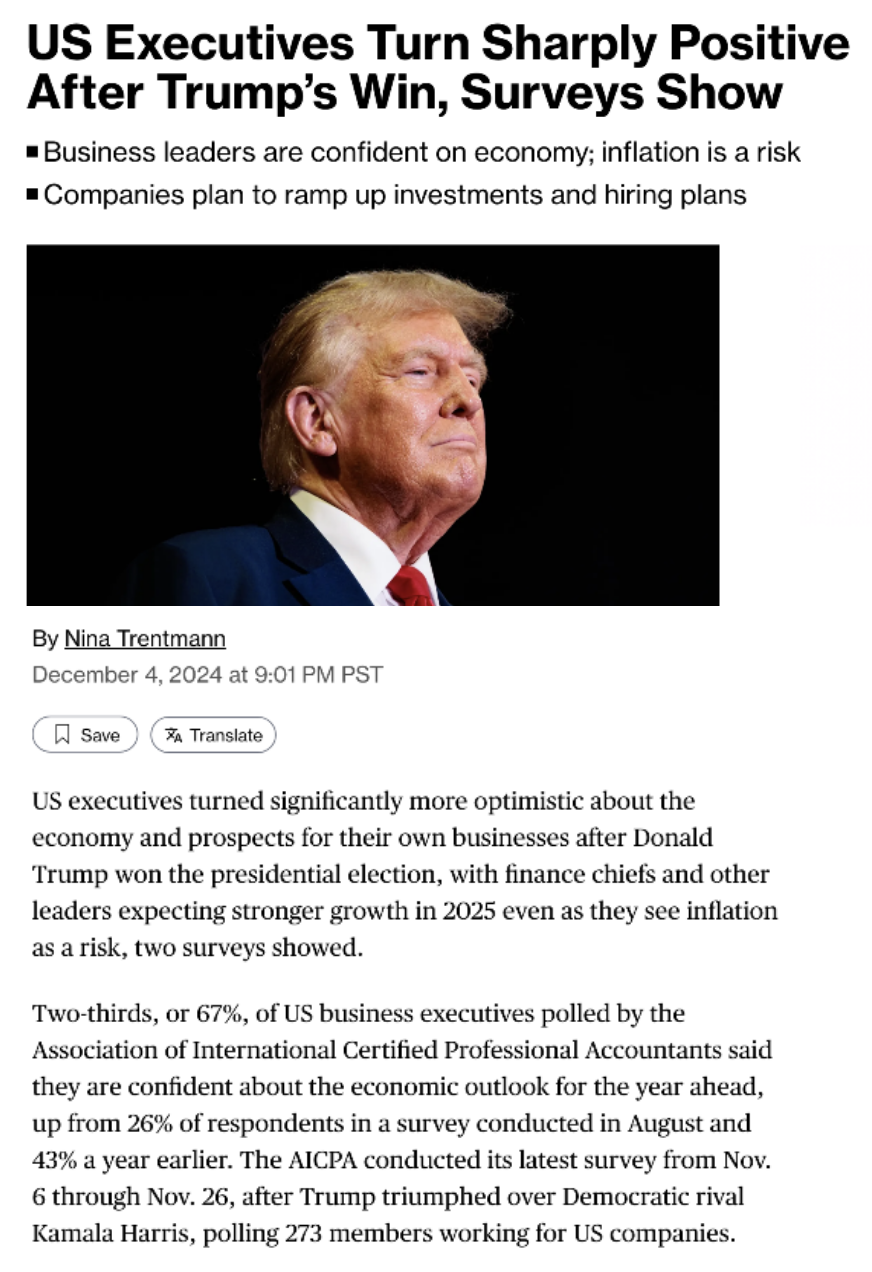
For example, two-thirds of US executives polled afterwards by the Association of International Certified Professional Accountants said they were confident about the economic outlook for the year ahead — where the survey reported a massive jump from 26% in August and 43% a year earlier.
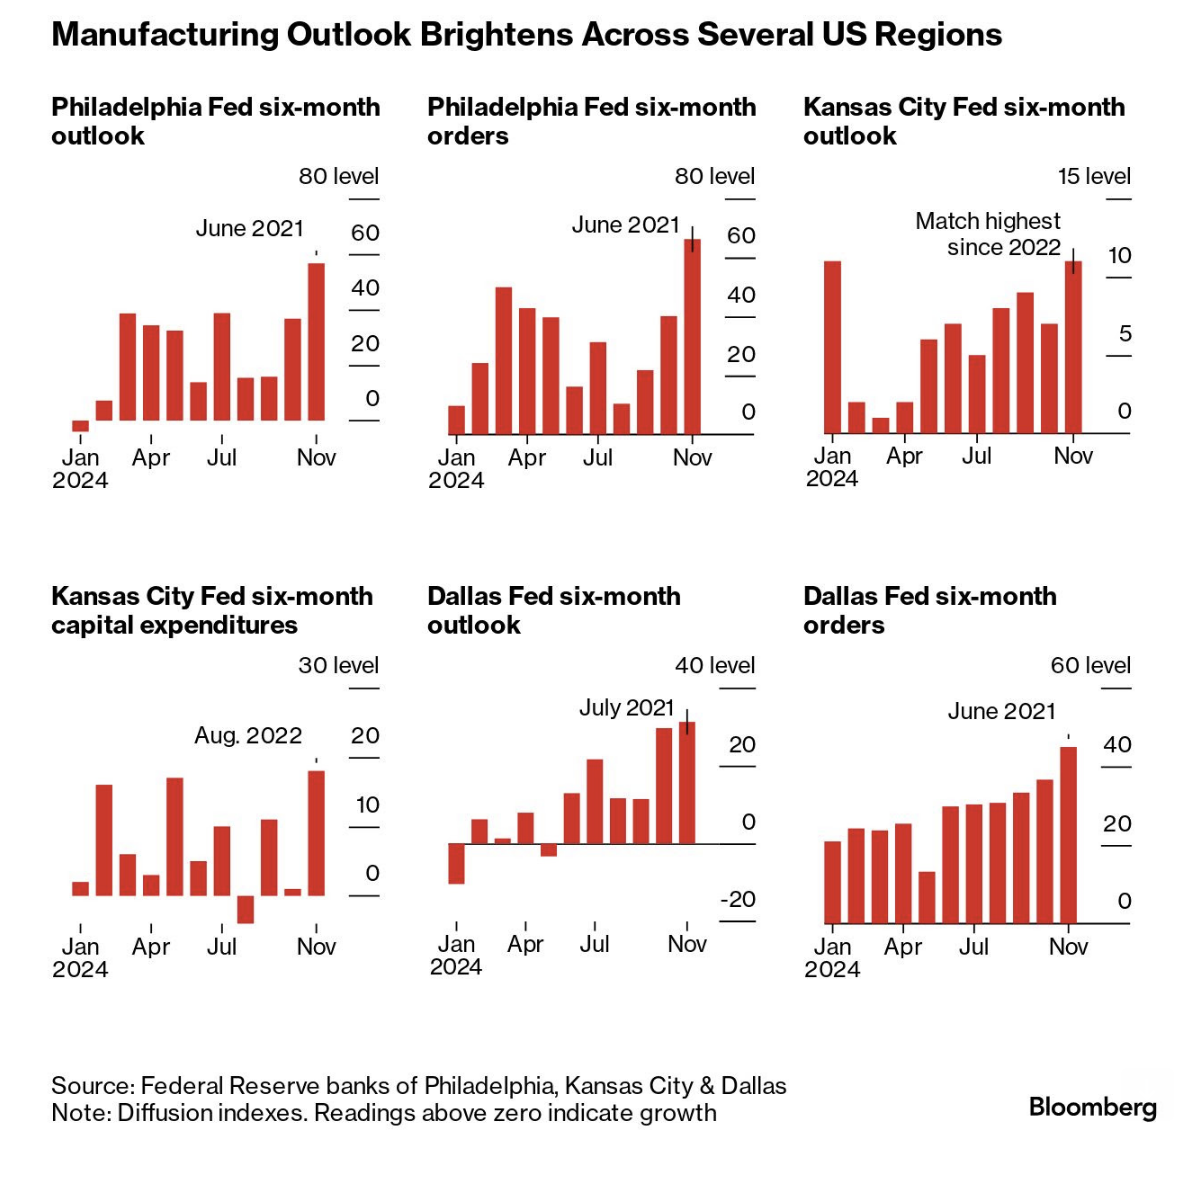
What’s more, Bloomberg reports that many regional Federal Reserve bank surveys have also hit multi-year highs.
Optimism is finally back…
However, this task will not be without its challenges.
For example, what will miss deportation due to sectors that depend on low-cost migrant employment? Will that see reduced output?
Possibly in the near-term.
That said, if the economy demands greater output, over time those jobs will be filled.
My point is the path higher won’t be a straight line.
Far from it. There will be dislocation in areas.
For example, with many sectors still highly dependent on government subsidies and handouts – the adjustment will be jarring.
But overall, markets understand why these business friendly policies give the economy a fighting chance to shine.
Let me explain why…
Why the Private Sector is Optimistic
To help explain why the market is so optimistic on Trump’s policies – let me demonstrate with a very basic example.
If I’m successful – it will help explain why excessive (wasteful) government spending can harm the economy.
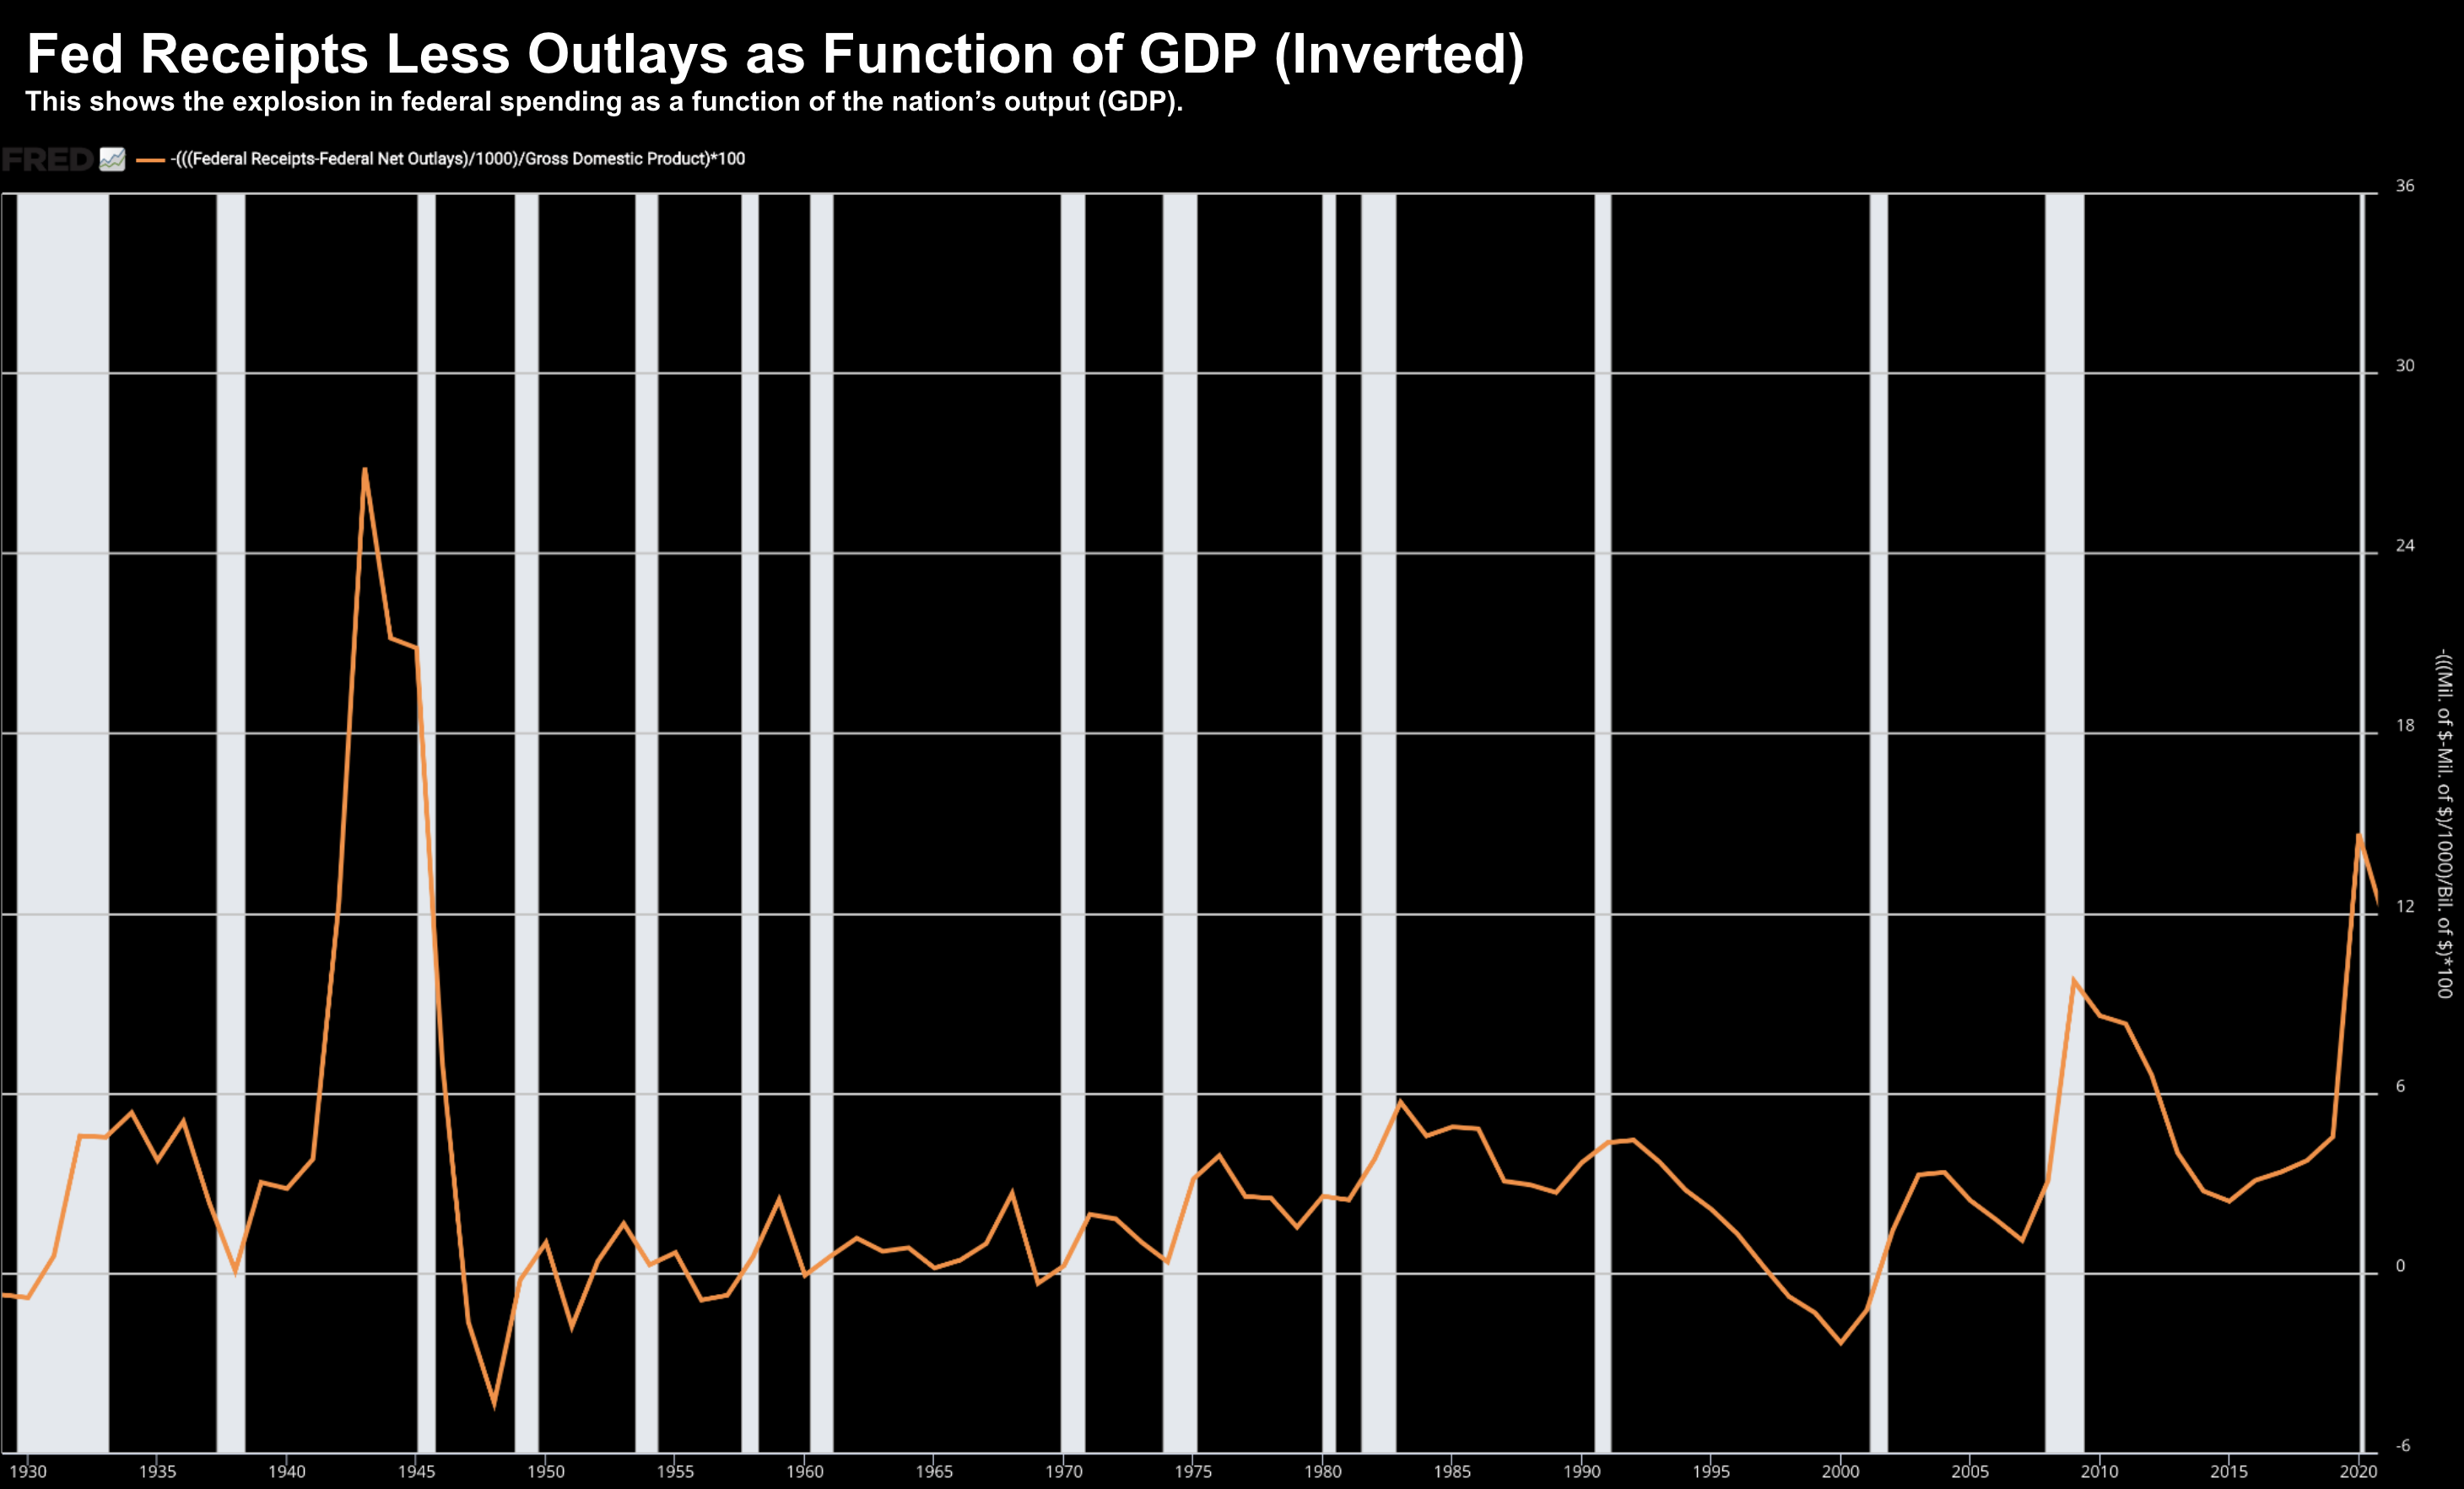
But to help set the scene – a long-term (70-year) chart to demonstrate the recent government spendathon:
Net government spending (tax receipts less outlays – inverted) has hit its highest levels since WWII as a function of GDP.
There’s just one difference – there’s no economic emergency today.
For example, economic growth is positive, unemployment is low, consumers continue to spend as wages rise; and companies are growing their profits.
So why the increased levels of government spending to unsustainable levels?
Let me off a basic example to demonstrate the problem:
A bridge is required to meet public demand and solve critical infrastructure problems. The government spend is justified if it serves taxpayers better than what they would have spent the taxed money on.
However, if that bridge was built solely to create jobs – this shifts focus from necessity to employment.
That’s detrimental to the economy for many reasons…
For example, when projects are invented to justify spending – they are generally framed as essential despite questionable real demand.
The first argument put forward by government will be is the creation of “xyz jobs” for a year or so (or how long it takes to complete).
And whilst that is the visible result – we must also understand these “bridge building” jobs come at the cost of taxpayers, who lose $xyz million they would have otherwise spent elsewhere, displacing private jobs and economic activity.
The second argument from the government comes after completion: the bridge is tangible proof of (effective) government spending.
However, its visible existence overshadows the unseen losses; for example – you will never hear about the unbuilt homes, un-produced goods, and jobs never created due to diverted (taxpayer) funds.
Recognizing these indirect (unseen) consequences is the study of economics.
Most focus on the tangible result: the bridge.
However, what we (always) should strive to understand is how government spending diverts, rather than adds to true economic value.
Further to my basic example, excess government spending is generally detrimental to the economy unless the bridge solves a critical infrastructure problem.
That is, where the government spending better serves the taxpayer versus if they were to invest or spend the money elsewhere.
Let me offer 5 reasons why:
When we have excessive government spending (like what we find today – as shown in my chart above) – this can harm the economy in the following ways:
- Higher Interest Rates: As we’ve experienced the past 4 years – when the government radically increases its spending, it borrows heavily by issuing bonds. This raises demand for loanable funds, which can push up interest rates. Higher interest rates make it costlier for businesses and individuals to borrow, discouraging private investment in projects and expansion (where there is true economic demand).
- Resource Competition: Large-scale government spending will typically divert precious resources like labor and materials from the private sector. For example, infrastructure projects may compete for skilled labor or raw materials, raising costs for private firms. In this case, a non-essential bridge will take away resources for where there could be real economic demand or need
- Tax Burden: Excessive government spending will often necessitate higher taxes in the future to finance debt. This is why we saw the previous administration campaign on increased wealth confiscation to fund their excess spending. This has the deleterious effect of reducing disposable income for consumers and profitability for businesses, dampening private-sector activity. From there, this results in “unbuilt homes; unbuilt factories” and overall less consumer spend etc)
- Reduced Investor Confidence: Persistent high government spending can signal fiscal instability, leading to concerns about inflation or future tax hikes (as we saw). This uncertainty may deter private investment and reduce economic dynamism.
- Crowding Out Financial Capital: In economies with limited savings pools, government borrowing absorbs funds that could otherwise finance private ventures, leaving less capital available for businesses to grow.
Trump has come in with a promise to reduce government waste and put more resources in the hands of the private sector.
As Bloomberg’s charts show – this has the private sector extremely optimistic.
The private sector is a very efficient allocator of resources and will respond to (true) market demand.
Why are they more efficient?
If the private sector wastes scarce resources and gets it wrong – they go broke.
They don’t get another chance.
There is no massive tax refund if their business dies. They lose their money.
However, if the government wastes taxpayer funds on “bridges to nowhere” (where the public expense isn’t rightfully justified) – they simply look to confiscate more resources – further harming the private sector in the ways outlined above (and not limited to).
Stocks Optimistic – But at a Steep Price
The stock market is equally optimistic about future earnings and growth.
However, as I mentioned yesterday (and last week) – this comes at a very steep price.
The S&P 500 now trades at a forward PE ratio of 22x.
Another popular valuation measure – Tobin’s Q-Ratio – is trading at all-time highs.
Today I want to offer another measure of value (and risk vs reward) – this time from investing legend Peter Lynch.
The former head of Fidelity’s flagship Magellan Fund produced an annualized rate of return of 29.2% over his 13-year stint at the helm.
Apart from Warren Buffett, Seth Karman, Howard Marks and Stan Druckenmiller – very few other other asset managers boast such an impressive long-term record.
As I often say, posting double-digit returns for a few years is not difficult (especially during a bull market)
That’s not a measure of success.
However, if your returns exceed the Index for a period greater than 10 years – this indicates what you’re doing is skill – not luck.
So how did Lynch achieve this record?
It’s not as complicated as you might think.
And it very much overlaps with the valuation concepts highlighted in Chapter 18 of Ben Graham’s ‘The Intelligent Investor’.
In Lynch’s best selling book, One Up On Wall Street, he revealed a powerful tool that helped ‘filter‘ his investment decisions.
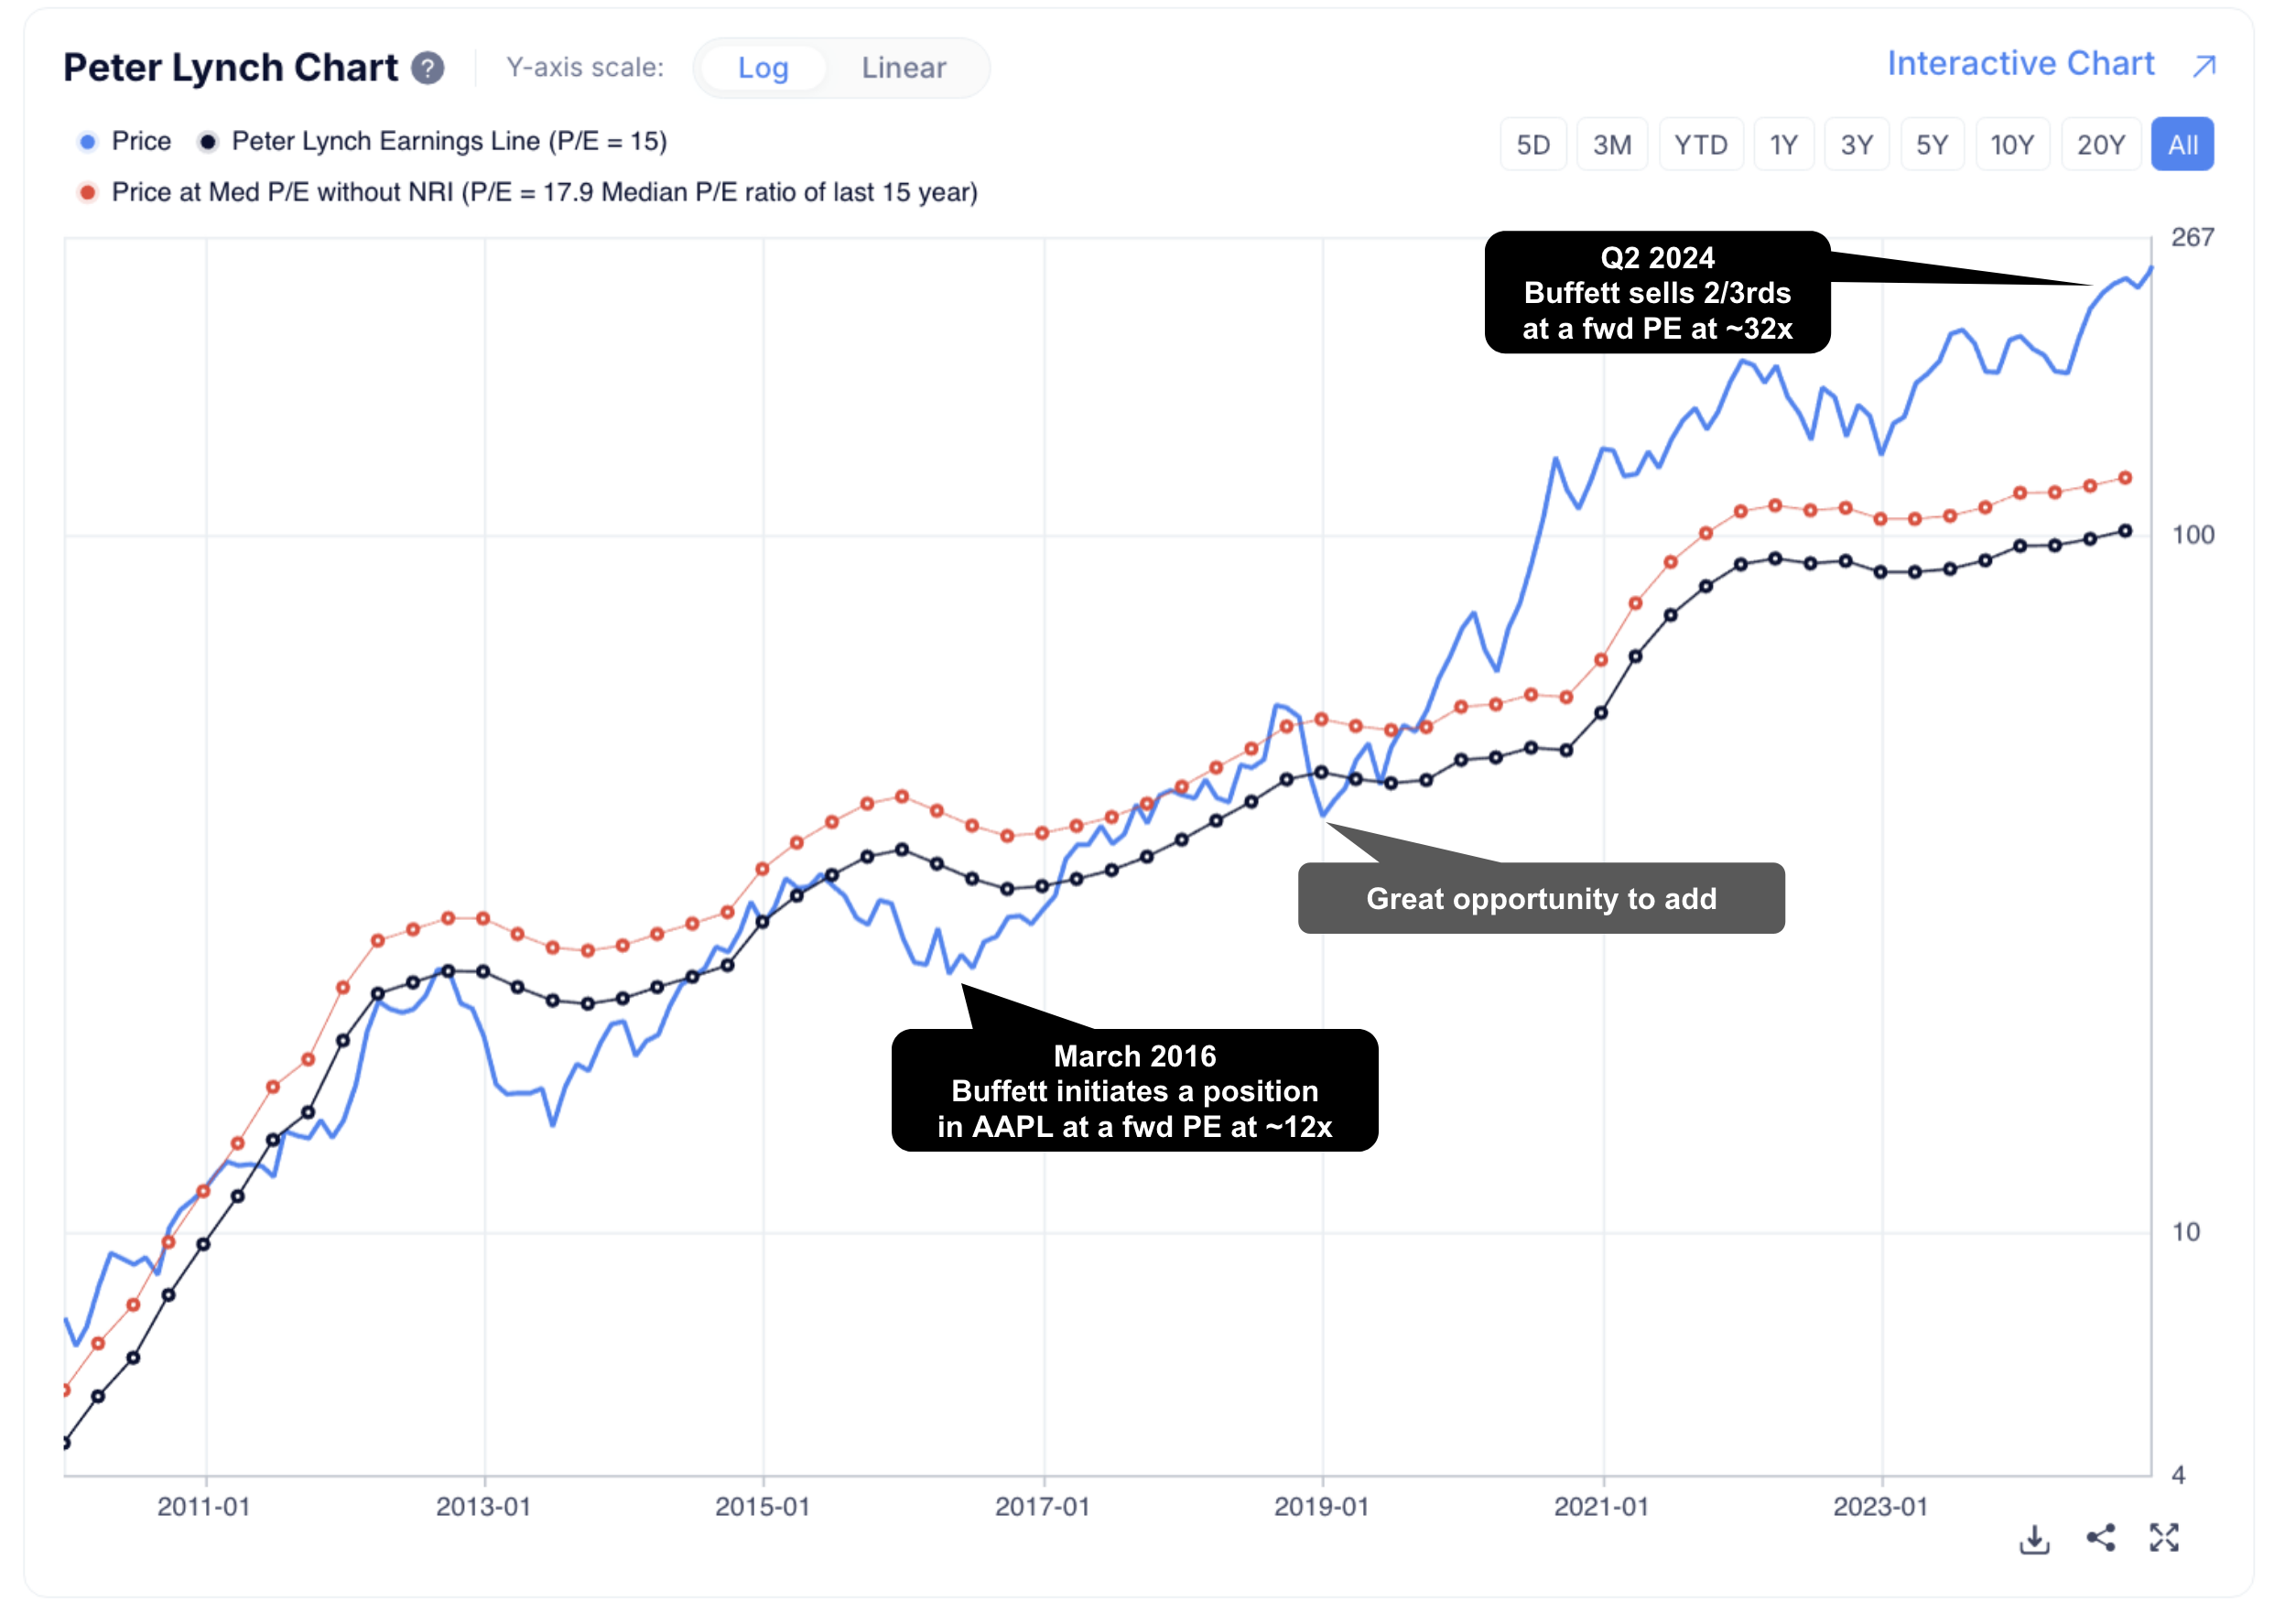
Deemed the “Peter Lynch chart”, he plots the stock price against its “earnings line” – a theoretical price equal to 15x the earnings per share.
Let’s consider Apple – a stock I recently reduced in my portfolio due to its 32x forward PE ratio.
The chart below shows where Peter Lynch would have deemed this a good risk/reward based on this metric:
From mine, this kind of measure is another useful filter when asking if you are paying too much for a stock.
My approach is stock selection is two-fold:
- Asses the company’s quality (e.g., ability to generate strong free cash flow yield; strong return on invested capital with a low weighted average cost of capital etc over a period of several years); and second
- Challenge what the market is asking for the asset.
It’s the second test that most investors overlook.
Generally they focus far more on what to buy (e.g. popular stocks like Google, Apple, Amazon etc) – however at the risk of ignoring what price the market is asking.
As a result, they are at risk of overpaying.
It’s the second test where you could use a tool similar to Peter Lynch’s (or something similar like a Q-Ratio or other method).
S&P 500 – Asking 22x Forward
Let’s finish with a look at the S&P 500.
Today it would fail Peter Lynch’s test of a 15x.
As an aside, in this case, I would modify the test and use the rolling 10-year average PE which is closer to 18x.
For example, at a projected $275 earnings (EPS) next year (11% YoY growth) – 18x EPS would put us at 4,950
That’s 19% below today’s asking price.
For what it’s worth, at just 15x (the 100-year average multiple of the S&P 500) – that would put the market at an eye-watering 4,125 (32% lower)
I can tell you that no-one (or very few) are thinking about the possibility of 4,125 to say 4,500 next year.
Needless to say, in the remote event we see this in 2025 or 2026, I would buy (quality) stocks with my ears pinned back.
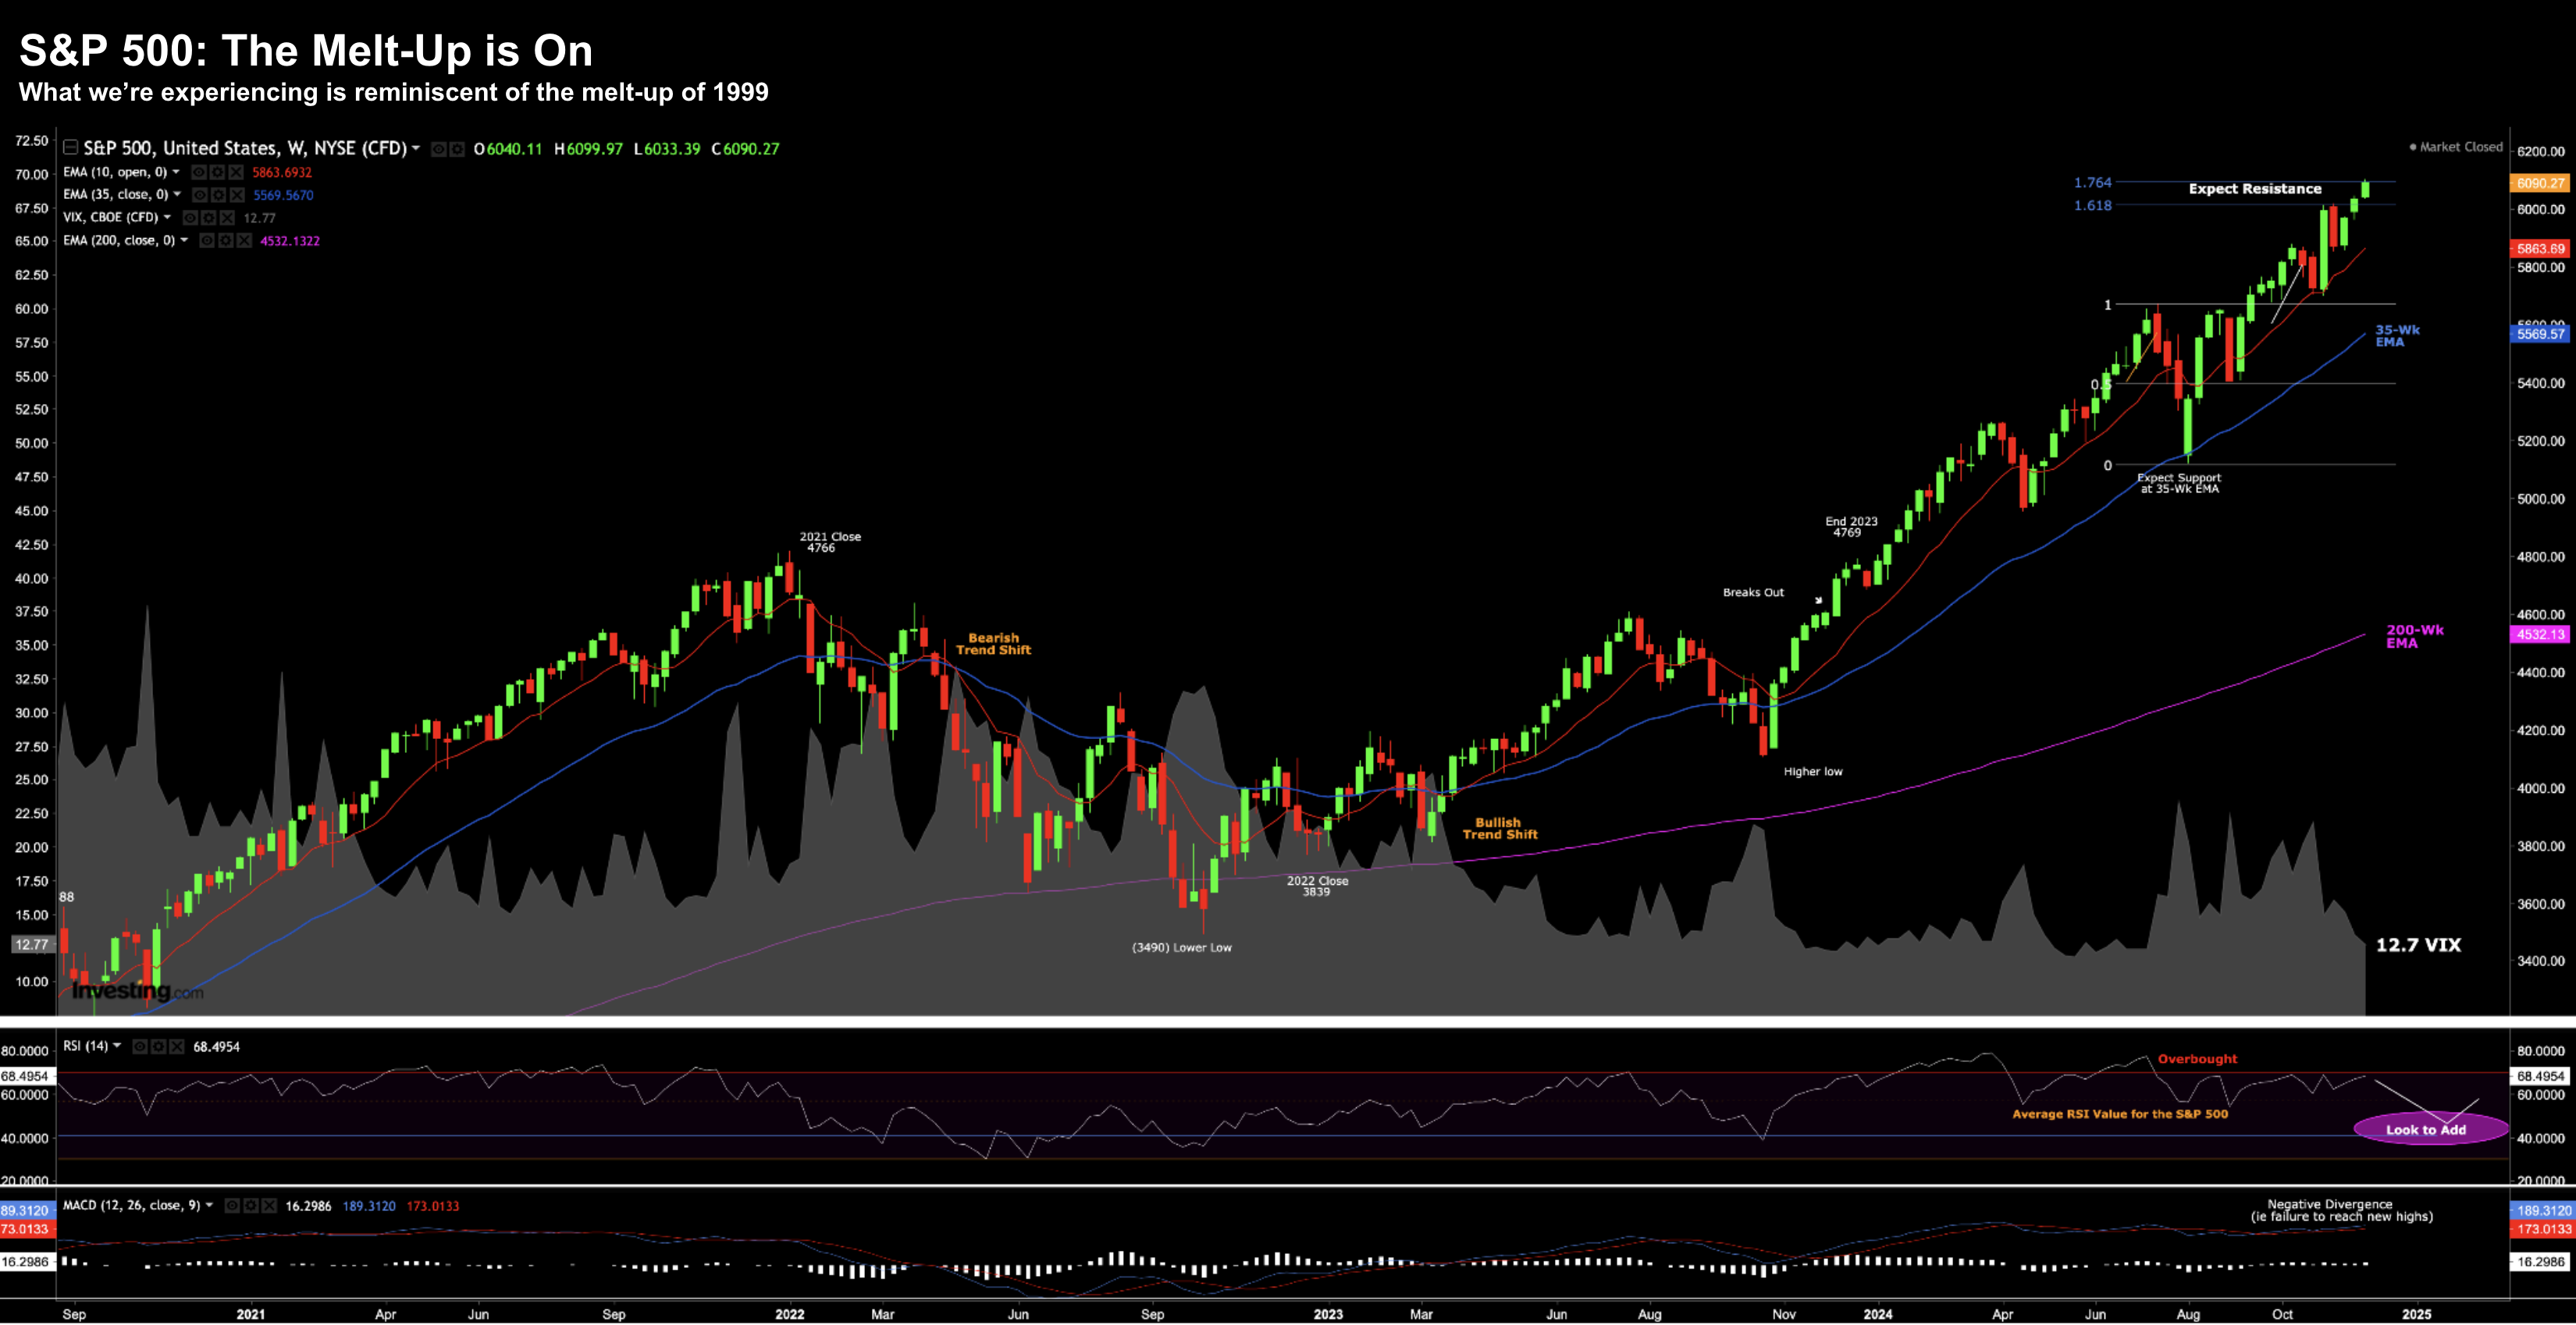
Let’s review the weekly chart…
Dec 7 2025
The other month I said this reminds me a lot of what we saw during the melt-up of 1999.
For example, investor sentiment was very similar… as multiples for stocks continued to expand well beyond any earnings growth.
And whilst the events of the dot.com bust may not repeat – investors are taking on a lot more risk at these levels.
Fundamentally I can’t offer many good reasons to be aggressive with the market at this price.
It’s difficult.
For example, if the 10-year nominal yield was say 1% (i.e., negative in real terms) – then maybe I could get myself to a forward multiple of 20x (even then it’s difficult).
I remain 65% long with hedges in place (e.g., rolling 60-day out-of-the-money put options each month using a 0.5 delta; allocating 0.5% of my capital)
My expectation on these puts is simply insurance against my ~65% long position.
I expect these puts to lose money each month (i.e., no different to the money I surrender each month insuring my various properties, car and other assets).
However, should we see a 10-20% correction in any one month, the position will more than pay for itself.
Technically the market has not changed since Trump won the election.
That is, we continue to inch up towards the 61.8% to 76.4% zone — where I expect some resistance.
And whilst we could easily continue to rally further – that only increases the risk of downside.
💥 Putting it All Together
For me, this game is all about managing risk.
My objective is very simple:
Do not make large costly mistakes.
And whilst I remain optimistic on the outlook with more pro-growth (fiscal) policies – I’m not comfortable with the prices the market is asking for that growth.
That could mean I need to sit tight for a few months yet… as investor greed takes over.
I don’t pretend to guess the timing…
But for now, I’m happy not trying to pick up pennies in front of a steamroller.
We will see if my caution is warranted over the next 12-24 months.

