- Brace for lower Q2 earnings and guidance
- Companies reporting increased wage pressure
- Keep your eye on the EUR/USD… the next headwind
Following a ~8% bounce off the June market low – my suggestion was to “sell the bounce”
I don’t think it’s a rally you should chase… not yet anyway.
For example, I think we remain in a bear market until we see:
- a definitive Fed pivot on monetary policy
- Q2 earnings revisions priced in; and
- the pattern of lower highs and lower lows reverse
So far we are a solid ‘zero for three‘.
Now it’s possible we see this pivot towards Q4 after a series of rate hikes – but it’s not here yet.
Inflation needs to come down materially (and it could).
And with respect to earnings and guidance – they’re on approach – with banks to kick things off next week (which in turn will give us a great read on the consumer).
But I bring good news…
My view is we’re much closer to the bottom than the top (further to my recent missives)
Now the market gave back some of its recent gains to start the week… ahead of a host of key data points (including the highly-anticipated CPI later this week).
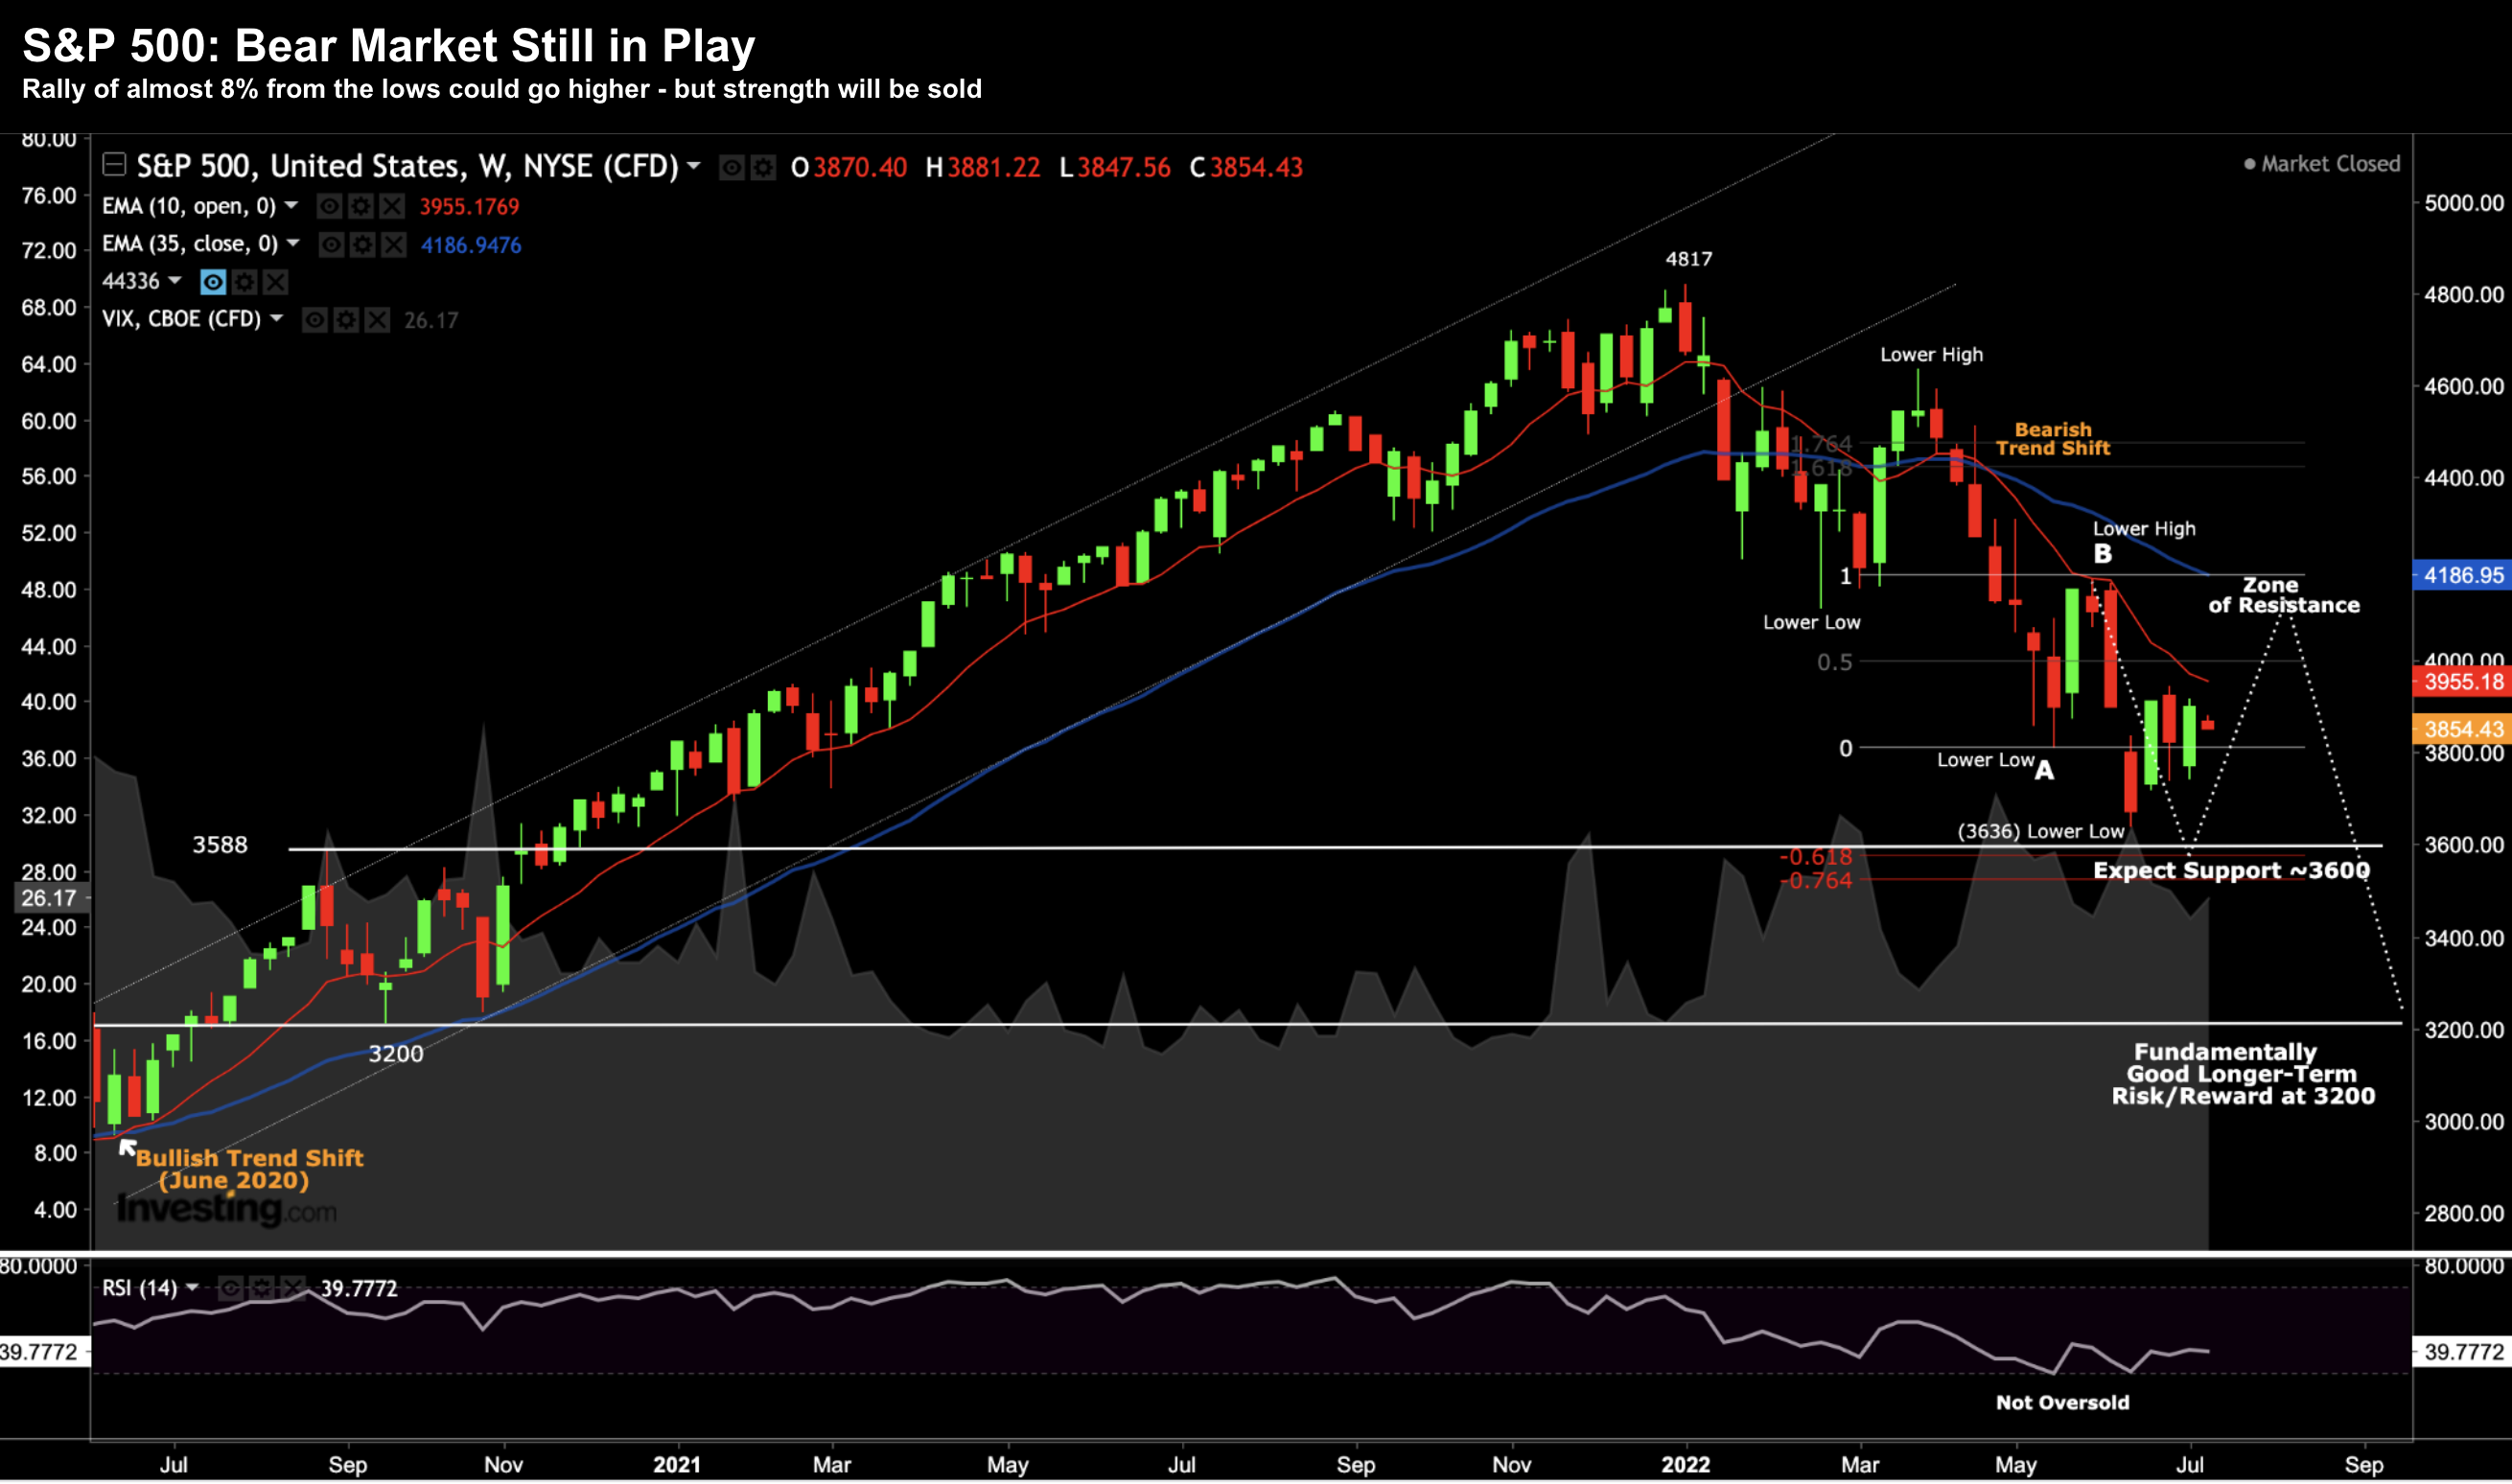
Let’s start with the weekly S&P 500 chart:
July 12 2022
It’s been a nice bounce from the 3636 lows the week of June 13.
My best guess was this market could at least rally to 4000 (~10-week EMA) in the near-term; and best case 4200 (~35-week EMA).
However, somewhere in that zone I felt we would see selling pressure.
What I don’t like about the weekly chart is the pronounced lower highs and lower lows.
From that perspective, what I would really like to see is the market exceed the 4200 high (labelled “B”); and hold that level. That would result in a higher high.
And from there, I would like to see the next sell down (from that level) make a higher low (i.e. higher than 3636)
For now, the technical set up tells us to expect another retest (and possibly break) of 3636.
And the primary reason?
Potentially lower than expected earnings for Q2 and forward guidance.
The Pinch of Higher Labor Costs
Outside a Fed pivot – my primary cause for concern are forward earnings.
I’m less worried about what we saw in Q2 (expect minimal growth) – but what we see looking ahead to the second half of the year.
And that cause for concern is input costs – specifically higher wages.
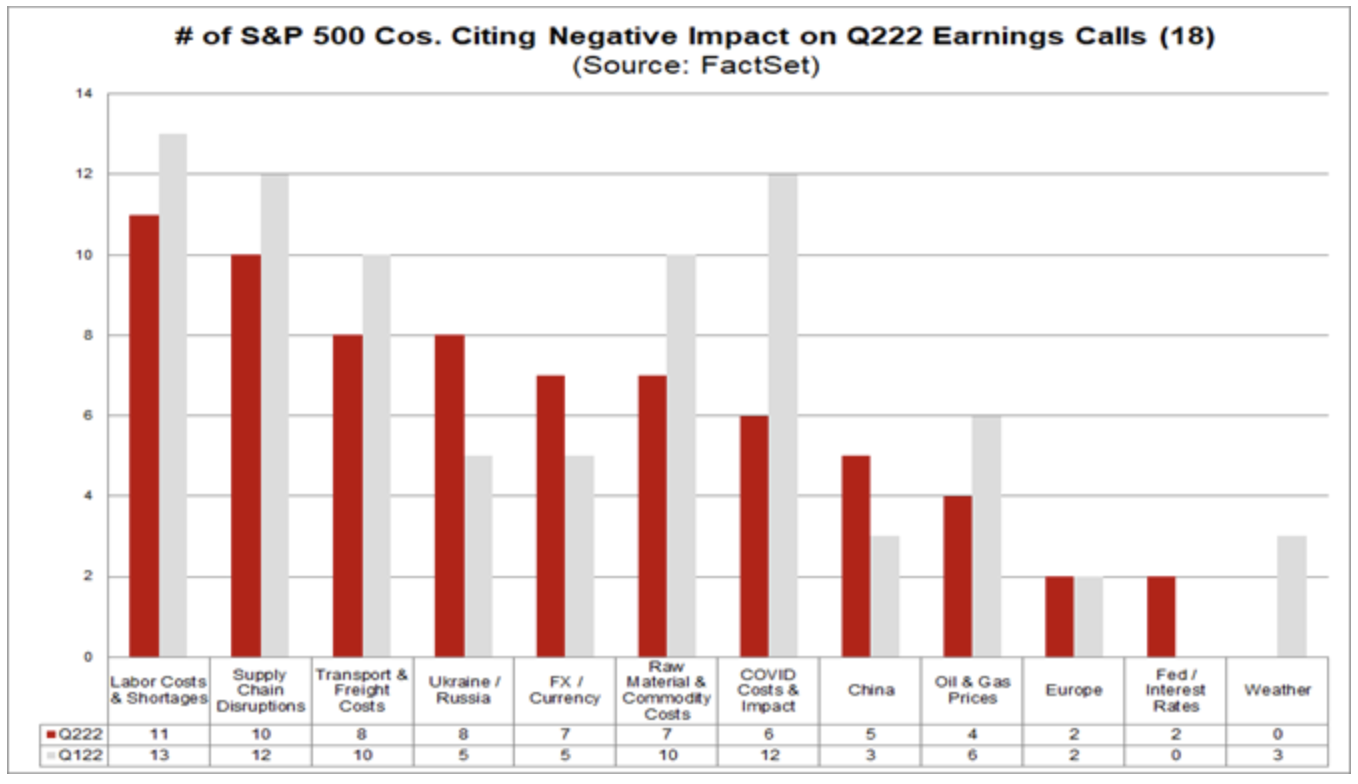
Here I cite the latest trend from Factset’s John Butters (where ~4% (or 18) of all S&P 500 companies have reported):
FactSet searched for specific terms related to a number of factors (e.g. “currency,” “labor,” etc.) in the conference call transcripts of the 18 S&P 500 companies that conducted second quarter earnings conference calls through July 8 to see how many companies discussed these factors.
FactSet then looked to see if the company cited a negative impact, expressed a negative sentiment (e.g. “volatility,” “uncertainty,” “pressure,” “headwind,” etc.), or discussed clear underperformance in relation to the factor for either the quarter just reported or in guidance for future quarters.
What this table shows is 13 of 18 companies called out labor costs and shortages as a current (and near-term) headwind.
Next were supply chain costs and disruptions (12/18) followed by higher freight / logistics costs (10/18)
But perhaps what’s most interesting from the small 4% of companies who have reported is despite the headwinds – we have seen an average (year-over-year) earnings growth of 8.5% for Q2.
The current expectation for $235 per share represents only 4.3% for Q2 for the index as a whole.
However, I think we will see this come down over the course of the next 4+ weeks (e.g., where companies such as Apple and Amazon report July 28)
FX Currency Headwinds
Another important takeaway from Factset’s (early) Q2 earnings insight is only 5 of 18 companies (28%) have reported foreign exchange (FX) as a headwind.
I think this will could fall in the ‘top 3‘ challenges sighted this quarter (and subsequent quarters).
For example, we’ve already heard earnings (and revenue) warnings from the likes of Microsoft and Salesforce citing the impact(s) of FX.
When it comes to a stronger US dollar – look no further than its largest counterpart – the Euro (EUR).
The other week I said the EUR is approaching parity with the USD – and is likely to fall below.
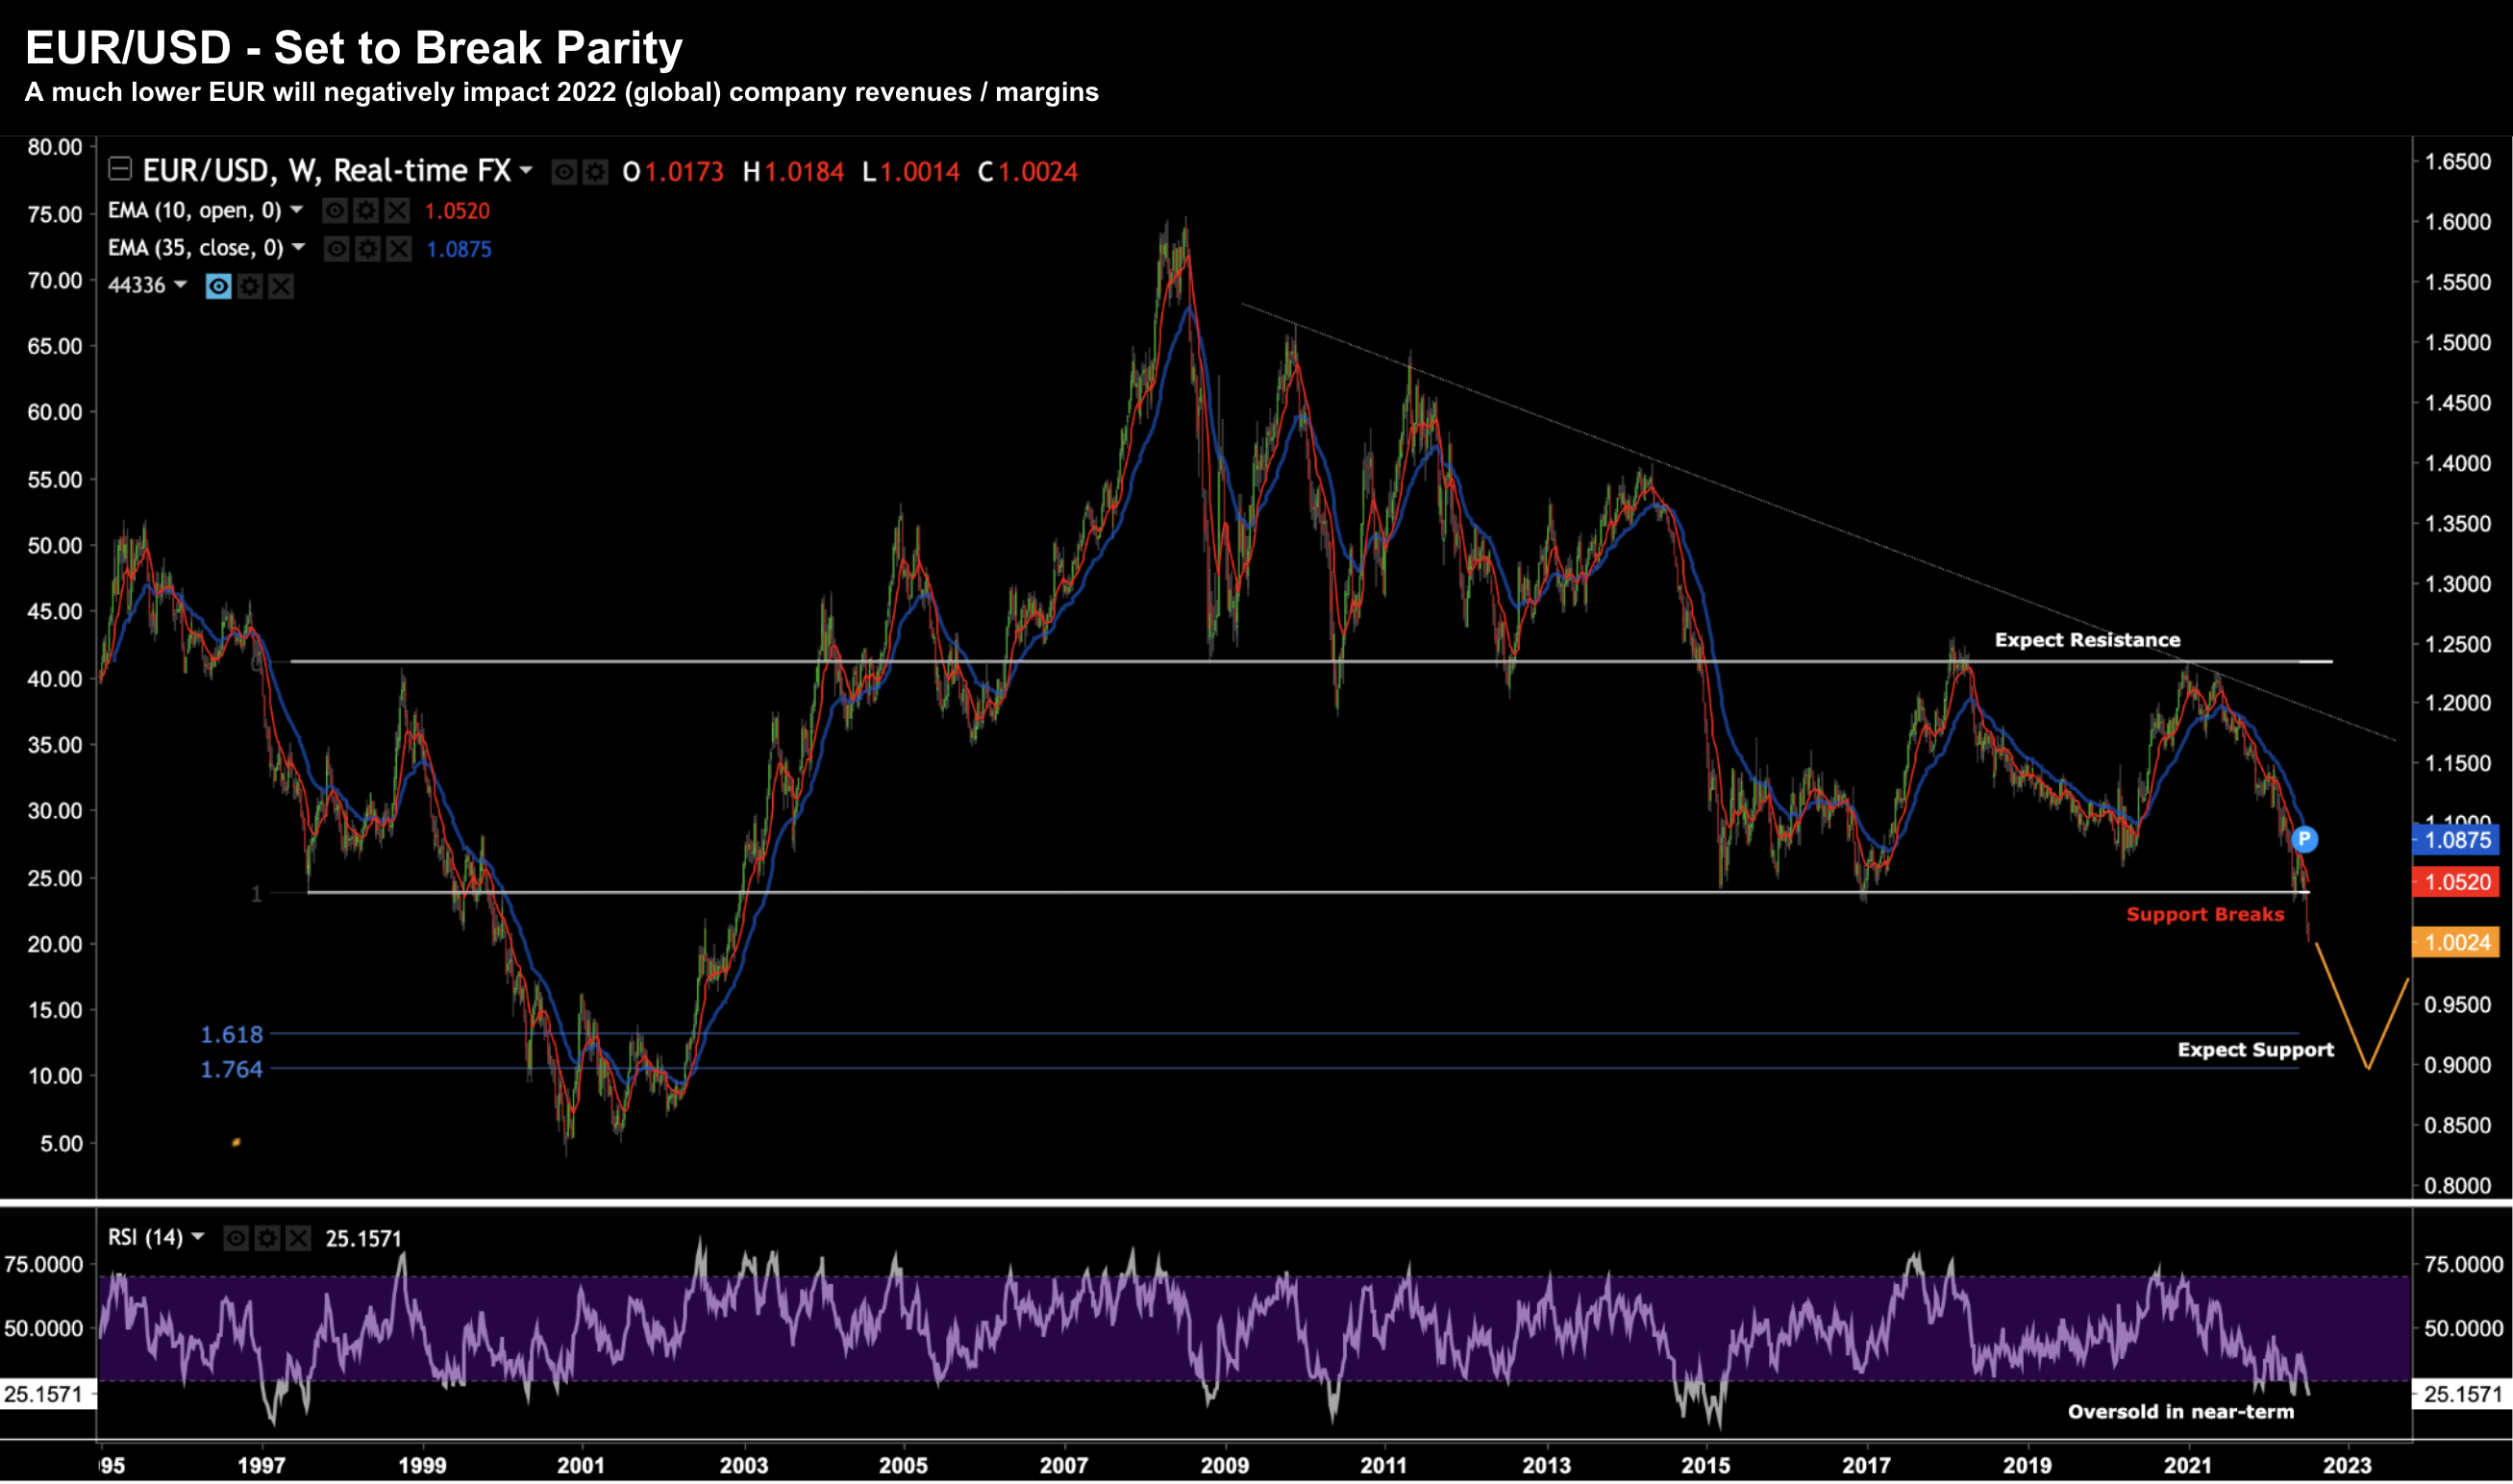
Let’s update the chart:
July 12 2022
Technically the key (long-term) support level of 1.05 has broken.
At the time of writing, the currency pair is trading 1.0025 and looks certain to challenge the zone of 0.90 in the coming weeks and months.
That said, we look to be oversold in the very near-term – so expect a bounce on the way down.
The 12% fall in the EUR so far this year is straight forward:
Fears of a European recession loom marge across the continent — stoked by high inflation and energy supply uncertainty caused by Russia’s invasion of Ukraine. From CNN:
The European Union, which received roughly 40% of its gas through Russian pipelines before the war, is attempting to reduce its dependence on Russian oil and gas.
At the same, Russia has throttled back gas supplies to some EU countries and recently cut the flow in the Nord Stream pipeline to Germany by 60%.
Now that critical piece of gas import infrastructure in Europe, has been shut down for scheduled maintenance due to the last 10 days. German officials fear that it may not be turned on again.
With respect to curbing unwanted inflation of around 8.6% YoY – the ECB announced that it will hike interest rates this month for the first time since 2011.
Not unlike their peers at the Fed – the ECB are also a “long way behind the curve” – tightening into a rapidly slowing economy.
For example, Germany recorded its first trade deficit in goods since 1991 last week as fuel prices and general supply chain chaos significantly increased the price of imports.
From the same CNN report:
“Given the nature of Germany’s exports which are commodity-price sensitive, it remains hard to imagine that the trade balance could improve significantly from here in the next few months given the expected slowdown in the Eurozone economy,” Saxo Bank foreign exchange strategists wrote in a recent note
Putting it All Together
A lot of the market has priced in the above.
Consider bond yields – they have come down sharply (a good thing) – suggesting that inflation could now be ‘rear-view’ mirror.
For example, I cited 5-Year ‘breakevens’ last week – falling from 3.50% to just 2.50%.
This is a welcomed development…
What’s more, leading commodities like iron ore, lumber copper and coal are more than 20% of their recent highs which suggests demand is falling.
Another ‘positive’ sign in the fight against sustained inflation.
And whilst WTI Crude has pulled back from its ~US$130 high – it’s also likely to remain above $90 per barrel given the fundamentals of constrained supply (thanks to the war in Ukraine).
Put together, what we face over the next year or two is a growth based recession.
And unlike say 2000 and 2008 – it may not be as formidable.
However, it is an economic contraction and will effectively force down earnings estimates from analysts (which we are yet to see at scale).
From mine, with forward S&P 500 EPS in the range of $205 to $220 (which is much lower from Factset’s current 4% YoY growth target of $235) – that puts us in the realm of 3200 to 3500 (based on a PE multiple of 15.5x)
The good news:
We’re much closer to the bottom than we are the top.


