- Stocks are at record highs – here’s a good reason why
- PCE Inflation offers the Fed mixed signals – as services heat up
- Consumers losing confidence (but not investors)
Money supply.
When it expands – it’s typically very good for stocks.
For example, the S&P 500 index is said to appreciate at an average annualized pace of 14.02% when liquidity expands. More on this later with a 60-year chart.
Therefore, it pays for investors to know whether money supply is expanding or contracting.
As they say, it’s always easier swimming with the tide.
But before we get to that – during the week we received personal consumption expenditures (PCE) inflationary data for January.
This is a very closely watched metric.
Core PCE is the Fed’s preferred measure of inflation – and is likely to determine when they start to ease rates and at what velocity.
January’s data suggested stickier elements of inflation (e.g., services) remain uncomfortably high – rising their fastest clip in decades.
Here’s my question: can service sector inflation cool without economic pain?
Some think so – I’m less convinced.
Services Stubbornly High
- Core PCE (ex. food and energy) up 0.4% MoM; and 2.8% YoY (inline w/expectations);
- Headline PCE (inc. food and energy) up 0.3% MoM; and 2.4% YoY (inline w/expectations).
- Personal income rose 1.0%, meaningfully above the 0.3% expected; and
- Spending decreased 0.1% vs 0.2% expected;
The market cheered the news as blended PCE was mostly inline with expectations (i.e. 0.4% MoM and 2.8% YoY).
Many still feel we will achieve the Fed’s 2.0% objective by the end of the year (if not H1 2025) – paving the way for at least three rate cuts.
And that’s certainly plausible…
That said, there are not usually big surprises with PCE. For example, two weeks prior we receive both consumer and producer price inflation – which serve as primary inputs to Core PCE.
As a result, the market typically knows what’s ahead. However, the devil is in the detail.
For example, what’s specifically rising or falling?
Services and food were the main drivers of price pressures last month – while durable goods spending declined.
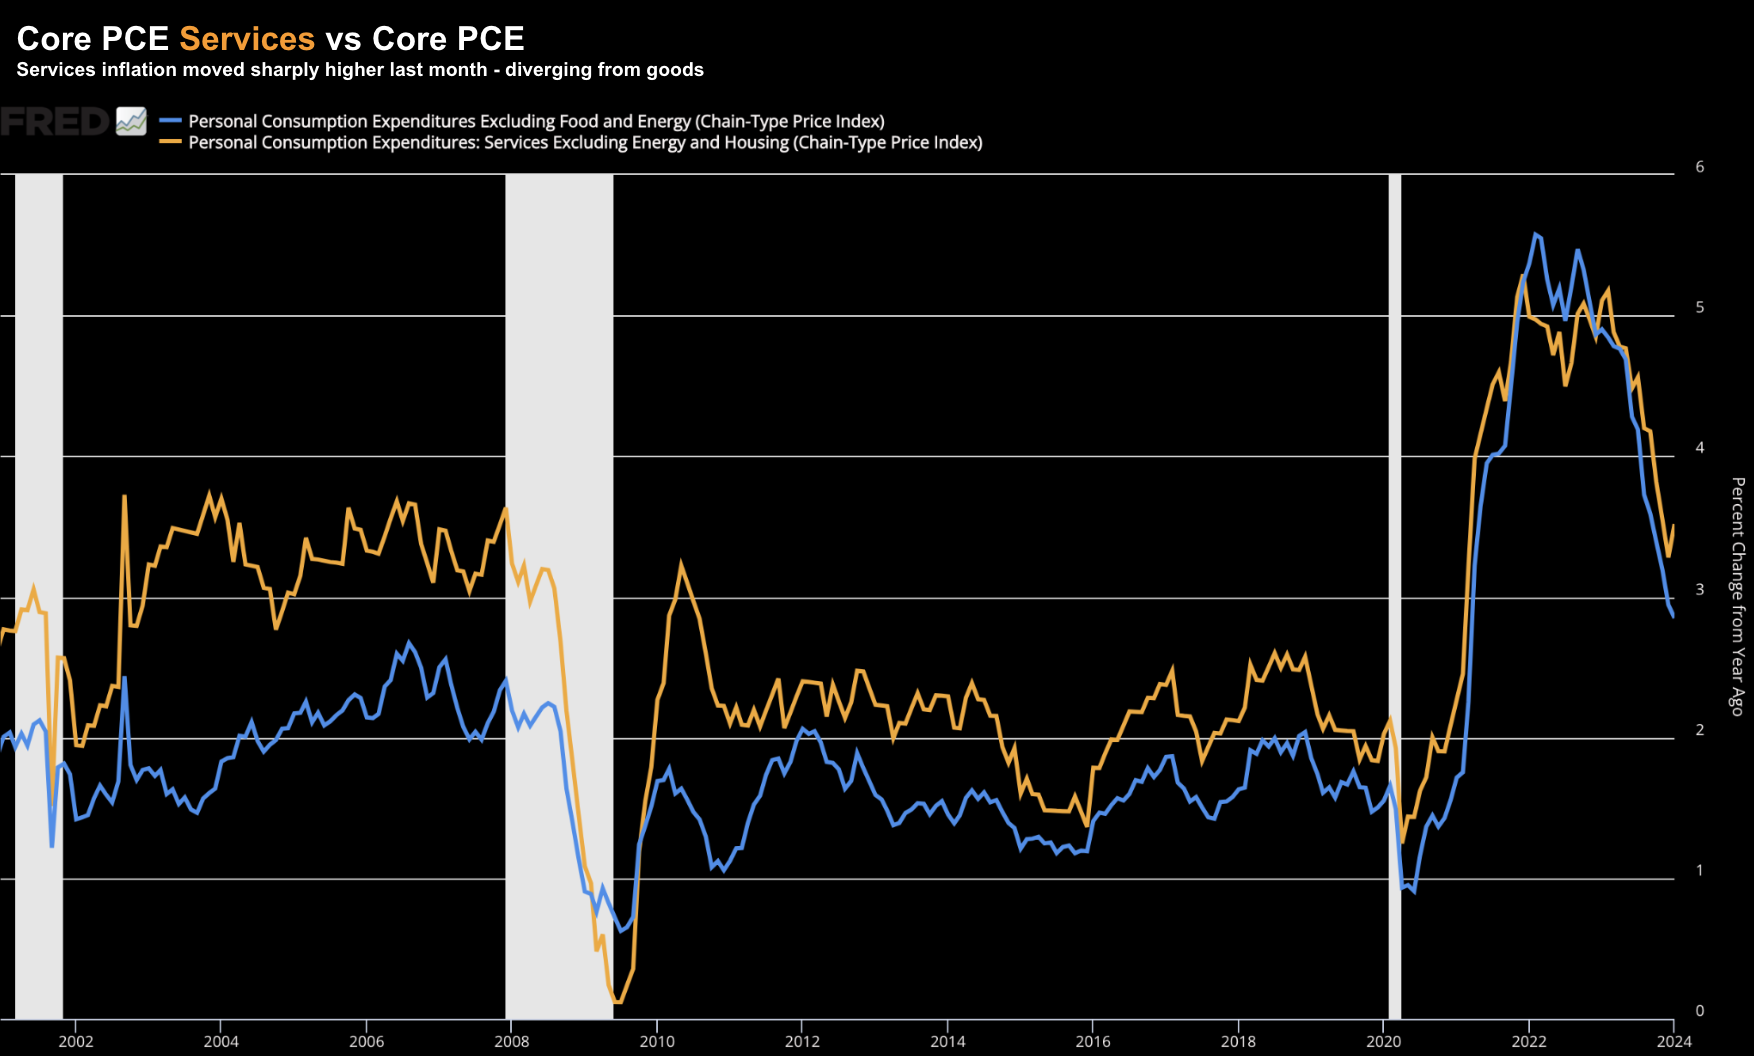
Services prices increased a sharp 0.6% MoM (its fastest pace in years) and food prices were up 0.5% MoM.
The chart below compares Core PCE Services inflation (orange) vs blended PCE (i.e., inclusive of goods prices – blue)
Feb 29 2024
Here we’re able to visualize the divergence between the two over the past month.
This is my concern:
Services inflation is far stickier vs the price of commodities and goods.
That’s because the so-called “inflation onion” peels from the outside in (and not the inside out).
In other words, commodities and goods will fall first and fastest.
However, getting services inflation down is more difficult as it’s a labor-intensive category.
Therefore, we need to look at the trend in input costs such as wages (and real-estate) to gauge whether this is likely to come down.
How does the Fed reduce service sector inflation?
Not easily.
Generally it requires labor force reduction and wage freezes (or cuts).
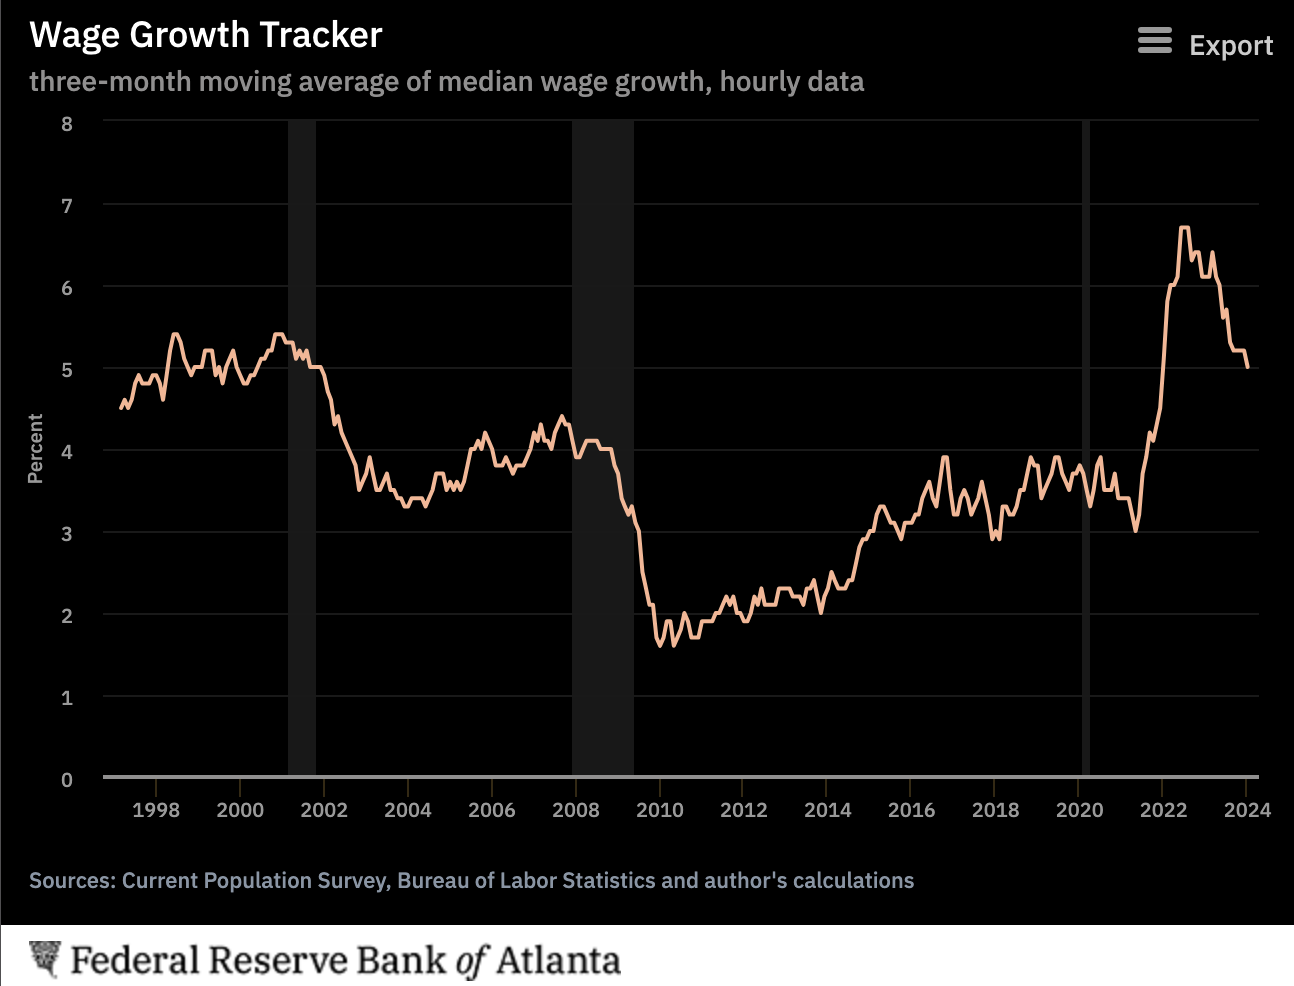
According to the Atlanta Fed’s Wage Growth Tracker – wages are still increasing almost 5.0% YoY (based on the moving three month average) – however well down on the earlier pace of ~7% YoY).
The Fed’s targeted range for wage growth is in the realm of 3.0% YoY
Feb 29 2024
The ‘good news’ is we’re seeing early signs of cooling in the labor force. However, for all intensive measures, the labor market remains tight.
And as we saw in January’s data – personal income rose 1.0% – meaningfully above the 0.3% expected.
This is not helpful when it comes to cooling inflation.
The other labor force metric worth tracking is what we find with job openings (‘JOLTS’).
If openings are high – it follows that employers often need to pay more to attract talent (as workers have options).
According to the Fed – there are stil ~9M job openings across the US – well above what we saw prior to the pandemic. That’s a tight market.
In addition, the overall US employment rate is just 3.7% – where anything below 4.0% is considered close to full employment.
In summary, it’s hard to see how the Fed can use monetary policy to reduce service sector inflation.
Increases in wages and the costs associated with real-estate are driving up the input costs for the service sector.
From there, business owners are being forced to pass these higher costs on.
Unfortunately, we might need to see unemployment closer to ~4.5% if service sector prices are to ease meaningfully.
Further Cracks in the Consumer
During the week I cited a couple of concerning consumer data points.
For example, we find further evidence of rising credit card delinquencies – now at levels we have not seen since 2012 across all commercial banks.
And we are at 2008 highs for smaller banks.
What’s more, consumer’s savings rate is similar to the lows we saw during 2008/09.
This week we learned that consumer spending adjusted for inflation contracted last month.
This echoes the weaker retail sales report from approximately two weeks ago and lower consumer confidence.
With respect to consumer confidence – this from MorningStar today:
The final reading of the consumer sentiment index dipped to 76.9 in February from 79.0 in January, according to data from a survey carried out by the University of Michigan released Friday.
The reading was weaker than expectations of economists polled by The Wall Street Journal, which expected it to remain at its preliminary, mid-month reading of 79.6
Now PCE told us consumption only rose 0.2% MoM – down sharply from December’s 0.7% MoM increase.
Question: are consumers less willing or less able to spend?
Maybe both – I don’t know.
However, the data does tell us that people are spending more of their money on services (vs goods).
In summary, there is plenty in the PCE print for the Fed to ask questions.
And specifically, I think they question the 0.6% MoM increase in service sector prices.
That’s not supportive of a decision to cut prematurely.
Money Supply Starting a New Phase
We know markets are said to work in cycles.
Money supply growth is no different.
However, it’s not often cited by the financial media.
Money supply oscillates between expansion and contraction pending the state of the economy (and more specifically – price stability).
For example, when inflation was running hot (Feb 2021) — the Fed worked hard to reduce the supply of money.
Inflation is defined as excess money chasing too few goods.
The Fed can do little with respect to the latter (e.g., it can’t make more ‘things’) – however it can determine the quantity of money in the system.
Whilst inflation ran hot – money supply growth contracted at its fastest clip in decades (-9% YoY) as of April 2023 – where the S&P 500 was trading just above 4,000 points.
However, over the past ~10 months, it has begun to expand. And not surprisingly, stock prices have reacted in kind.
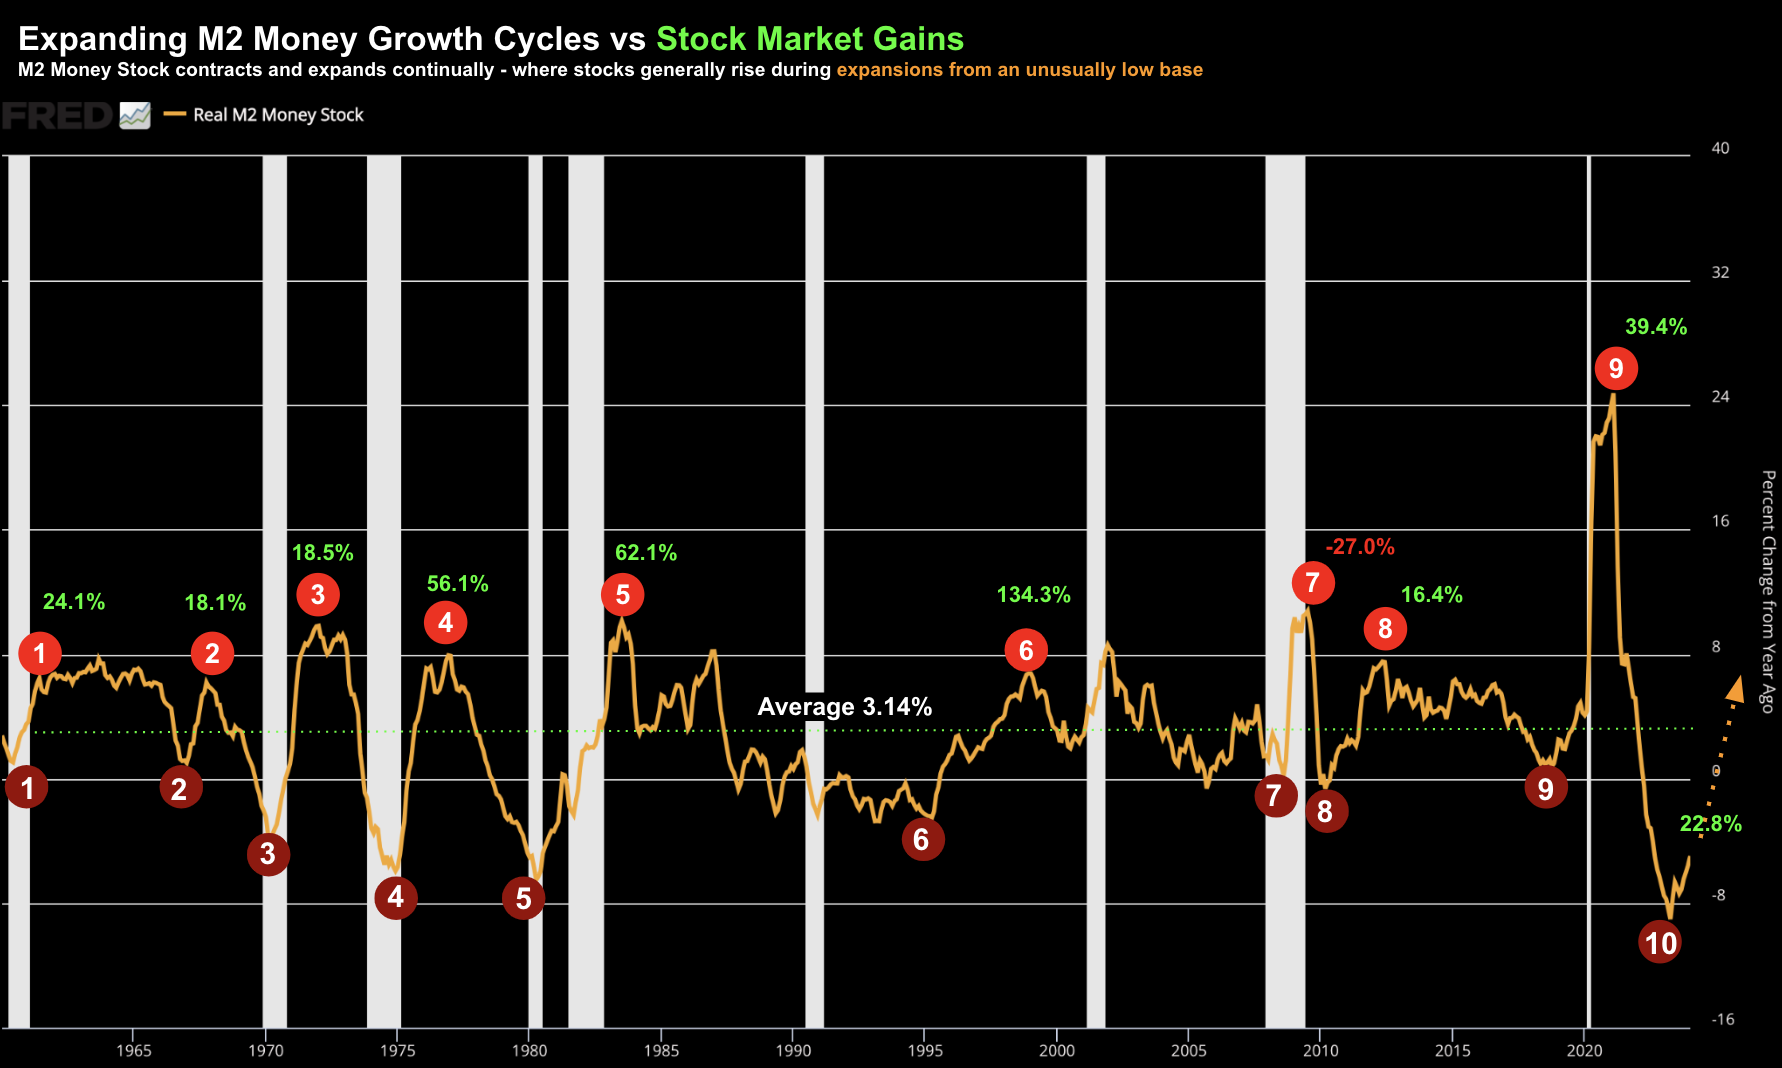
To help demonstrate the correlation – below is a 60-year chart – identifying 9 money growth cycles which start from excessively low contractions (i.e. well below the mean of 3.14% per year – dashed line)
That latest contraction (point labelled “10”) is as low as we have seen in over five decades.
And in green, are the S&P 500 gains (or losses) during that specific growth cycle:
Feb 29 2024
During 8 of those 9 expansionary cycles – the S&P 500 averaged gains of ~38% through the entire cycle.
The average annualized gain was ~14.02% during expansions… vs roughly 7.9% when the Fed is contracting money supply.
2008 was the only time the market lost money during a growth in money supply.
On average, M2 Money Supply will expand around 3.14% per year.
And pending what we find with price stability – the Fed will contract money supply well below that level (e.g., most recently -9.0%)
However, that typically spells opportunity for investors.
What’s the lesson?
When money restoration cycles turn higher from a point well below the mean of 3.14% growth- typically the timing is to asset speculator’s advantage.
As we can see, M2 growth still has a long way to go to revert to the mean of 3.14%.
And on the assumption that’s what’s likely to happen – is it not unreasonable to think stocks could continue to rally whilst money supply grows.?
I think so.
Put another way, we can obsess over when the Fed starts to cut rates and by how much… or what next month’s Core PCE number will be… however the growth in money supply (and its current direction) suggests this will be generally supportive of asset prices.
Speaking of which…
Stocks Hit New Highs
It’s said “higher highs beget higher highs”.
That’s been the case this year.
So far stocks have rallied over 23% since the Fed started this new phase in money supply.
Obviously it’s impossible to predict how much further stocks could go – but chances are it could be meaningful.
That said, price appreciation never happens in a straight line. And from my lens, stocks continue to look over-bought in the very near-term.
Feb 29 2024
Very little has changed from last week…
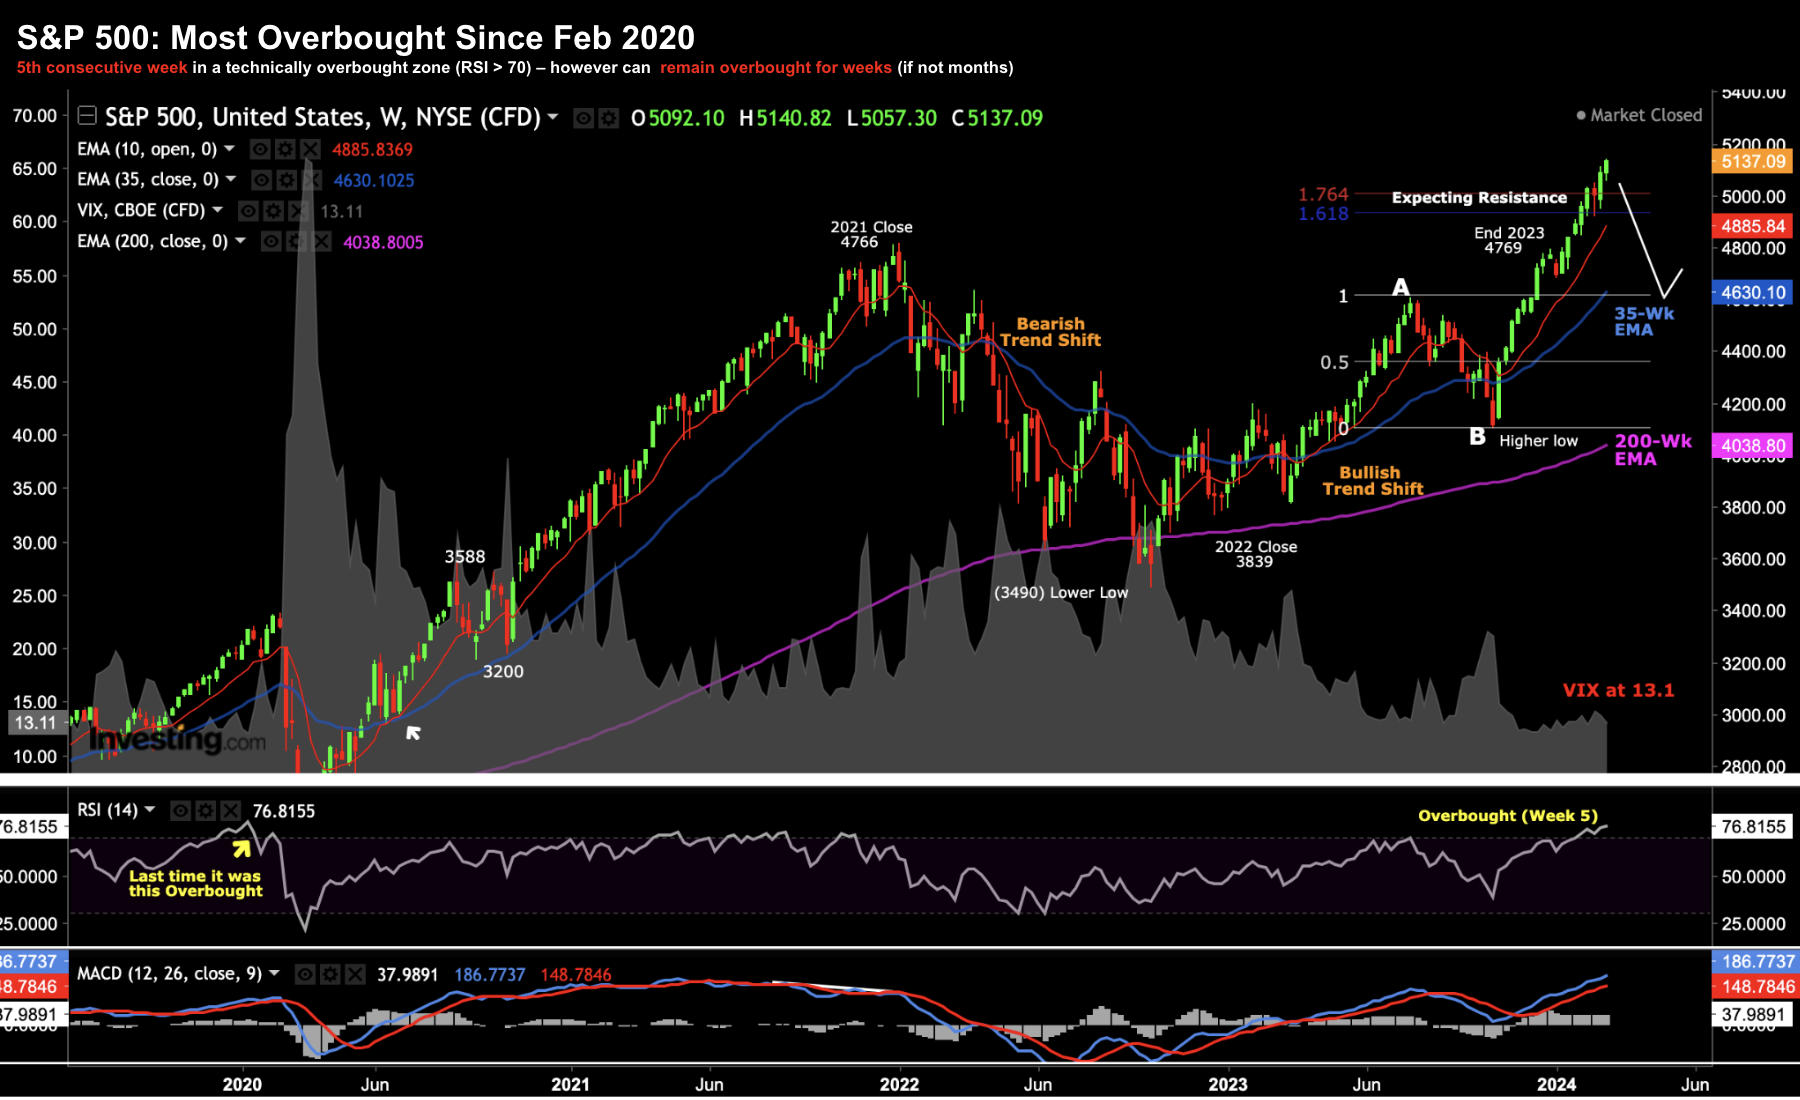
Perhaps what stands out is the weekly RSI – now its 5th consecutive week above 70.
That’s overbought.
The last time we saw something like this was February 2020 (we know how that ended).
But as I’ve reminded investors of late – the market can remain overbought for several weeks.
This is another great example. It’s not a sell signal in isolation.
From mine, it’s a brave person who is willing to stand up and short this market – that’s not me.
And if I were thinking standing in front of a freight train – I would do it by buying put options.
Not only are put options cheap with the very low VIX – you also limit your downside risk should stocks continue to rally. In other words, you can only lose what you outlay.
I still believe that stocks will correct to the tune of more than 10% at some point in the first half of this year – but timing is impossible to predict.
From there, stocks will likely find strong support around the 35-week EMA or 4600.
This would represent a forward PE in the realm of 19.6x (if we assume EPS of $235 or ~11% growth YoY)
And in terms of an equity risk premium – a fwd PE of 19.6x equals 5.1% – which is roughly a 1% premium to owning the 10-year treasury.
For me personally – that’s not compelling.
Putting it All Together
Services rising 0.6% MoM will give the Fed cause for concern.
The blended PCE of 2.8% YoY is encouraging – but to get back to the Fed’s goal of 2.0% – services will need to cool.
And this will only come from declining wages and an overall softening in the labor market. As it stands today – the labor market remains tight (with over 9M open positions)
Beyond inflation (and speaking from an investor’s perspective) – liquidity growth looks as though it’s on a pathway to eventually mean revert (i.e., back to the 60-year 3.14% annualized average).
If that assumption holds true – it’s likely to be supportive for asset prices.
Does liquidity growth by itself trump all other economic and political risks?
Not necessarily.
For example, during 2008 when the money supply continued to expand – stocks corrected sharply.
And we could see that again.
Remember – stocks are already up over 23% since the start of the liquidity expansion cycle. That’s not immaterial.
That said, we should recognize that money supply expansion is generally far more supportive for stocks than contraction. And if you’re a raging bear (and I’m not) – that’s working against you.
For now, the contractionary phase appears to be behind us.


