- The Magnificent Seven and risks it poses to the Index
- Revisiting the opportunity with the Equal Weighted Index
- Ultimately everything reverts to the mean (tech won’t be an exception)
In the game of asset speculation – mean reversion suggests that over time an asset will eventually return to its average price if it drifts or spikes too far from that average level.
As part of this post – I explained why the concept of mean reversion is very important for investors to understand.
If applied, it can often help you avoid paying too much.
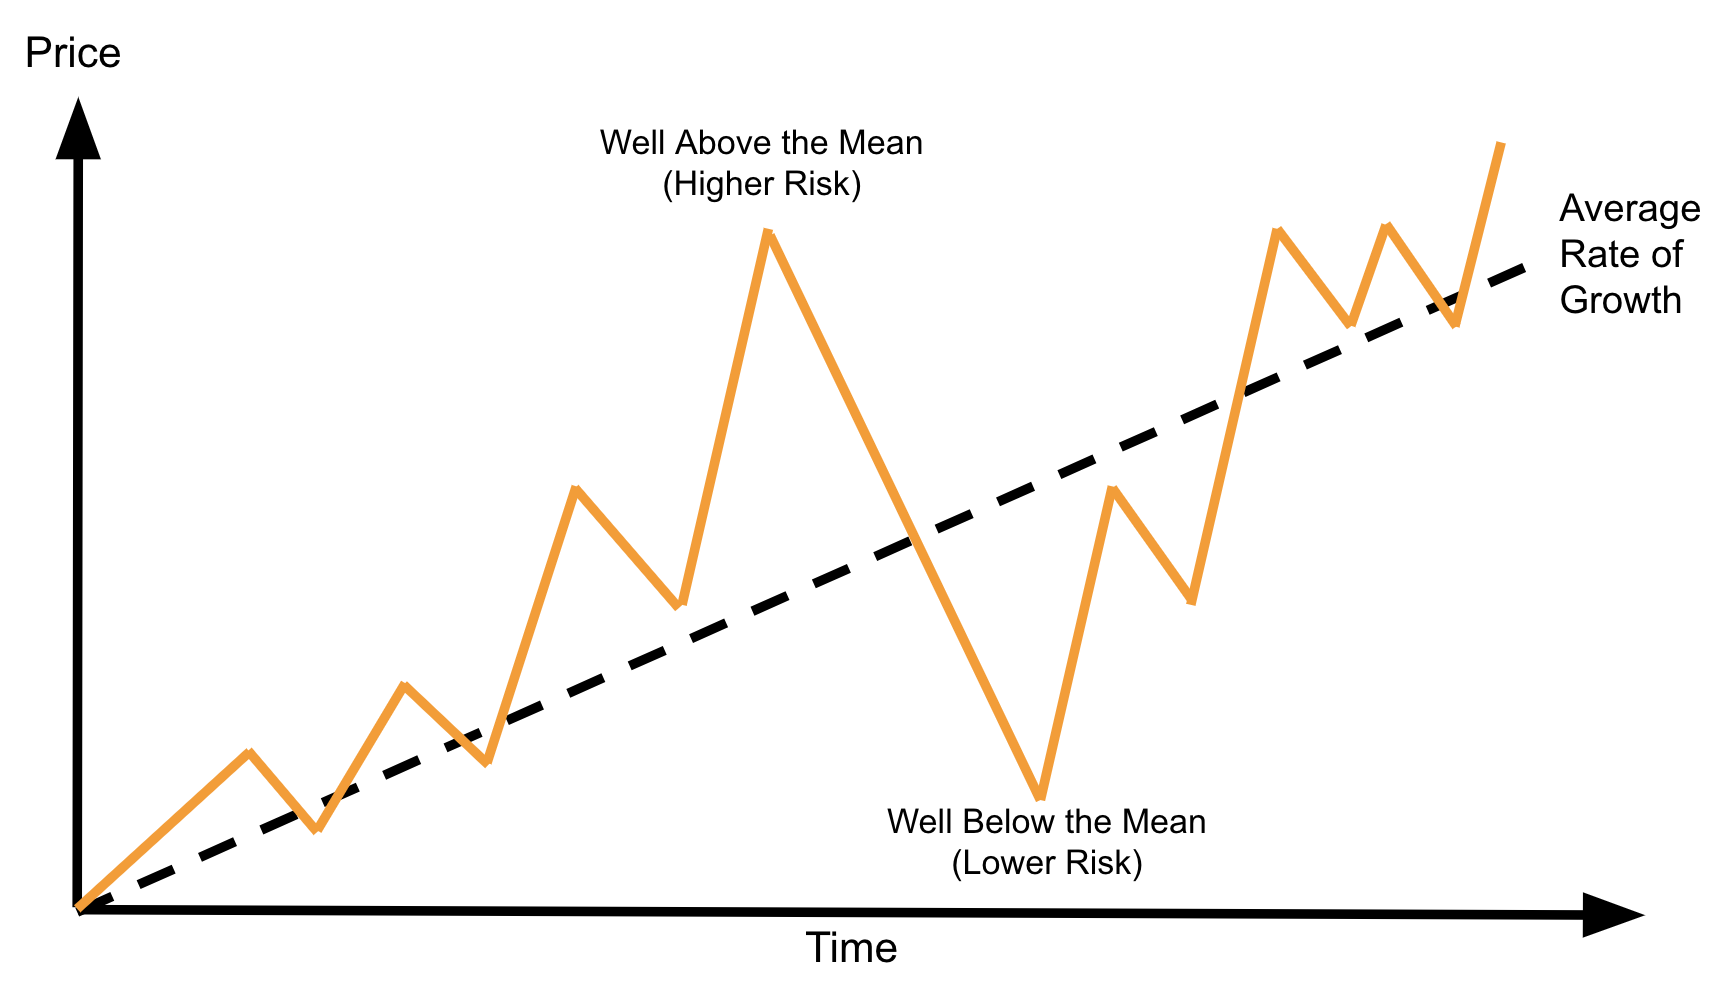
The principle is illustrated below:
Drawing on my basic diagram – the dashed line represents the average rate of growth (i.e., the mean)
The orange line could be a stock price, the price of copper, property, gold or the benchmark Index.
Over time it will grow at an average annual rate.
For the S&P 500 – that is around 8.5% exclusive of dividends.
For real-estate in excellent locations – it’s typically between 5-6%.
Now at certain points it will drift sharply above and below that average (mostly due to the human emotions of fear and greed)
In turn this creates both risk and opportunity.
As I explained yesterday, my thinking is the S&P 500 has now drifted too far from the longer-term average.
And as history shows, inevitably prices will mean revert.
This week, I read a terrific opinion piece from John Authers who writes for Bloomberg.
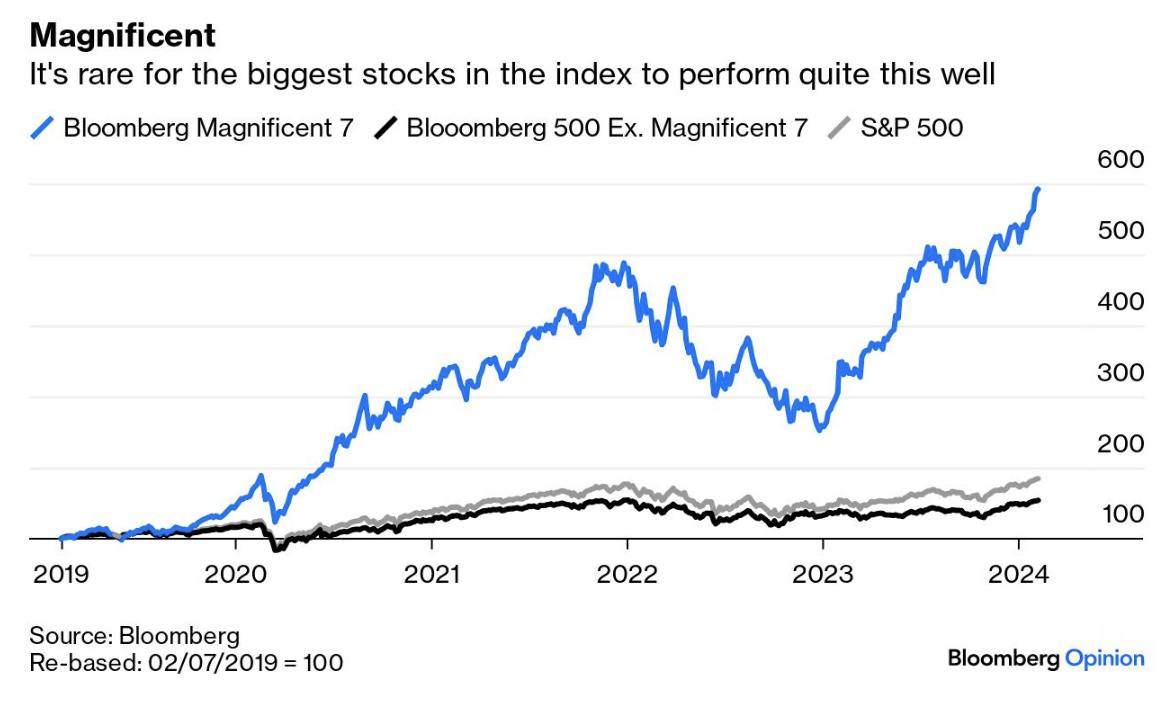
He touched on the subject of mean reversion – highlighting the (concentration) risks to the broader Index with the so-called “Magnificent Seven” (M7)
In his words “it’s rare for the biggest stocks to perform quite this well”
This will be a familiar story to regular readers – as it’s something I’ve been warning of for several months.
What follows draws from Auther’s post and the work of several industry analysts.
As I mentioned a month or two ago – I think it would prudent for investors to consider diversifying into the equal weighted index (via the ETF RSP) – hedging potential mean reversion risk (due to the skew with tech).
Let’s explore…
The Opportunity with Equal Weight
“From mine, the dense concentration in a handful of tech names adds to the risks heading into 2024. That said, narrow market rallies can continue for sometime. Put another way, they are not a sign the market is about to reverse course imminently. All it simply suggests is the risks are now higher”
Authers’ echoes my sentiment on the apparent ‘dense concentration’ risks – drawing parallels to the dot.com bubble.
However, what surprised me is tech’s share of the Index today is higher now than what it was during 1999/2000.
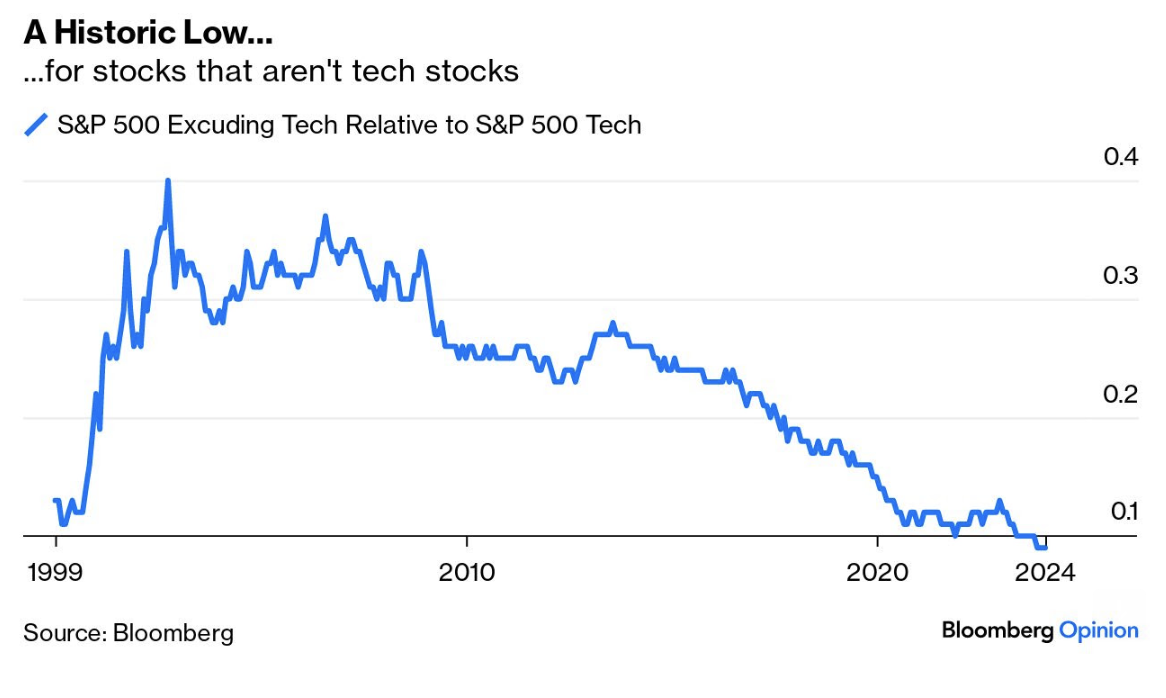
To demonstrate, he offers the following chart:
Here we see the ratio of S&P 500 excluding technology relative to the S&P 500 tech sector – going back to the beginning of 2000.
Never before have the concentration risks been this high. He adds:
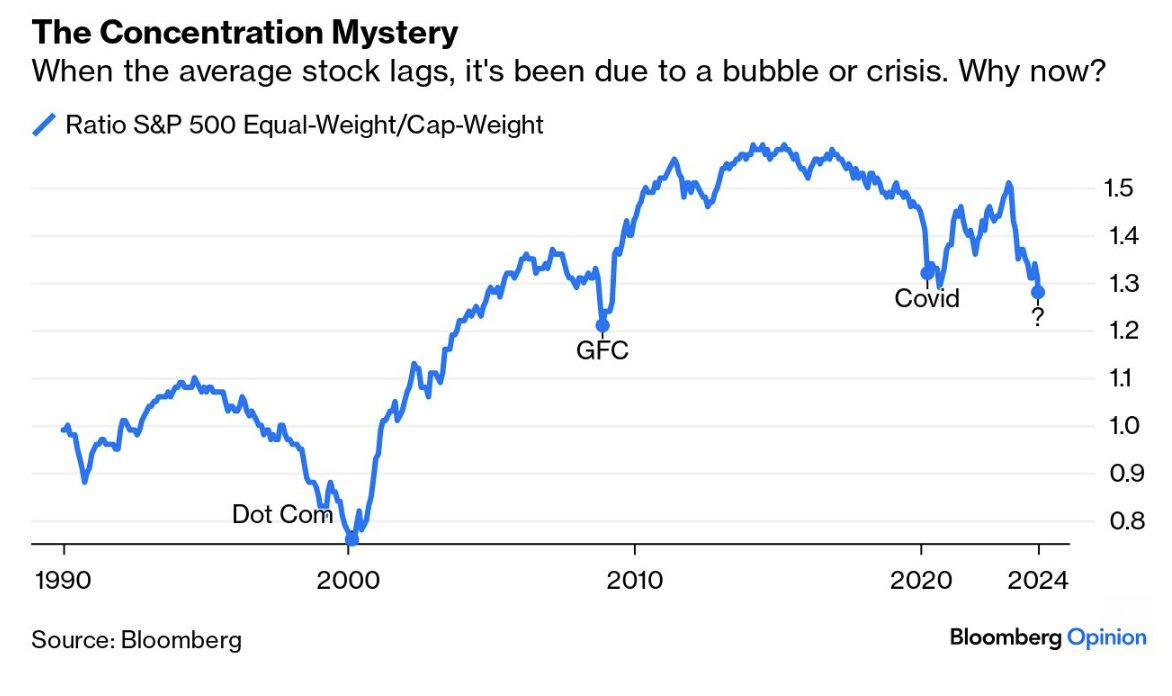
Equal-weighted indexes, which neutralize the effects of large market cap, offer another way to analyze this.
It shows the performance of the S&P 500’s equal-weighted version, in which each stock accounts for 0.2% of the index, effectively capturing the “average stock” against the cap-weighted version.
Most of the time, the equal-weight does better, because it isn’t so heavily skewed to companies whose good news has already been priced in.
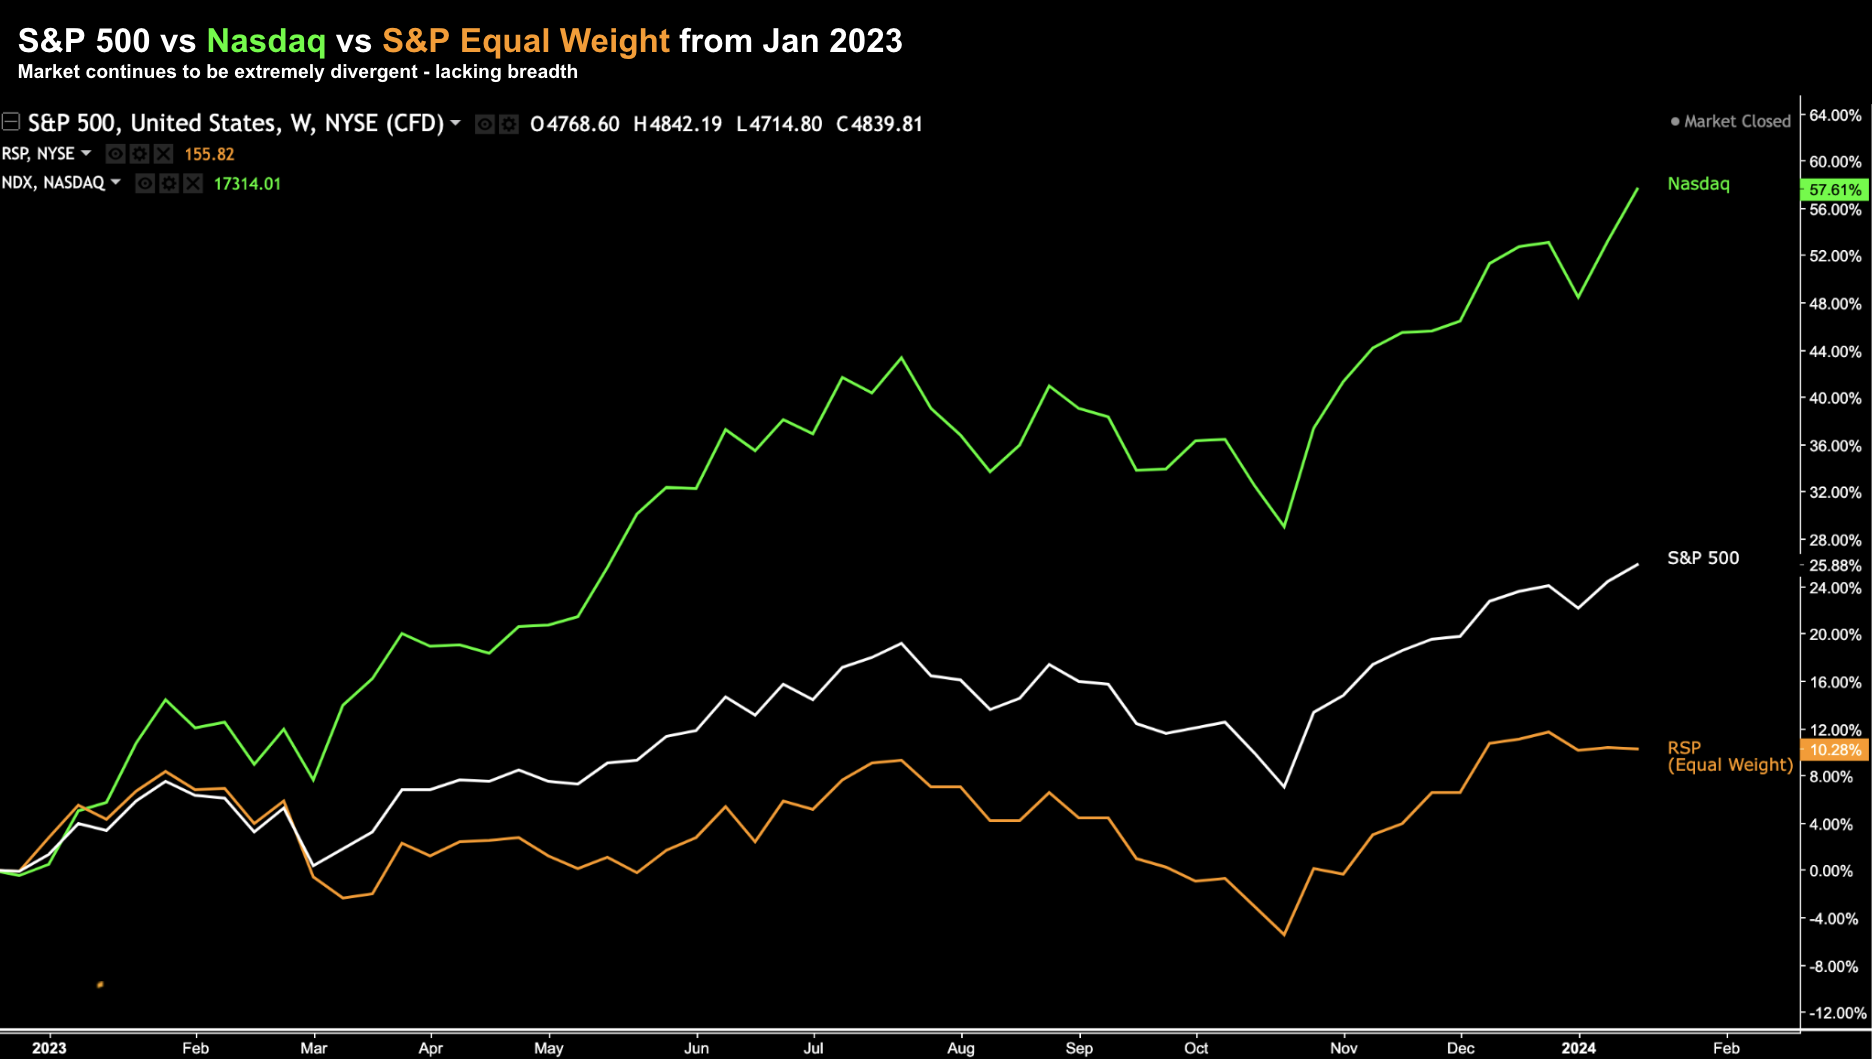
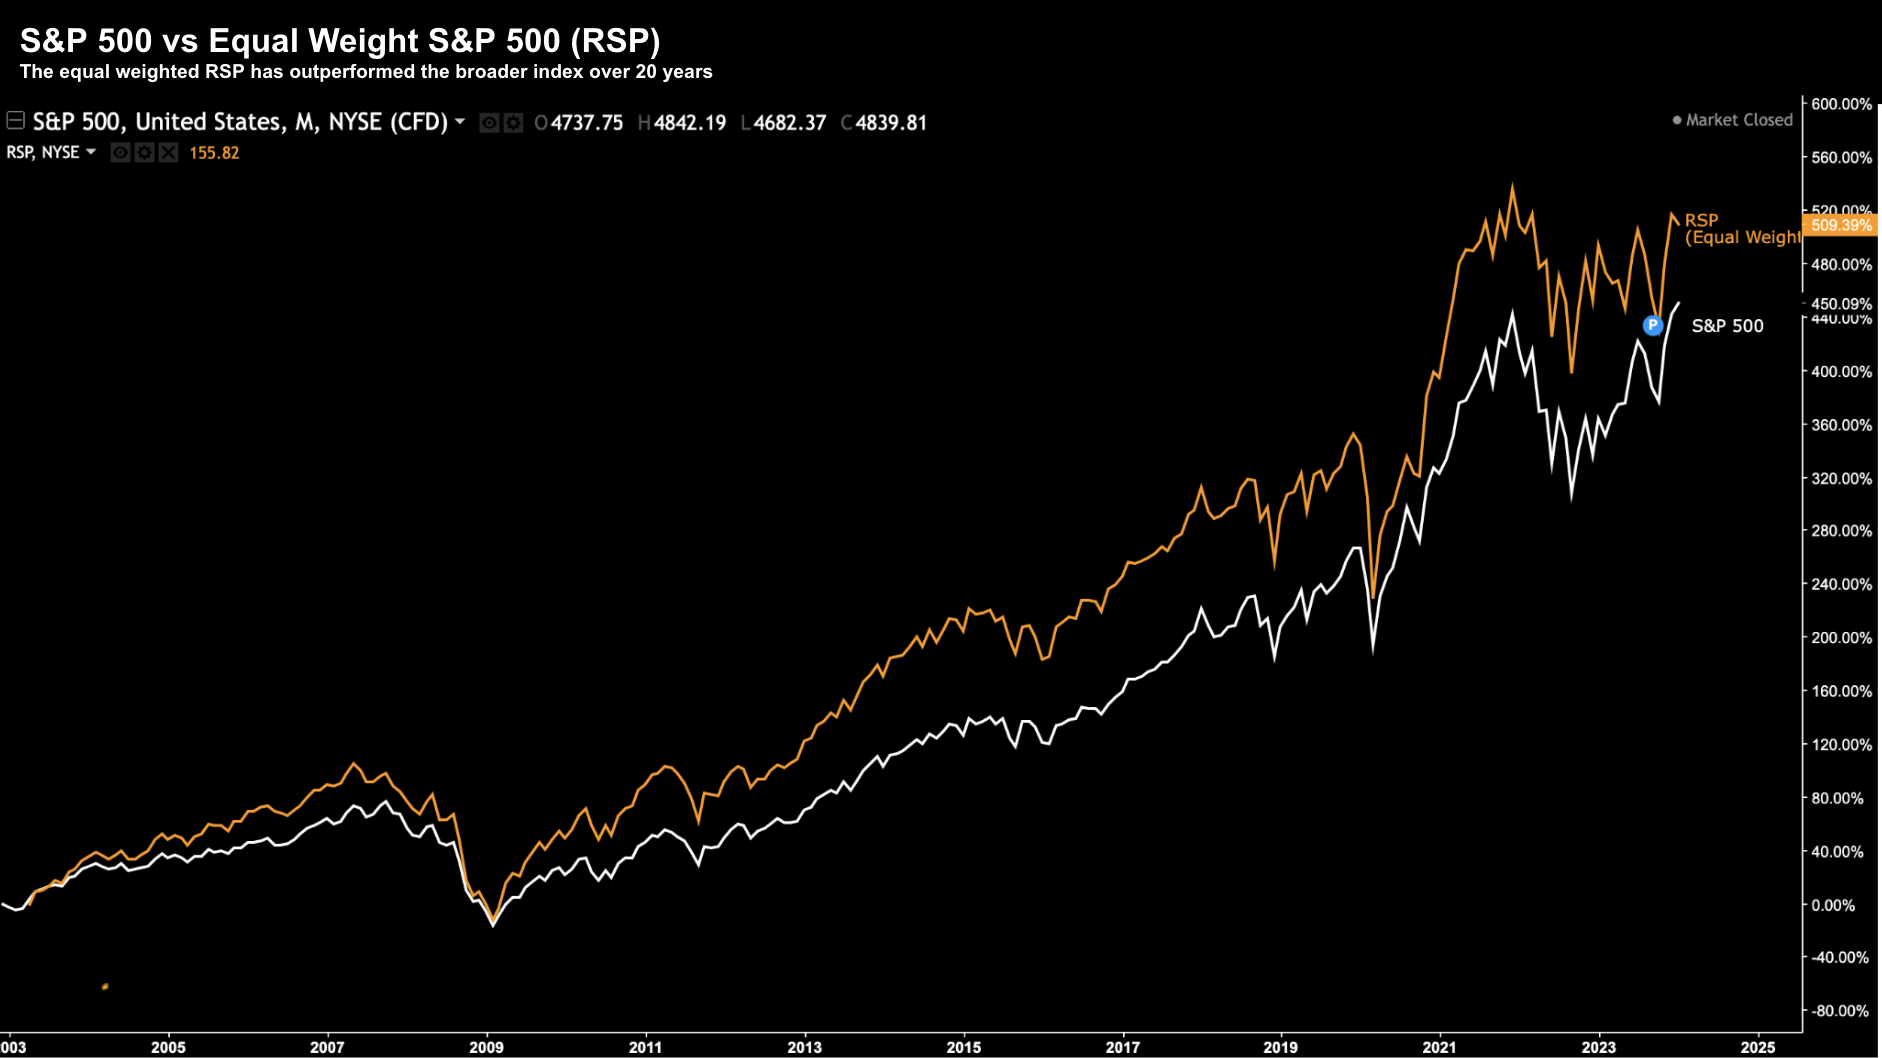
I made a similar point on the relative outperformance of the equal weighted index over time – offering this chart:
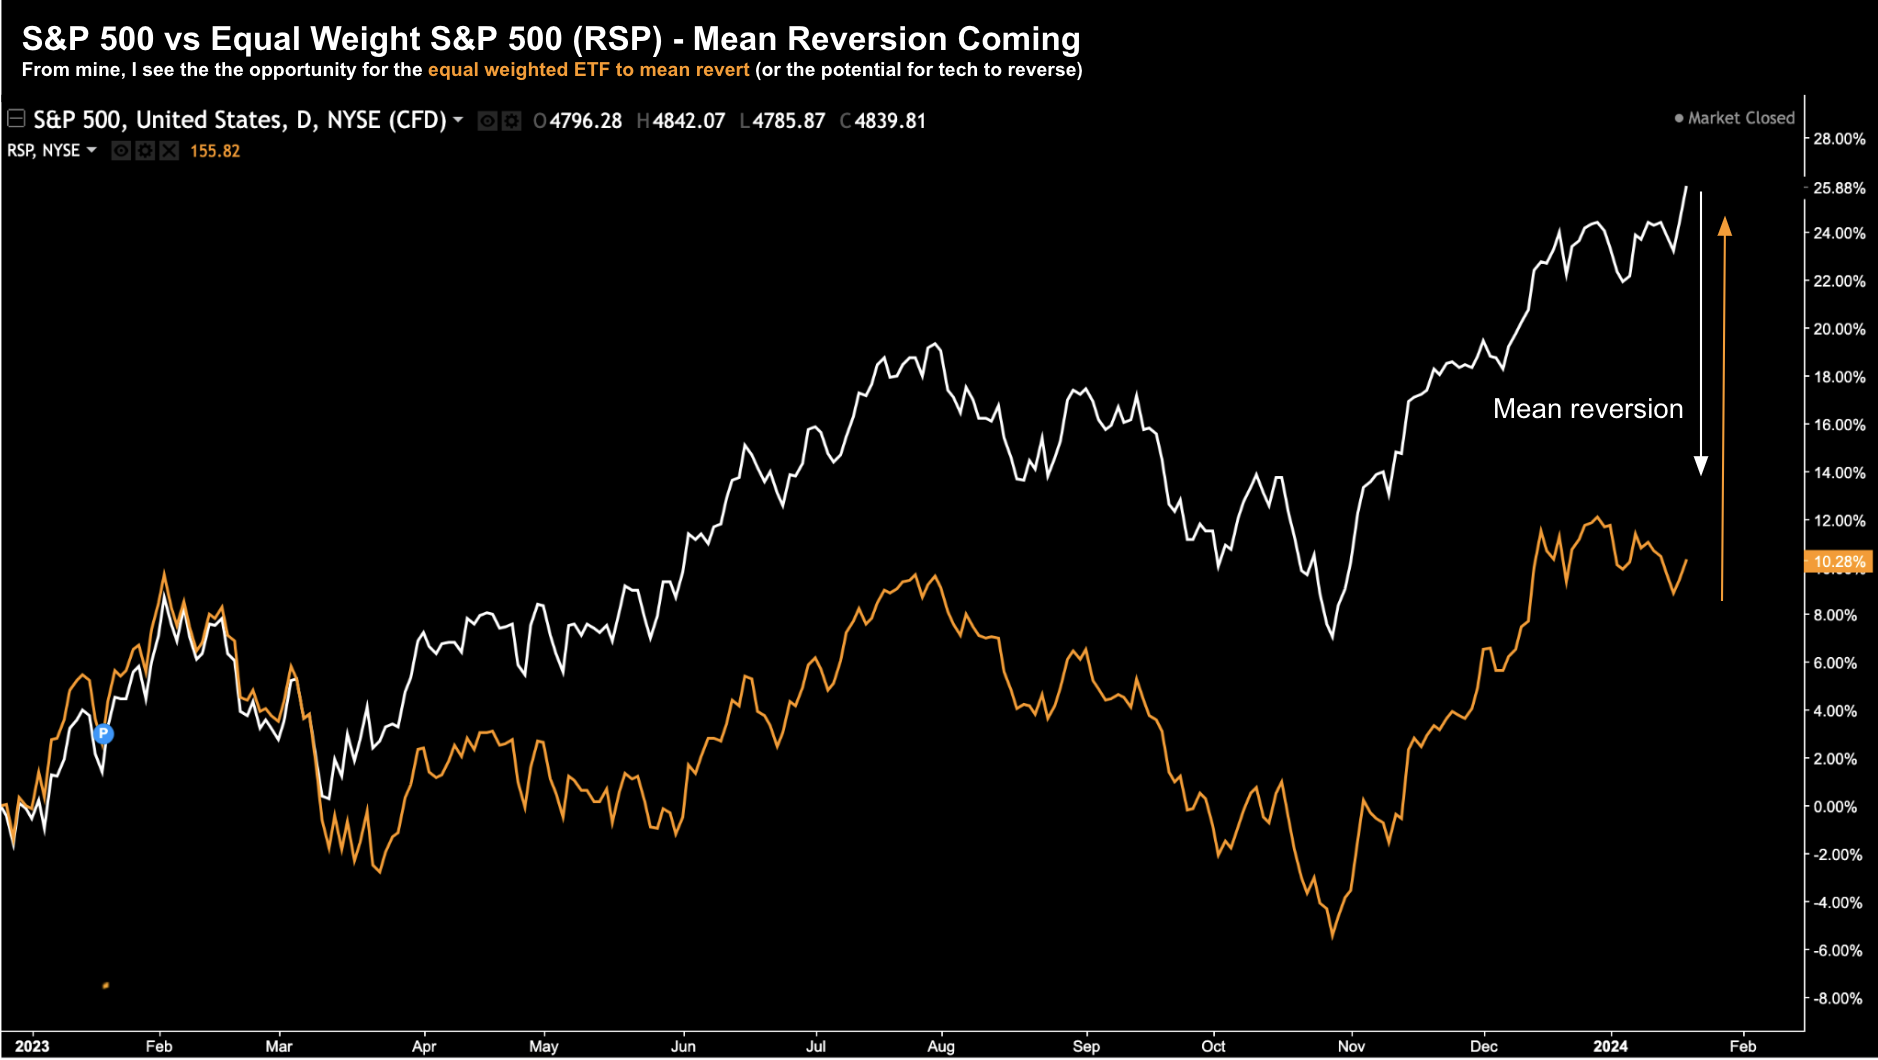
However, over the past 12 months, we’ve seen (rare) underperformance from the equal weighted index (entirely due to the M7 skew)
Quoting his Bloomberg Opinion article:
Periods when the equal-weight markedly underperforms are rare. They tend to come during periods of serious stress (such as the Global Financial Crisis or the Covid pandemic, or to a lesser extent the bear market surrounding the Gulf War of 1990-91), or during a bubble (as happened with the dot-coms in 2000).
Now it’s arguable whether we’re seeing a bubble in tech.
Yes, it’s true they are a greater proportion of the overall benchmark Index.
However, forward earnings ratios for the M7 average ~35x – which is a lot lower than what we saw during the peak of the internet bubble (which was closer to 45x)
Therefore, it’s worth asking why the equal weighted sector has performed so poorly the past 12 months:
Authers argues that the (M7) valuations cannot make sense (to which I agree)
For example, the US stock market is now about 70% of world market capitalization.
However, the US economy at ~$22.6T Real GDP is less than 18% of the world’s output.
Put another way, markets are implying that “over the next 20 years, less than 20% of the world economy will earn three times more profits than the remaining 70%”
That’s an aggressive assumption.
And whilst companies like Apple, Microsoft, Amazon, Google and Nvidia etc show great promise – I don’t see them making 3x more profits than the remaining 70% of companies.
But I could be wrong.
Overly Optimistic?
One more compelling to chart to share…
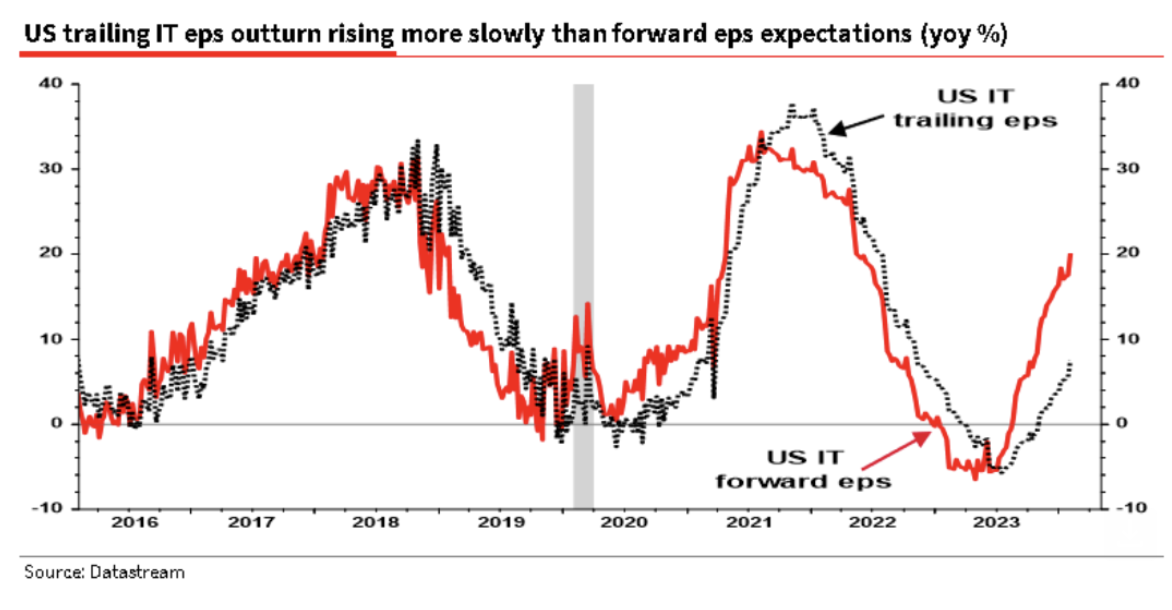
This one shows how high expectations are vs trailing earnings.
Authers says whilst the M7 stocks are all very profitable, strong well-run companies – it’s hard to simply chalk their dominance up to the fundamentals.
Using the chart below, Albert Edwards of Societe Generale demonstrates that whilst tech’s earnings are rising – they are doing so much more slowly than their forward-earning forecasts.
Now one reason is the lofty expectations around yet-to-be-proven tech such as Artificial Intelligence (AI).
Will AI deliver the massive windfall profits investors are expecting?
It might but at this stage, I think it’s far too early to know.
I talked about my personal experience (and thoughts) working in the tech sector for 27+ years here (and more recently AI from 2016)
In any case, it’s clear investors are almost willing to pay a lofty premium to find out.
Putting it All Together
Index investing has been a very profitable strategy for investors over the long run.
And I suspect this will still be the case.
For example, if your timeframe is more than 10-years, buying the Index today around 5,000 will probably work out just fine.
It may not be 10% (that’s hard to say) but it probably won’t be too far off.
However, there are near-term risks.
Those risks have been created due to the dense concentration of just a few expensive stocks.
Investors can look to offset those risks by allocating a portion of their fund towards the equal weighted index.
For example, instead of these 7 “magnificent” stocks comprising more than 30% of the Index, they will constitute just 1.4% (i.e. 7 x 0.2%)
For me personally, I’ve reduced my holdings in large-cap tech over the past few weeks.
And whilst I maintain a position in each (excluding Meta) – I’ve taken chips off the table.
And should I see their forward PEs come back to more attractive long-term levels (e.g. forward PE’s closer to 25x or below) – I will consider adding back exposure.
In addition, I’m happy increasing my exposure to equal weighted ETF RSP.
My hypothesis is over the next 1-3 years – we will most likely see mean reversion.

