- Stocks yet to re-calibrate for fewer rate cuts in 2024
- Services inflation rips sharply higher
- Watch the trend in house prices for clues on how quickly inflation is likely to fall
Expectations for rate cuts this year are coming down… fast.
For example, one month ago the market saw at least six rate cuts before the end of the year (possibly seven).
However in January, I asked this question: “EPS Growth of 12% with 6 Rate Cuts. Really?“
I saw a clear contradiction.
Either the economy is strong with the potential for double digit earnings growth. Or the economy is in need of emergency assistance – where the Fed is forced to aggressively slash rates?
I wondered how it could be both?
As it turns out – the market now feels it’s more of the former.
Following another hotter-than-expected inflation print (more on this shortly) – the market sees just three rate cuts by year’s end.
And from mine – that’s more realistic (pending inflation and employment prints).
Feb 17 2024
The far right-hand column shows the market was pricing in a 36% probability of rates falling to a target range of 375 to 400 basis points by December 2024.
That is 150 basis points below today (i.e., the equivalent of 6 rate cuts at 25 basis points each)
That probability is now down to just 6.6%.
From mine, the market is now coming to terms with the Fed’s prudent approach.
As I’ll explain below – the Fed has been proven correct by maintaining a healthy sense of caution.
For example, on Friday we received the latest Producer Price Inflation (PPI) print.
PPI ripped past expectations and is arguably more aligned with the Fed’s projected rate path.
But here’s the thing:
The adjustment down to just three rate cuts is yet to affect equities.
Stocks were largely unchanged this week.
Therefore, we should ask whether this poses a potential risk to valuations?
Higher rates / bond yields implies stock multiples need to be discounted further (given the paltry amount of risk premium investors are getting from equities).
With that, let’s start with a review of PPI.
Not only are service sector prices increasing sharply – there could be another ‘sticky’ inflation variable potentially being overlooked.
PPI Surges w/ Hot Services Inflation
Wholesale prices rose sharply last month – powered by an unexpected surge in services costs.
Let’s begin with a summary of the Month-on-Month (MoM) and Year-on-Year (YoY) for both Headline PPI and Core (which excludes food and energy)
- Headline MoM rose 0.3% vs 0.1% expected;
- Headline YoY rose 0.9% vs 1.0% expected;
- Core MoM rose 0.5% vs 0.1% expected; and
- Core YoY was up 2.0% vs 1.7% expected.
The Core MoM number of 0.5% vs 0.1% caught most by surprise – as it was the fastest speed since July of last year.
If we split the inflation print between Commodity prices and Services – it’s clear to see where the higher costs are being felt:
Feb 17 2024
Not surprisingly, with supply chain snarls easing (i.e., more goods becoming available) – goods and commodities continue to fall (note: the inflation onion always peels from the outside first)
However, on the other hand, essential services like hospital outpatient care are soaring.
As an aside, when I reviewed the increase in January CPI last week, I mentioned the YoY 24% increase in car insurance premiums.
It’s services which is what the Fed is watching most closely (less so goods and commodities)
Because services typically involve a heavy labor (wage) component.
What’s more, they are also driven higher by the cost of real-estate.
For example, if you’re paying more to utilize the property (whether it’s rent for your business, taxes on the land; or other ongoing costs) – those (higher) expenses will be passed on with the service(s) you provide.
Now, ahead of the PPI print (and after CPI) – Atlanta Fed President Raphael Bostic said “rate cuts are unlikely until the third quarter of this year”.
That’s largely inline with my thesis; i.e., three cuts in the “second half” feels more likely.
However, I want to circle back to real-estate for a moment.
I think this plays a major part in the cost of “all things” rising (especially services) and it might be overlooked by the market.
House Prices are Not Falling
Housing (and real-estate more broadly) are one of the more critical components of inflation.
For example, for consumers, housing costs will absorb roughly one-third of total family budgets.
Therefore, it pays to check in with what we are seeing with house prices (as rents will typically follow any increase or decrease we see in the housing market)
One of the more reliable gauges of housing price trends comes from the Case Schiller Index.
Below we see the trend from 1-month through to the past 10-years:
Feb 17 2024
Over the past three months – prices have cooled somewhat – only rising 0.20% nationally.
However, over the past year they’re up 5.14%; and over the past 3 years – a whopping 10.34% annualized.
There’s part of your inflation problem (strong wage growth and excess money still in the system another)
Now, the good news is prices seem to be moderating.
However, they are not yet falling (note: ignore what we see on a monthly basis as there is too much noise)
For prices to fall – you need owners who are willing (or forced) to sell.
Which begs my question:
Today around 60% of US homeowners have secured 30-year mortgages below 4.0%.
What’s more, 78% of borrowers have a rate below 5%
Therefore, tell me why mortgage owners give up a fixed 30-year rate of ~4% in exchange for say 7%?
Short answer is you wouldn’t.
And whilst there can be ‘forced’ outcomes / sales (e.g., deaths, divorce, expanding family, changing work locations) – most people are not willing to trade in their 4% to 5% 30-year fixed loan for something that is ~3% higher.
According to this report from Fox Business – existing house inventory is not moving with rates north of 7%.
What’s more, of every 7 houses for sale, 6 are existing houses. Put another way, only 1 in 7 is new inventory.
And therein lies the problem… a lack of inventory.
From Fox Business:
With lower mortgage interest rates than current averages, it’s easy to understand why homeowners are weary of selling.
However, compared to 2022 when almost 93% of rates were below 6%, it’s clear that some homeowners decided to sell anyway.
Therefore, with housing inventory levels historically low; 78% of all borrowers with a fixed 30-year loan below 5%; and interest rates likely to stay above the average borrowing rate of 4-5% — what is going to incentivize home owners to sell?
Not much. Certainly not anytime soon.
Thus, should house prices remain elevated – would it not be unreasonable to assume the cost of living remains high with it?
And that’s the question I’m asking.
Equities Ignore Hot PPI (and Fewer Cuts)
If I’m right (and it’s quite possible I’m not) – and house inventory remains tight – it’s hard to see why house prices would dramatically fall.
And if they are not likely to fall – it follows inflation could remain uncomfortably above the Fed’s 2.0% target well into 2025 or longer.
Therefore, why would the Fed be in any rush to cut rates aggressively (notwithstanding a recession or some kind of major credit event)?
That said, the market was willing to look past the hot services PPI number of 0.5% MoM.
However, I don’t think it will go unnoticed by the Fed.
As a result, I will be looking for more hawkish tones when they meet in 31 days time.
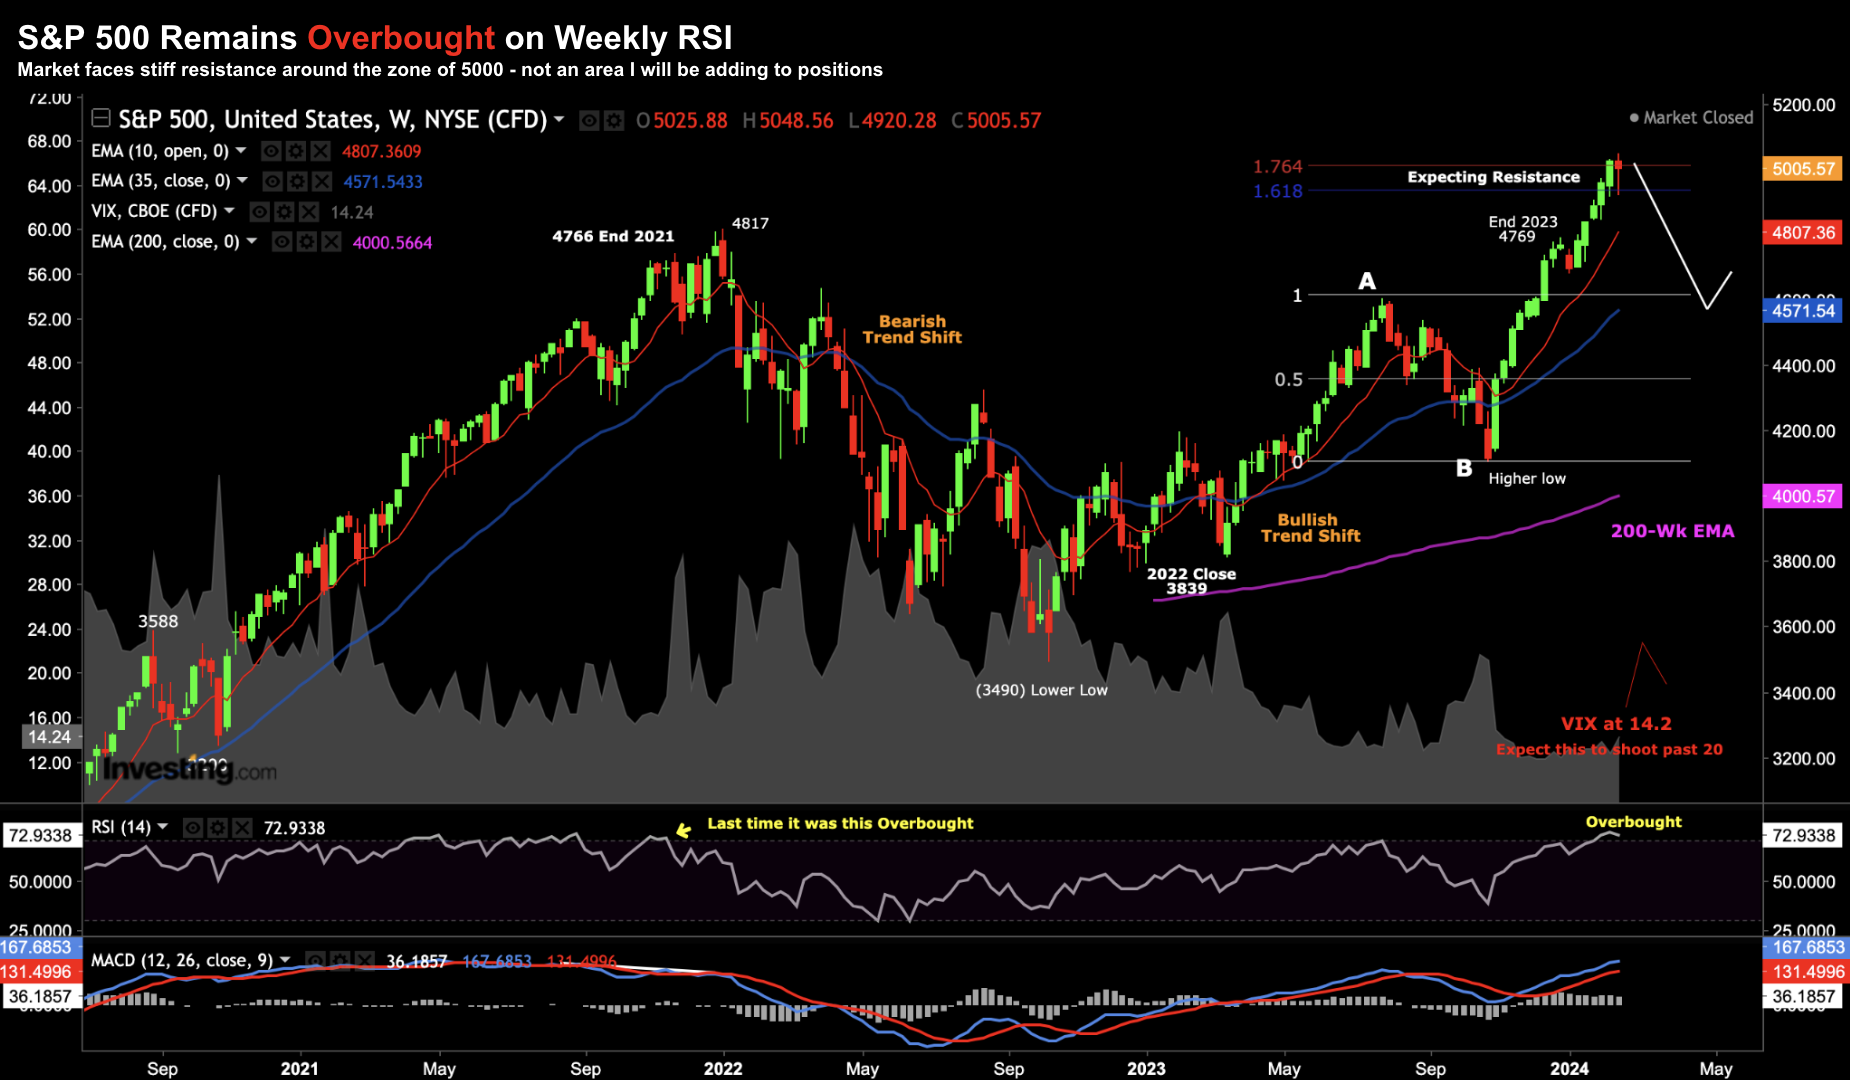
Let’s take a look at the weekly chart for the S&P 500
Feb 17 2024
- Market remains in an overbought zone according to the weekly RSI (middle-window). However, markets can remain overbought for ‘weeks’ (this is not a sell signal)
- We’re trading 61.8% to 76.4% outside the retracement labelled A-B (the pullback over Sept/Oct last year). Often this will be an area of resistance
- We remain significantly extended beyond both the 35-week EMA (blue line) and 200-week EMA (purple). If there is a selloff – look for buying support around the 35-week EMA zone (4500)
- VIX remains very subdued at just 14.2. I think we will see a volatility spike in the next few weeks – something above 20. If true, this will correspond to a market pullback.
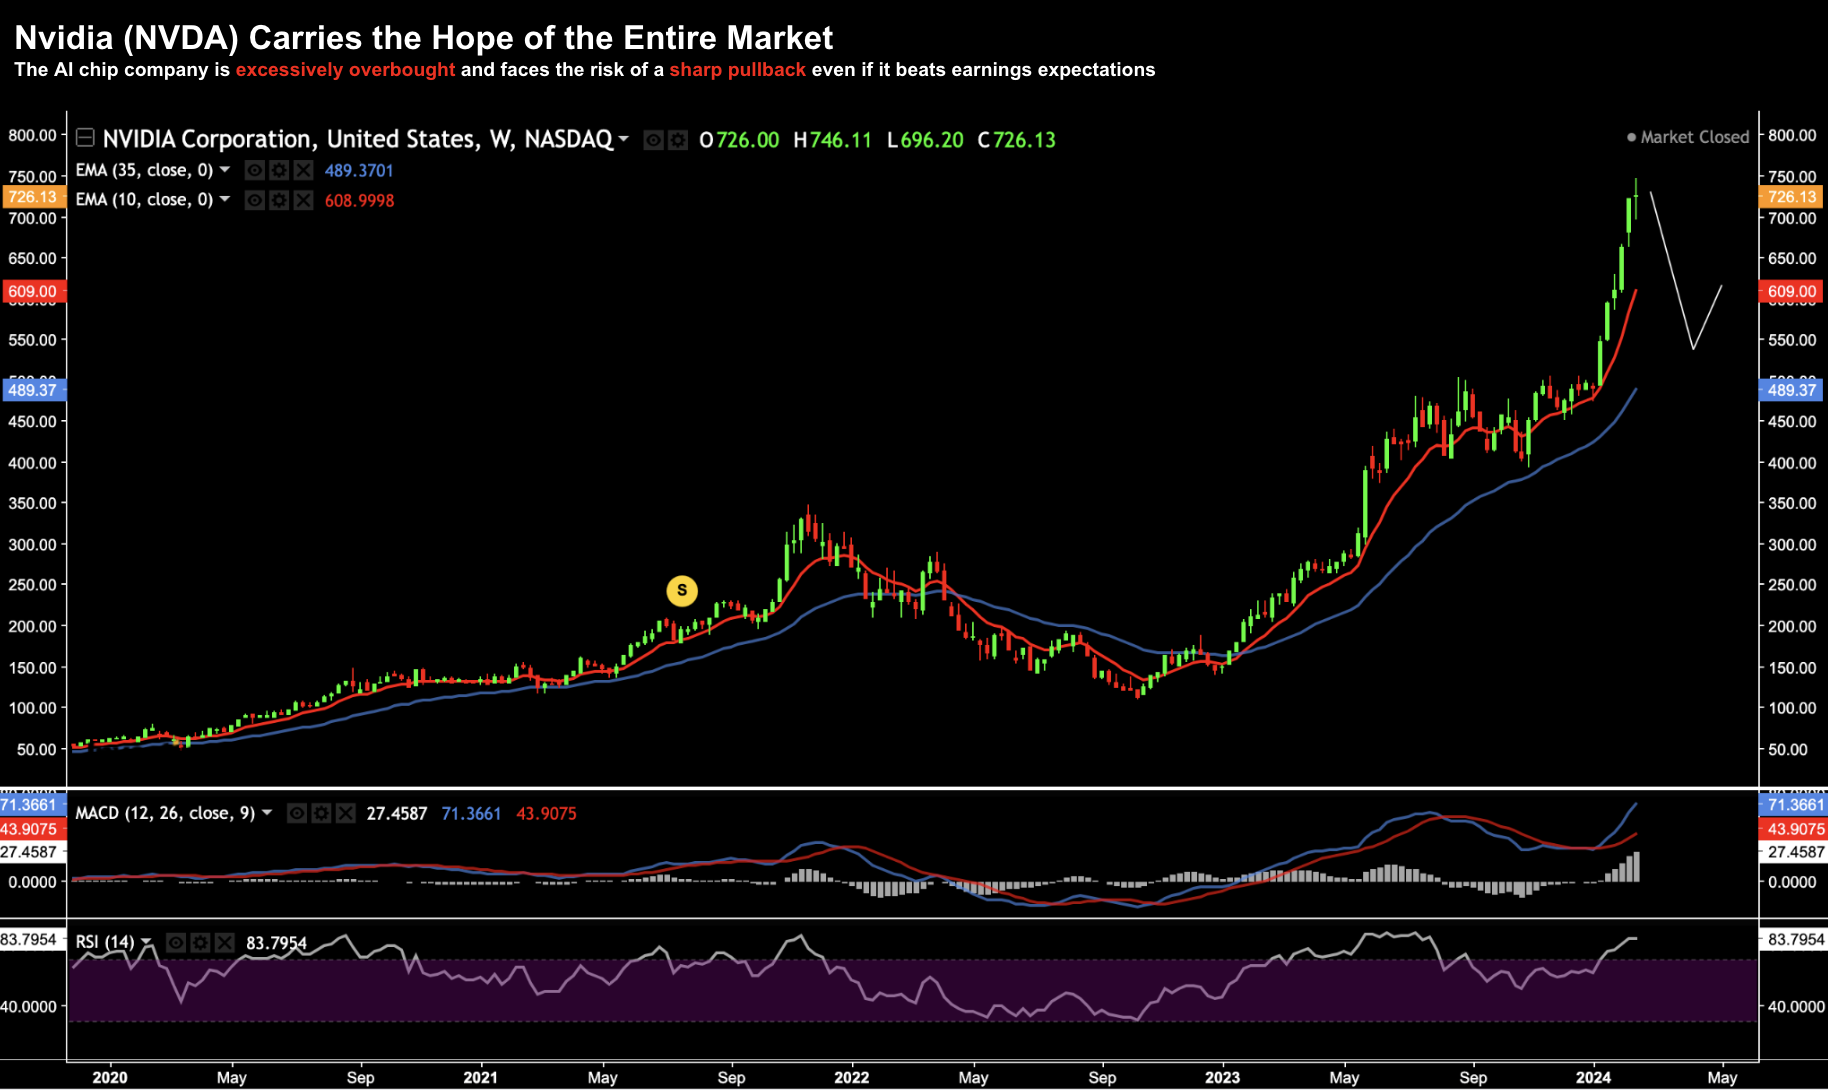
Perhaps the catalyst for a move lower might come from Nvidia (NVDA) earnings this week (Feb 22)
The stock continues to defy gravity – as investors suffer FOMO opposite the potential with Artificial Intelligence (AI). And NVDA is not alone in that regard.
The stock has been a bellwether for tech and the broader market (not unlike Tesla 12 months ago). Therefore, if investors sell the stock post earnings – the broader market could follow.
What’s more, even if NVDA beats expectations (which is very likely), it’s not unrealistic for investors to “buy the rumour and sell the news” (as they did with their previous earnings report).
And given how extended the stock appears in the near-term – this is a very real possibility.
NVDA – Carrying the Hopes of the Market? (Feb 17 2024)
Putting it All Together
It could be premature to say with high conviction the battle against stickier forms of inflation has been won (i.e., wages and housing)
Yes, it’s trending in the right direction – however it will probably take longer than expected to get the Fed’s 2.0% objective.
With respect to the two inflation prints last week (CPI and PP)… there are always quirks in the data.
And we should never read too much into any one month print. But from mine, the long-term trend with house prices and service sector wages deserves attention.
To declare victory – we need to see this trending sharply lower for several months.
We don’t have that yet.
In closing, the market is yet to re-calibrate that there will be fewer rate cuts.
That’s potentially to come as valuations will need to be discounted.
Stay patient and let’s watch the reaction to NVDA’s earnings.
I would not be surprised to see them handily beat expectations – only to see the stock sell-off.


