- Why nominal monthly retail sales are often misleading
- V-shaped rally could be short-lived
- Eyes shift to Jackson Hole – how dovish will the Fed be?
This week we received advanced retail sales for the month of July.
From mine, this is one of the more important data points – as it sheds light on what we see with the relative health of the consumer.
With spending making up 70% of GDP – any signs of slowing serve as a warning.
CNBC reported advanced retail sales accelerated 1.08% on the month – adjusted for seasonality but not inflation.
Economists surveyed by Dow Jones had been looking for a 0.3% increase MoM.
However, June sales were revised to a decline of 0.2% after initially being reported as flat.
As regular readers will know, it’s virtually impossible to glean anything from a nominal data point when viewed month-over-month.
And whilst the media (and stock market) were to quick to praise the relative ‘strength’ of sales – I would warn against jumping to conclusions.
To give the data meaning – it’s important we survey the longer term trend and adjust for inflation
Nominal vs Real Sales
- Adjust for inflation; and
- Extrapolate over the long-term (e.g., quarterly and any change YoY)
Adjusting for inflation gives us real v nominal sales. And when viewed over a quarterly (smoothed) basis year-over-year – it helps to eliminate noisy monthly revisions and seasonality effects.
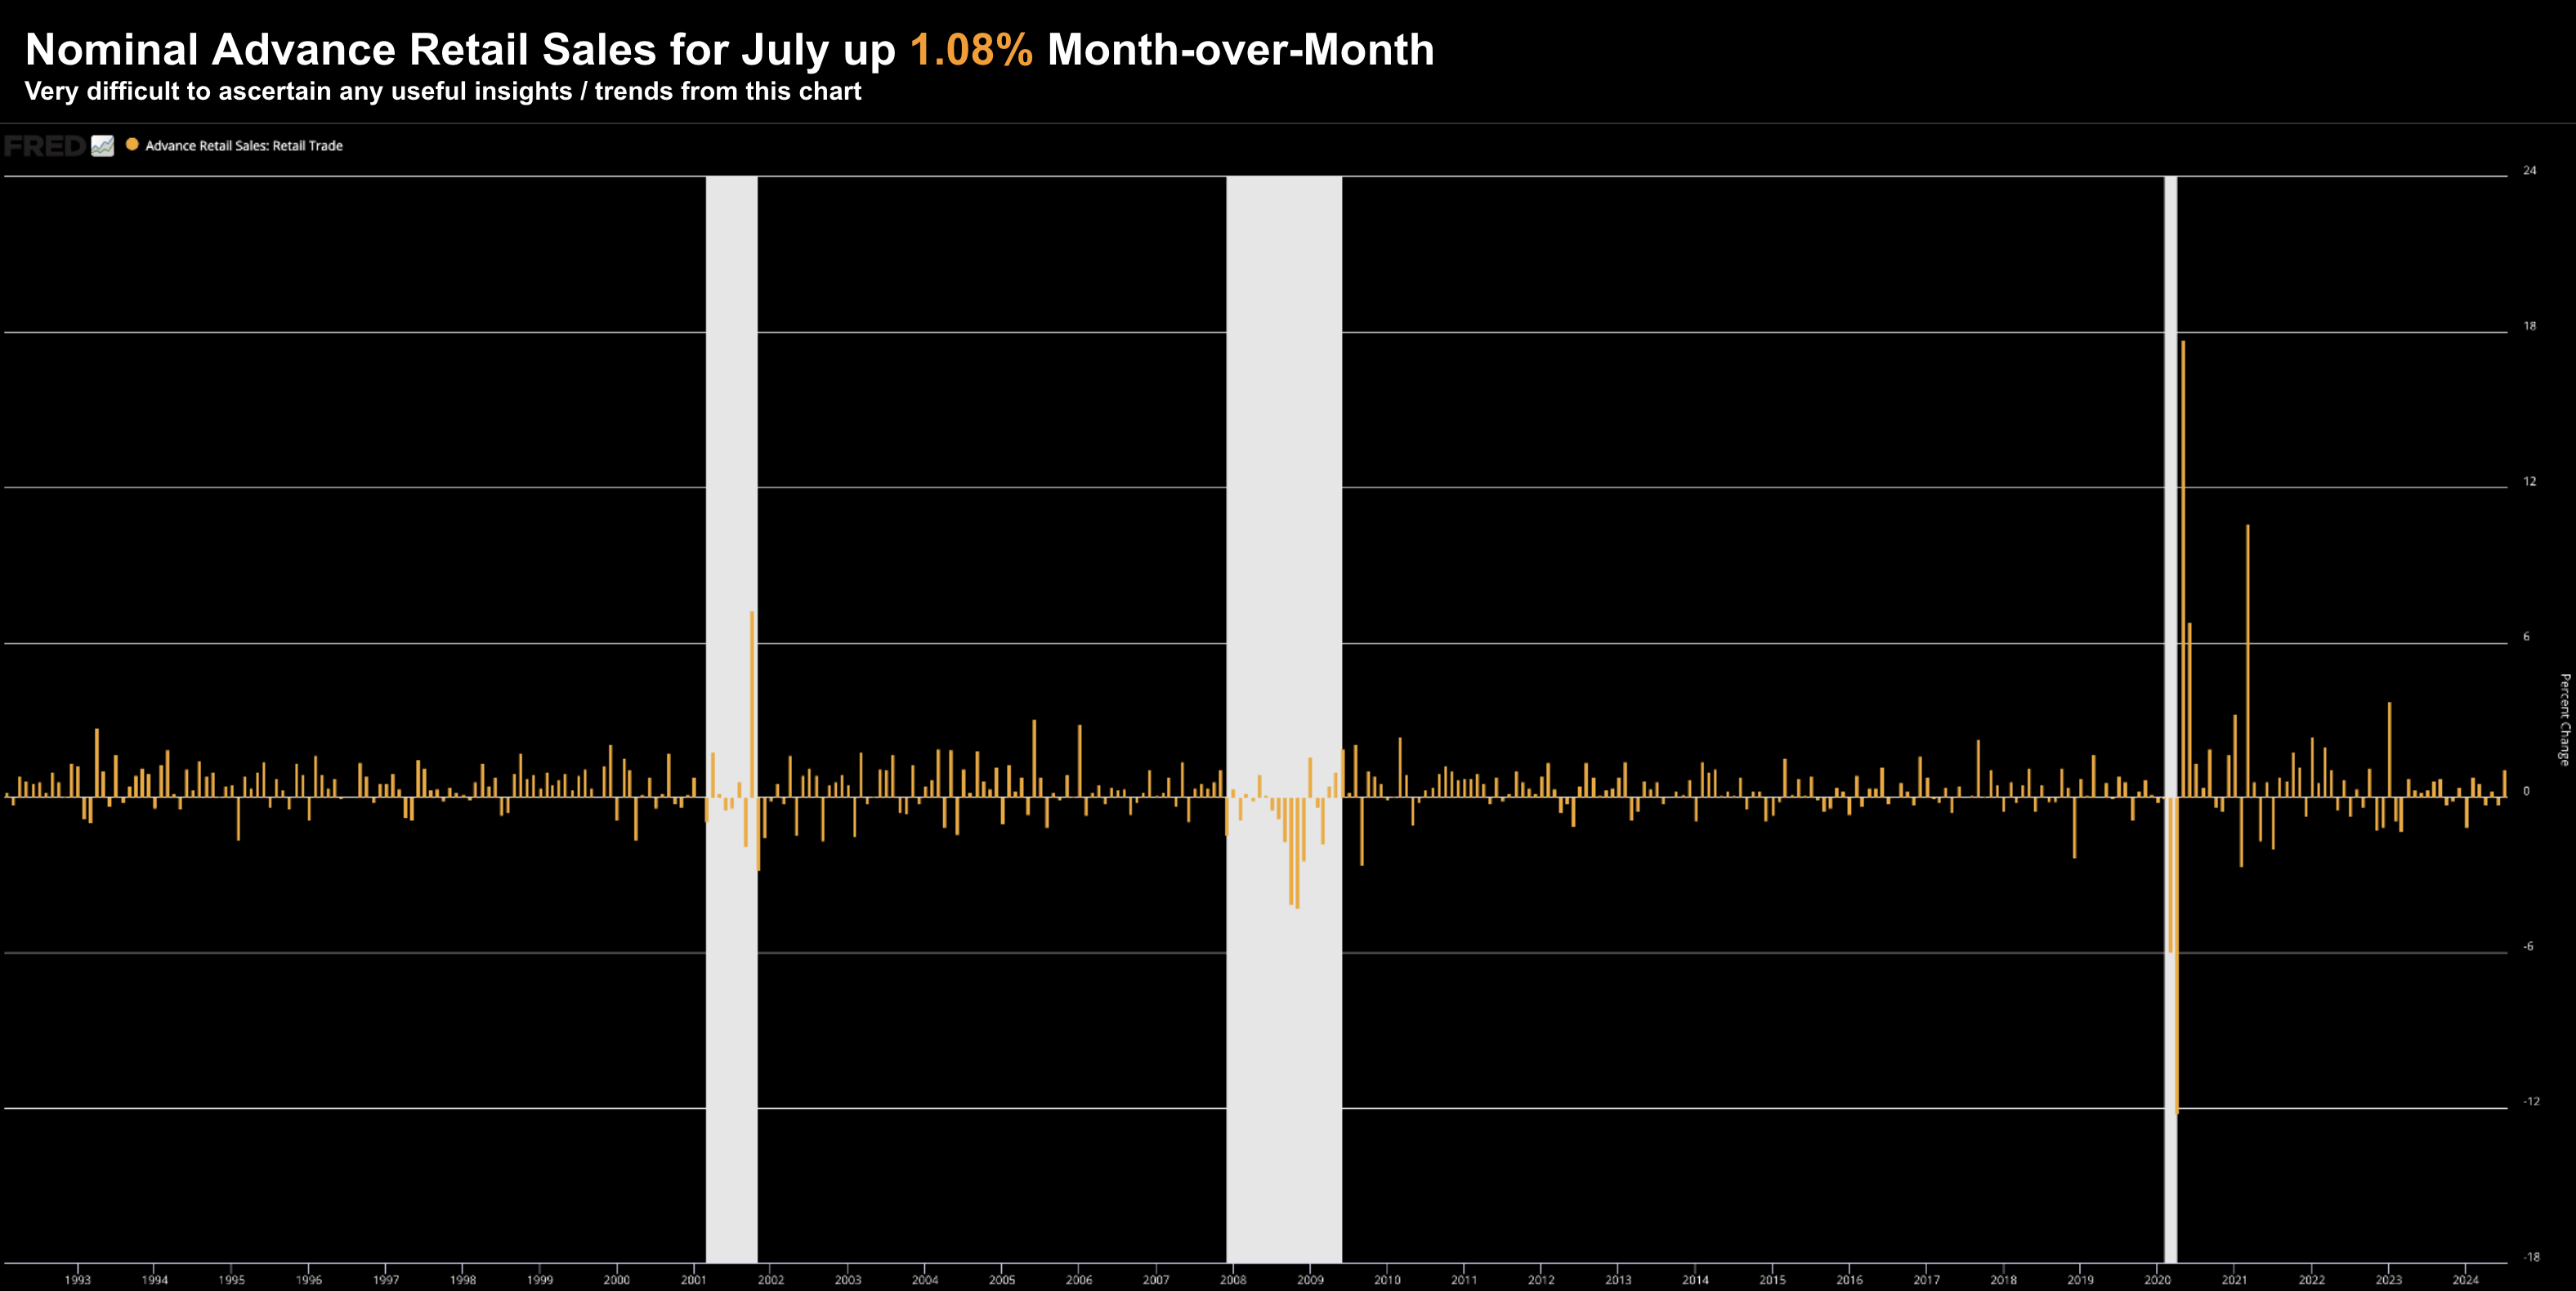
For example, if we look at the nominal monthly data, we get something like this:
Aug 17 2024
As can see, advance retail sales on a nominal basis regularly bounce up and down on a month-over-month basis.
But it’s very difficult – if not possible – to ascentain any trend / implications of this data.
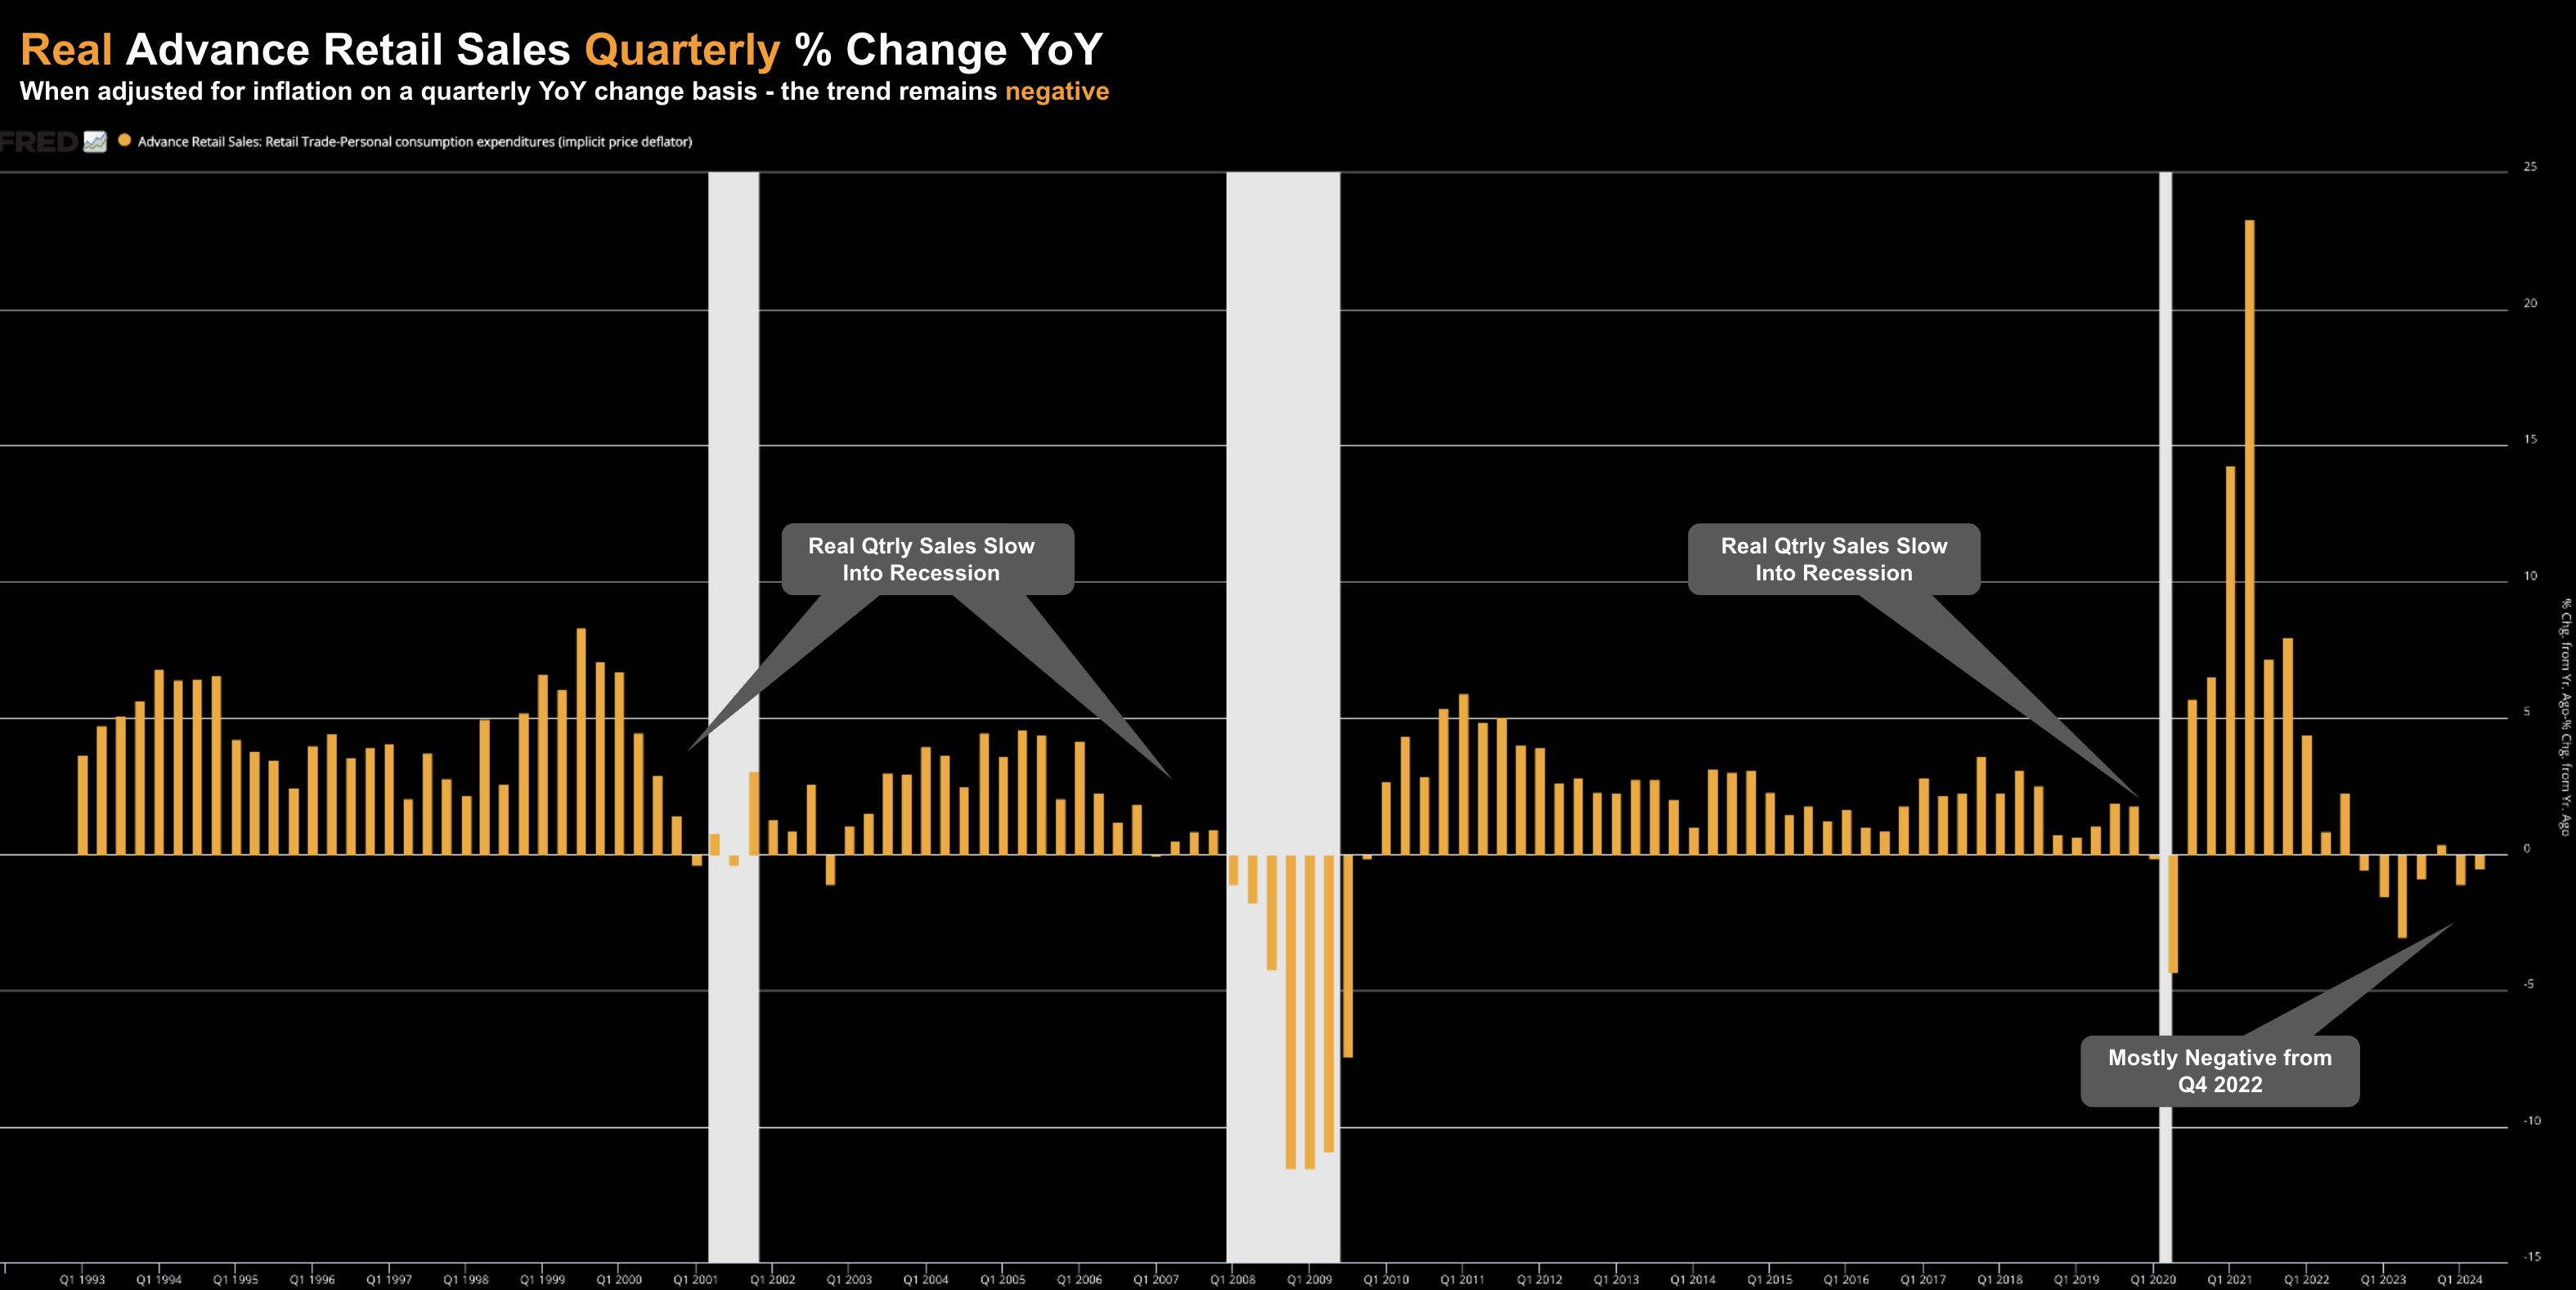
Now below is the same data adjusted for inflation on a quarterly basis – showing the percentage change year-over-year.
Aug 17 2024
This gives us a far more useful perspective.
As an aside, I’m yet to see any mainstream financial website (or analyst) report the data this way (let me know if you find one). In almost every case (as we saw from CNBC – you will find nominal sales expressed as month-over-month)
Looking back, whenever real quarterly advance retail sales slow year-over-year – a recession isn’t too far away.
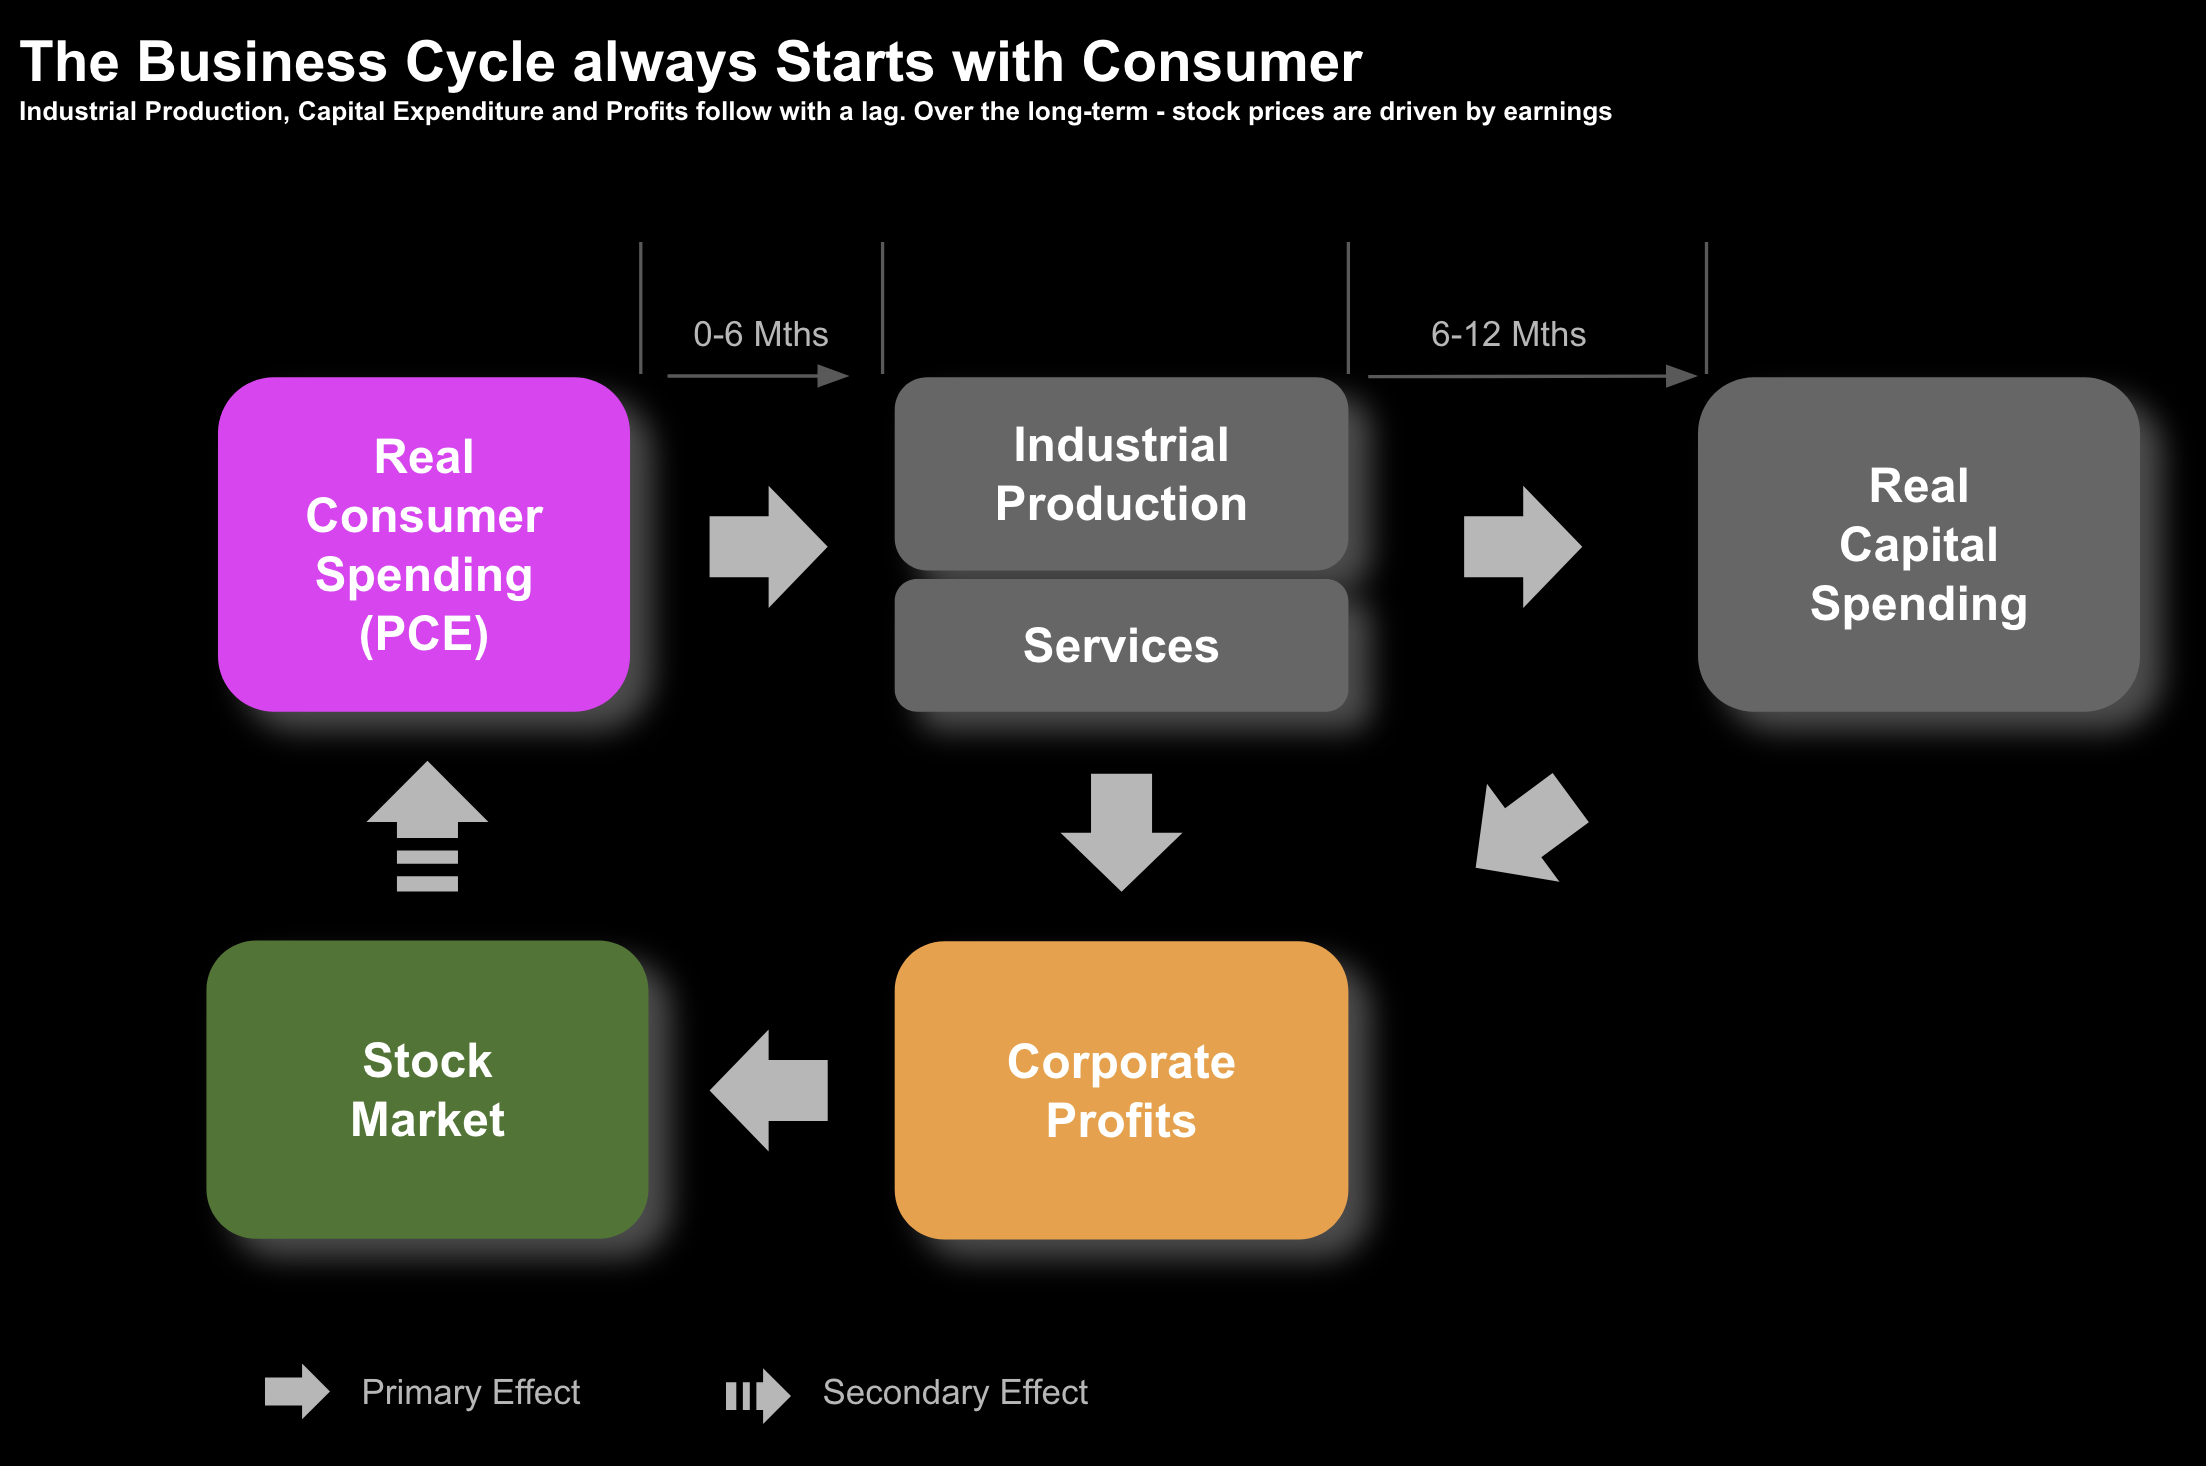
However, there is typically a 6-9 month lag (which we also see in the stock market).
I’ve shared this framework in the past to show the cycle:
Since Q4 2022 – real advance quarterly sales have mostly been negative (excluding a very small increase of 0.39% Q4 2023)
Therefore, when I see headlines for a “strong” monthly nominal retail sales, I question their interpretation.
And whilst it was better than the 0.3% expected… retail spend remains soft.
For example, one of the better barometers for discretionary retail spend is what we hear from The Home Depot (one of the US largest stores for home renovation / repairs)
The scaled back their sales forecasts for the full year and cautioned that consumer spending was slowing even more than expected
From MSN (August 13th):
Home Depot lowered its full-year guidance for earnings per share to a decline of between 2% and 4% compared with the prior year, having previously expected EPS growth of approximately 1%.
It also lowered its outlook for comparable sales to a decline of between 3% and 4%, after previously expecting a drop of approximately 1%.
“During the quarter, higher interest rates and greater macroeconomic uncertainty pressured consumer demand more broadly, resulting in weaker spend across home improvement projects,” said CEO Ted Decker in a statement.
Consumers tend to start renovation projects before selling a house, or just after buying a new place. But many potential buyers are still put off by high interest rates and housing prices, resulting in fewer home-improvement efforts. Higher rates also discourage homeowners from taking on larger, discretionary projects—such as renovating a kitchen, bathroom, or building a new deck—until borrowing becomes less expensive.
This is precisely what the real quarterly advance retail sales time series is showing us.
Now some may be quick to argue that Walmart showed a strong report…. however I was not overly impressed.
The U.S.’ largest physical retailer report Q2 revenue grew 4.8% to $169.34 billion – compared to the $168.46 billion expected.
But again, that’s a nominal number.
For example, if we adjust for 2.6% PCE price deflator for Q2 – Walmart’s real sales were only up 2.2% year-over-year.
The primary driver for growth?
Non-discretionary food sales.
Groceries remain Walmart’s largest business – and the largest factor behind the higher foot traffic and ticket sizes.
Here’s Walmart’s CFO John David Rainey
“We know that they’re looking for value and their dollars are stretched, they’re focusing in on those things that are providing value for them, they’re being choiceful when they buy the larger ticket items”
Does that sound like a strong consumer?
Now I give credit to Walmart for focusing their business on food to get customers in the door – no question.
From there, customers may add to their non-food basket.
What’s more, they are able to capitalize on their unparalleled physical footprint – which is a key advantage over Amazon.
But this isn’t a strong consumer…
It’s a consumer who remains “choiceful” (using Walmart’s own words) and one which is “stretched”
In summary, when I look at the reports from Walmart and Home Depot (two of the US’ largest physical retailers) – there was nothing overly strong about their reports.
And when examining the consumption trend over the longer-term adjusted for inflation (in real terms) – it lines up with what these retailers are telling us.
But the stock market (and mainstream) looked straight past it….
S&P 500 Rallies on ‘Strong’ Consumer
On greater hopes of a soft-landing (and given the nominal retail sales print) – the S&P 500 took off to the upside.
We’ve not seen a stronger back-to-back two weeks since 2020.
It was truly v-shaped.
As I shared last week – I felt we were likely to see a technical bounce from the 35-week EMA support zone
That’s typically what we see in a bullish trend.
I had pencilled in a possible (buyable) 10-12% correction… and it turns out that’s what took shape:

Aug 17 2024
The velocity of the bounce was surprising (to me at least)…
However, it only reinforces my thoughts of heightened volatility during a time of transition.
This is a market working through a challenging climate… as it continues to calibrate the health of the consumer, strength of earnings, monetary policy and a possible change of government.
And depending on who you talk to – everyone will have a different option.
Turn on the TV and you will hear someone call retail sales “robust”; whereas the next analyst will tell you the consumer is weakening.
Which is it?
If I were to bet – my best guess is we face resistance around the recent highs – before another push lower.
However, we will need a catalyst.
From mine there are possibly three (if not more):
- Yen to resume strengthening – causing further unwinding of the carry trade (I don’t think that’s finished)
- Fed only cutting rates by 25 basis points in September (not the 50 basis points expected); and
- Nvidia (NVDA) earnings August 28th.
Now other notable market risk events could include increased geopolitical tensions (e.g., events in Gaza and Ukraine); and the direction of November U.S. Presidential election.
With respect to the election – both candidates have very different views on what works best for business and the economy (e.g., one is carrot (greater incentives and smaller government) – however the other is more of the stick (higher taxes and more regulation)
Subject for another day…
For me, the three bullet points above represent the most likely to move markets in the near-term.
With respect to NVDA earnings – this could be key.
I say that because the market is still largely being driven by large-cap tech; and earnings optimism around artificial intelligence (AI).
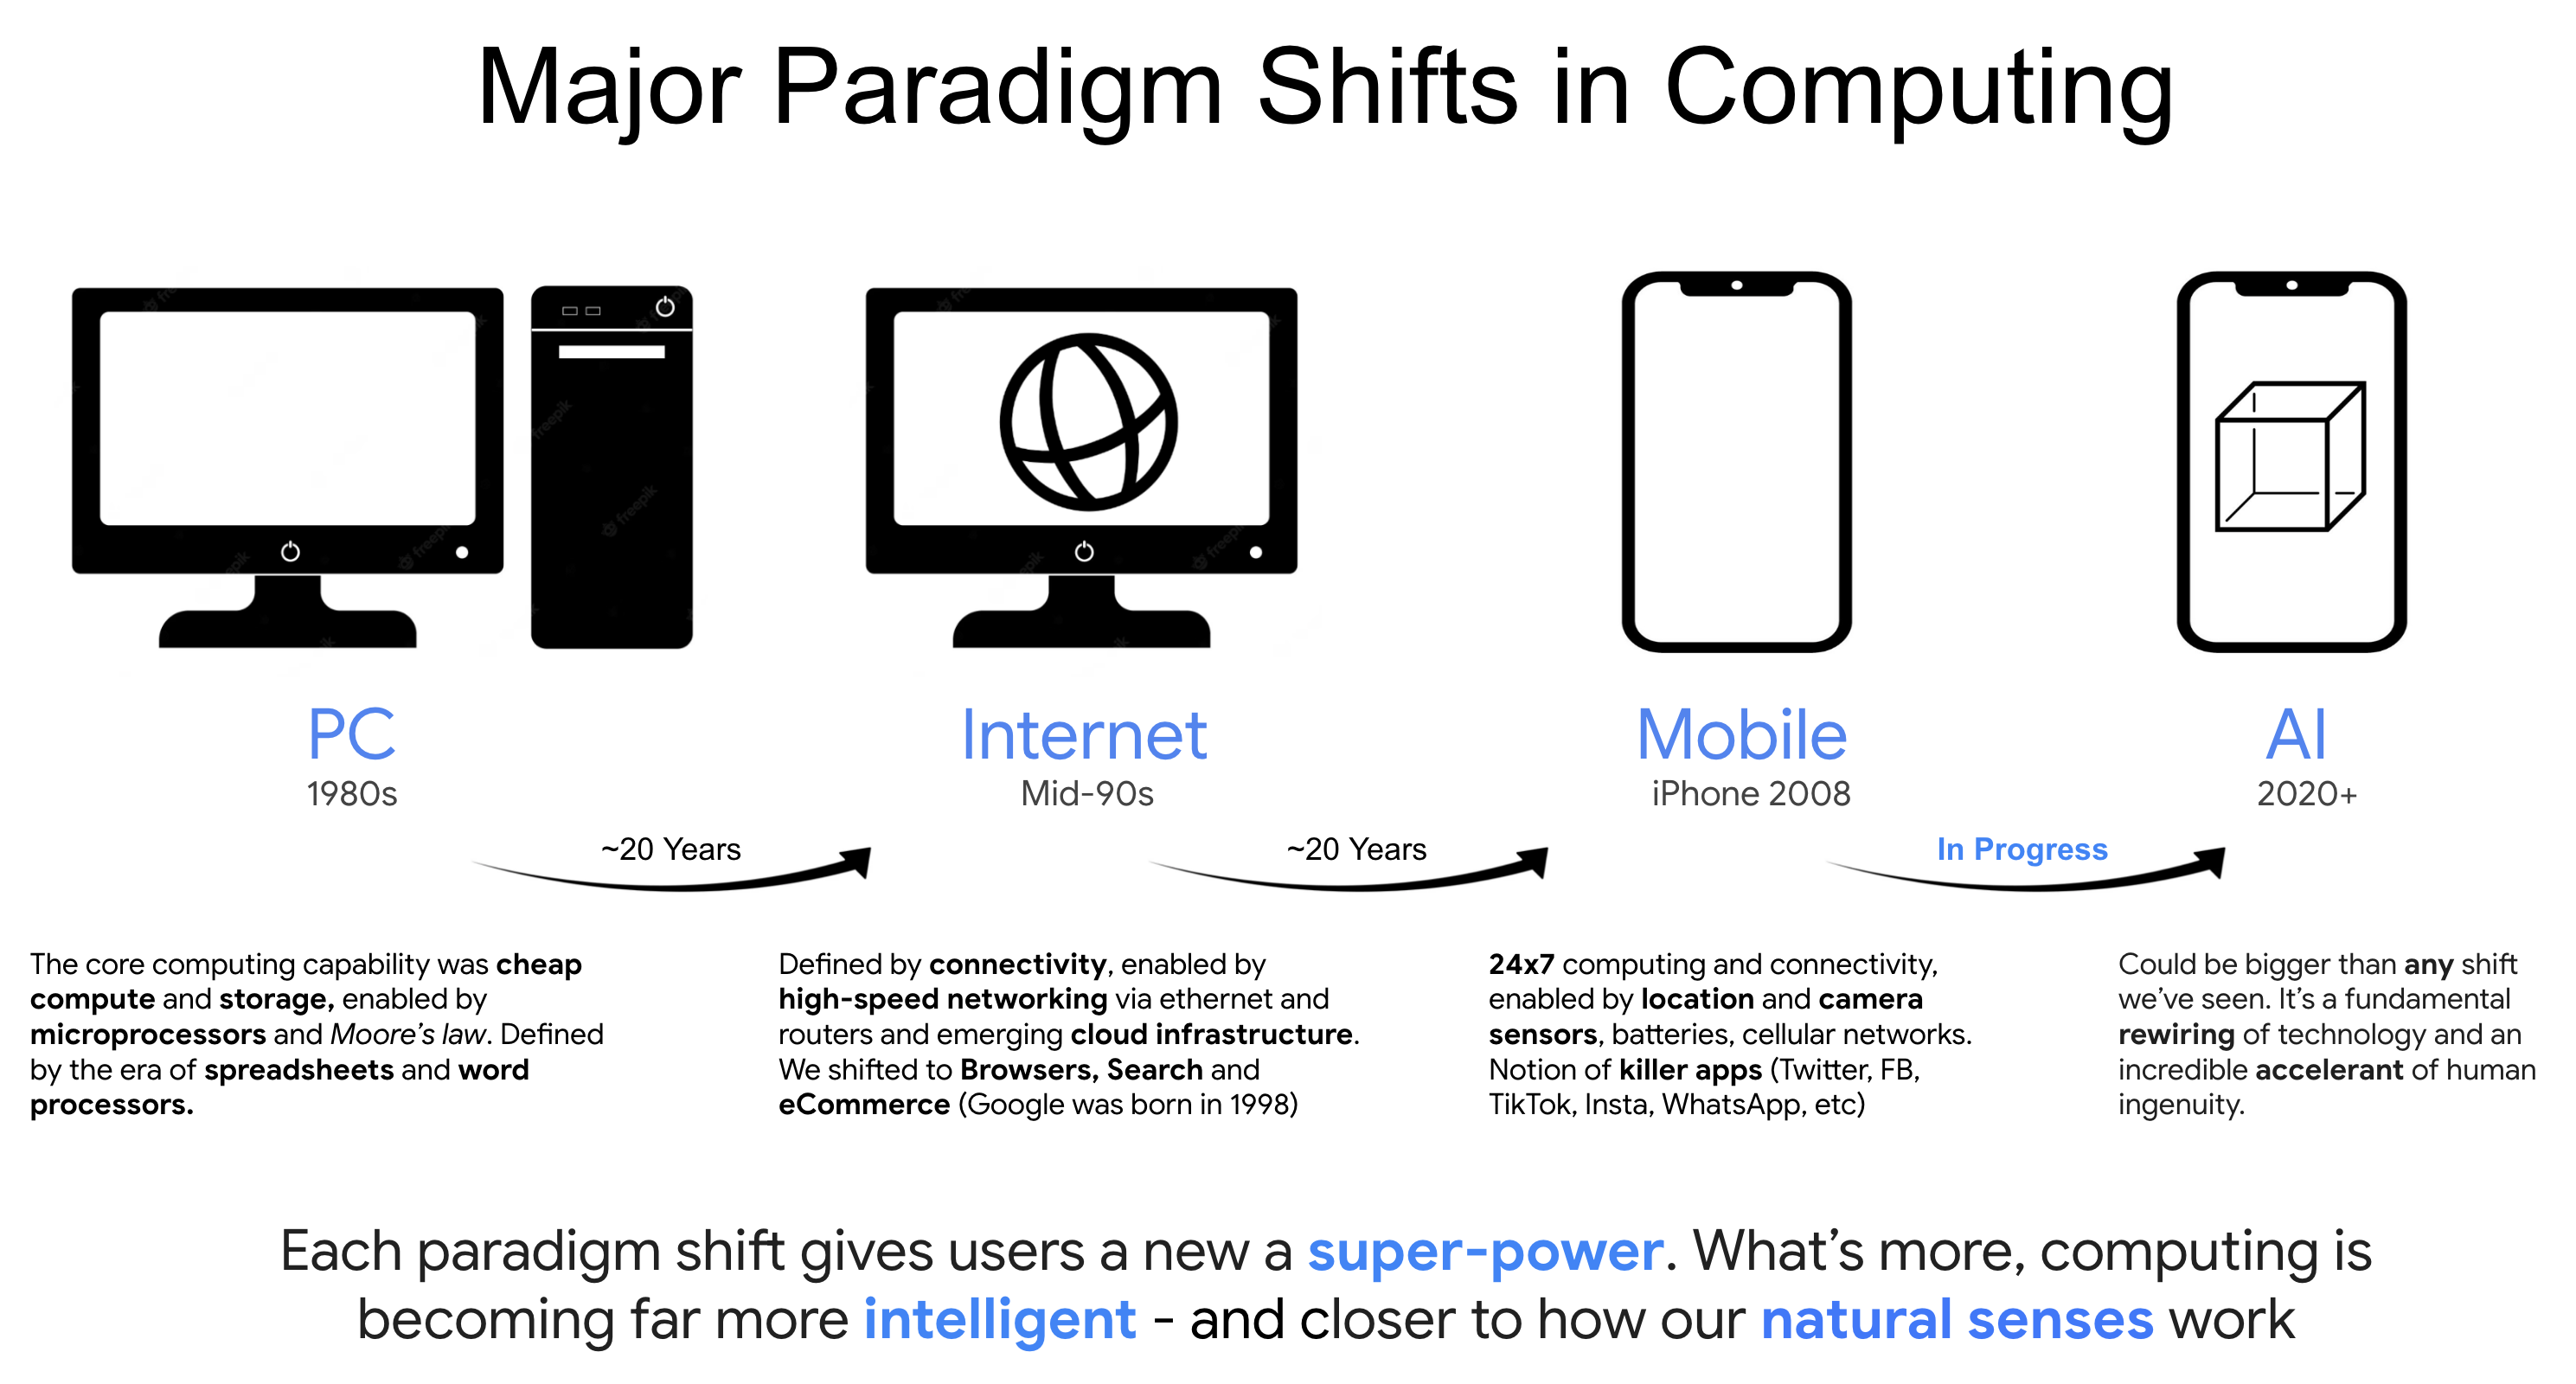
And whilst I think AI will be truly transformative (perhaps the most important paradigm shift since the advent of the smartphone) – we have a long way to go.
For example, I shared a framework I developed for a University lecture I gave a year ago (well before the advent of ChatGPT)
Source: Adrian Tout
NVDA is playing an important role in this shift (and will continue to).
However, much like the other shifts, it won’t be in a straight line.
We saw a similar thing in the very early days of the internet (circa 1995 to 2000).
With respect to the shift to AI – we’ve seen a ~$600B capex explosion as tech companies race to establish market share.
And given their lead in AI chips – NVDA has been the clear winner.
However, this pace of capex will not be linear.
At some stage, investors will challenge both revenue and earnings opposite the (AI) use-cases and applications.
We’re yet to prove what these are (something we in tech call “product market fit”)
And we’re a long way from scaled monetization.
I can tell you first hand… as it’s what I do day-to-day (this blog is a hobby!)
On that basis, it’s possible we hear NVDA talk to the relative ‘ebbs and flows’ of the capex cycle (as they re-set expectations for hyper-growth)
Put another way, I would not be surprised to see them to issue softer-than-expected guidance for the second half (as customers digest hundreds of billions invested)
Again, we saw the same ebbs and flows from CSCO from 1995 to 2000 – where the stock saw several 30% to 40% corrections along its ascent.
But let me be clear….
I expect NVDA’s stock to double over the next 2-3 years.
You could buy it today ~$125 if you have this timeframe in mind – and potentially do well.
However, expect these 30-40% type drawdowns along the way.
As for me, I will look to capitalize on a lower price.
For example, my preferred buying zone is ~$75 to $85
I’m currently short Nov $75 Puts – outlined in this post “Maybe Valuations Matter”
Repeating what I shared the other week – I expect NVDA to earn in the vicinity of $3.75 per share next year.
At $75 – that’s a forward PE of 20x forward earnings.
And if you’re willing to pay $85 – that’s 23x (a reasonable multiple for a high quality business)
Putting it All Together
Before I close, the Fed meets next week at Jackson Hole (Aug 22 to 24)
Markets are expecting a very dovish tone to close the year – pricing in as many as four rate cuts before January 2025.
That could be optimistic….
And whilst I don’t see inflation as a risk – the pathway down to 2.0% will be slow.
The Fed will likely talk more to employment and growth risks… but will not want to show signs of “panic” (something a 50 bps cut could do)
Yes, consumer spending is clearly slowing (despite mainstream headlines which suggest otherwise) – but not to levels which will alarm the Fed.
And should the Fed only cut 25 bps in September, it will be interesting to see how markets react.
Have they priced in more? Maybe.
Let’s see how the market trades post the Fed’s language next week…. they are expecting doves (not hawks)


