- How total aggregate sector debt acts as leading indicator of monetary policy
- Debt growth YoY (all sectors) has slowed sharply the past 3 years
- Fed to set the stage for rate cuts in September – but don’t expect 50 bps
This week is all about the Fed…
As inflation continues to moderate and the employment picture weakens – markets are trying to gauge just how much the central bank will move.
A 25 basis point (bps) cut for September is now a 100% probability according to CME Group’s FedWatch tool.
There’s a 63.5% chance of a 25 bps cut; and 36.5% chance of a 50 bps cut.
Markets clearly want 50 bps… but they also know that very rarely is there only just one rate cut when the Fed eases (not unlike cockroaches)
Those moves came as Fed officials said a decrease to the borrowing cost during the September policy meeting was increasingly likely, according to FOMC minutes from July.
The majority of participants (they never specificy the number) indicated that loosening monetary policy would be appropriate if data continued to come in as expected.
And to that end, the data is mostly on their side.
Inflation continues to fall (albeit slowly) and the job picture is showing signs of stress.
And whilst rate cuts are generally good news for risk assets (more on why shortly) – it comes with a caveat.
For example, are the Fed cutting for the “right” reasons?
History shows that when the Fed are cutting rates into a weakening jobs market – stock market returns are below average.
However, if rate cuts accompany improving employment – stocks tend to outperform.
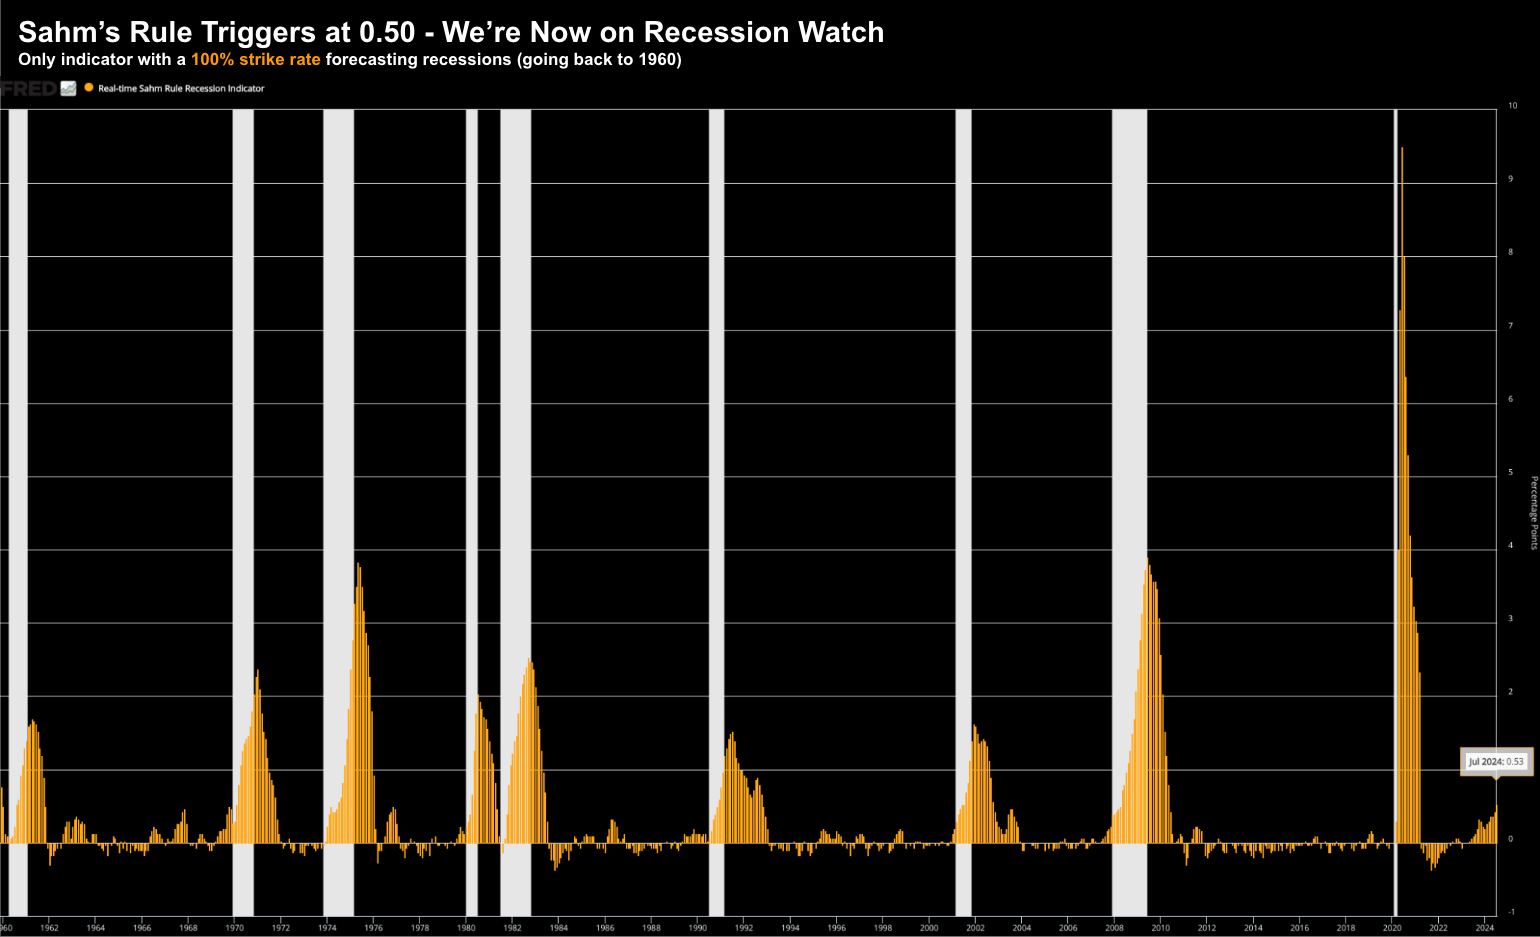
Now if Sahm’s Rule is any indication (and it may not be) – I tend to lean more towards the former vs the latter.
In any case, using the US 2-year treasury as proxy for Fed policy, the market is pricing in ~150 basis points of cuts over the next 12 months.
To that end, whether the Fed cuts “25 or 50 bps” in September – it will make little difference to what we see on “Main Street”.
For example, it’s not going to change the price of most goods and services (e.g., your insurance, food or energy bills). They will remain at least 30% higher than what they were four years ago… even with rates falling 100 bps.
And nor will it materially influence housing or auto loans in the short-term.
But given this is “Fed week” – I wanted to expand on a few of the basics regarding interest rates.
As investors, the direction of rates (short and long-term) have a major bearing on how we value risk assets.
I will explain how this works.
In addition, whilst the media tends to focus on inflation and employment as the two primary drivers for setting monetary policy (which is true) — there is another compelling factor.
And here I’m talking about the trend in aggregate sector debt (all forms – public and private).
Let’s explore…
Interest Rate Basics…
Interest rates affect the economy and stock prices in three important ways:
- Rate of economic growth (e.g., aggregate amount of borrowing, spending and investing);
- Consequential corporate profits; and finally
- Stock valuations (e.g., price-to-earnings (PE) ratios).
In previous posts, I’ve shared how consumer spending is arguably the most reliable and consistent long-term leading economic indicator.
With consumption comprising ~70% of GDP – any increase or decrease year-over-year can determine subsequent bull and bear markets (with an approximate 6-9 month lag)
Just on this, the CEO of Home Depot made this point abundantly clear when talking to their latest earnings (and the risks):
“Consumers tend to start renovation projects before selling a house, or just after buying a new place. But many potential buyers are still put off by high interest rates and housing prices, resulting in fewer home-improvement efforts.
Higher rates also discourage homeowners from taking on larger, discretionary projects—such as renovating a kitchen, bathroom, or building a new deck—until borrowing becomes less expensive.”
But I think it also brings up an important point for investors…
If borrowing costs are to remain high (in real terms) – it follows that one would remain cautious on the outlook for discretionary stocks like THD.
However, should borrowing costs come down – it opens up the possibility that consumers start to increase their spending (on the assumption they maintain their jobs). Again, we will see this in the year-over-year quarterly trend for Real PCE
However, lower rates are secondary for consumers if you’re not producing regular income. A job is far more important.
That said, I should highlight that not all stocks (and sectors) are created equal when it comes to the impact from rate changes.
For example, the defense sector, health and pharma are largely immune from changes in interest rates. They are more subject to changes in government policy.
However, sectors such as retail, autos, banking, utilities and real-estate and very sensitive to changes in the price of money (perhaps subject for another post)
Which brings me to valuations…
How Rates Impact Valuations
Whilst there are many ways to value a stock — one thing we are always interested in is how attractive the investment is relative to the risk free rate of return (among other things).
This is known as the equity risk premium. From Investopedia:
Equity risk premium is the excess return that investing in the stock market provides over a risk-free rate.
This excess return compensates investors for taking on the relatively higher risk of equity investing.
The size of the premium varies and depends on the level of risk in a particular portfolio. It also changes over time as market risk fluctuates.
It’s widely understood that when interest rates rise – so too does the attractiveness of risk-free rate of return.
For example, with the short-end of the curve recently pushing 5.0% (2-year duration and less) – it made for a compelling case to add exposure.
A higher risk-free yield has the impact of reducing the comparative appeal of stocks’ dividends and their earnings yields.
Rising yields (or rates) will generally put downward pressure on stock valuations (e.g., where PE ratios tend to decline).
Conversely, when rates fall, this makes alternative investments (such as bonds or credit) less attractive – which generally see stocks’ PE ratios rise.
This describes the typical inverse relationship between rates and valuations.
Here’s an example:
Assume a company trades for $40 per share with expected earnings per share (EPS) of $2.00.
This implies a forward PE of 20x.
However, to calculate the equity risk premium, we would measure this as a function of its earnings yield.
This is where we take its EPS as a percentage of the stock price. For example, this would be $2 / $40 = 5.0%.
Alternatively, you can also take the inverse of the 20x PE ratio; where 1 / 20 = 5.0%
In this case, 5.0% is the theoretical return to the owner of the stock — not unlike the interest received is the key measure of return to the owner of a bond.
The key difference of course is the latter is guaranteed (hence the use of the term theoretical for stock valuation).
Let’s now reverse the equation…
On the other hand, if interest rates (or yields) were to rise – it follows that a company’s earnings yield, to be competitive, would also have to increase.
Therefore, when interest rates rise significantly over longer periods of time – it follows that PE valuations will come under pressure.
This means that despite growing profits, stock prices may advance less during such periods as declines in PE multiples offset growth in earnings.
And we’ve seen this happen in the past…
For example, we saw it during the early 1960s and again in the early 1980s.
During these periods, the 10-year Treasury yield rose from ~4% to ~14%.
The sharp rise in bond yields resulted in:
- Lower than average PE valuations
- S&P 500 returning sub-par CAGR of 2.9% (plus dividends) over 21 years; and
- Bear markets were more frequent – occurring every 2.5 to 4 years
On the other hand, when the 10-year Treasury yield fell back below 4% over the next 20+ years – the inverse occurred:
- Improvement in PE valuations
- The S&P 500 returned healthy CAGR of 10.5%
- Bear markets were far less frequent and of shorter duration.
This is a very high level overview of how the longer-term (10-year yield) direction has major influence on both stock market performance and valuations.
This is a nice preface for the following conversation – where we examine the forces at play which will shape interest rates (and in turn – the relative yield on the 10-year treasury).
The Link Between Debt, Deficits and Rates
If you search for what factors influence the 10-year yield (and interest rates) you get something like the following (from Investopedia):
Several factors influence the 10-year Treasury yield. When the economy is strong, investors may demand higher yields to compensate for the opportunity cost of investing in safer government bonds versus higher-yielding assets like stocks.
On the other hand, in times of economic uncertainty or recession, investors flock to the safety of Treasuries, driving prices up and yields down due to the increased demand for secure, low-risk investments.
Inflation expectations also play a role in shaping the 10-year Treasury yield. When investors anticipate higher inflation in the future, they require higher yields to offset the eroding purchasing power of their returns. This expectation causes yields to rise.
If inflation is expected to remain low, the demand for fixed-income securities with stable returns increases, leading to lower yields.
Monetary policy decisions by the Federal Reserve are another contributor to the 10-year Treasury yield. When the Fed raises short-term interest rates to curb inflation or cool down an overheating economy, yields on longer-term Treasuries like the 10-year bond often increase in response. This is because higher short-term rates can signal future rate hikes, leading investors to demand higher yields for longer-term investments.
When the Fed lowers rates to stimulate economic growth, yields on longer-term Treasuries typically fall as lower short-term rates signal a more accommodative monetary policy stance.
Nothing new there… the usual suspects of (i) expected economic growth; (ii) inflation expectations; and (iii) short-term monetary policy.
However, there is one (major) factor which is completely absent from Investopedia’s summary.
Here I am talking about the link to deficits and debts.
Over the past two decades or so (possibly longer) – this has been a hotly contested debate.
And for good reason. Consider what we’ve seen this year…
- For the first seven months of Fiscal Year (FY) 2024, spending on net interest has reached $514 billion, surpassing spending on both national defense ($498 billion) and Medicare ($465 billion); and
- The interest expense alone exceeds all the money spent on veterans, education, and transportation combined.
And whilst calling out the problem with debt and deficits often sounds like the “boy who cried wolf” – this has not happened at any time over the past 50 years.
Given the above, Jay Powell went on 60-Minutes earlier this year and declared the (fiscal) situation urgent.
But here’s the thing:
Whilst we’re seeing federal debt expand (e.g. up 516% or $25T from 2003) – what’s important is we look at all forms of debt.
I think it’s remiss of investors to focus on exclusively on federal borrowing and spending.
And whilst that sector is 40% of all aggregate debt (up from ~20% twenty years ago) – put together – all forms of debt is now $74.6T
Below is an animation I created (using the Fed’s data) showing the total growth from 1980 (where aggregate debt CAGR was ~6.1% over 20 years)
Note: observe the increasing scale on the left-hand side. It starts at ~$4T (1980) and ends around $75T.
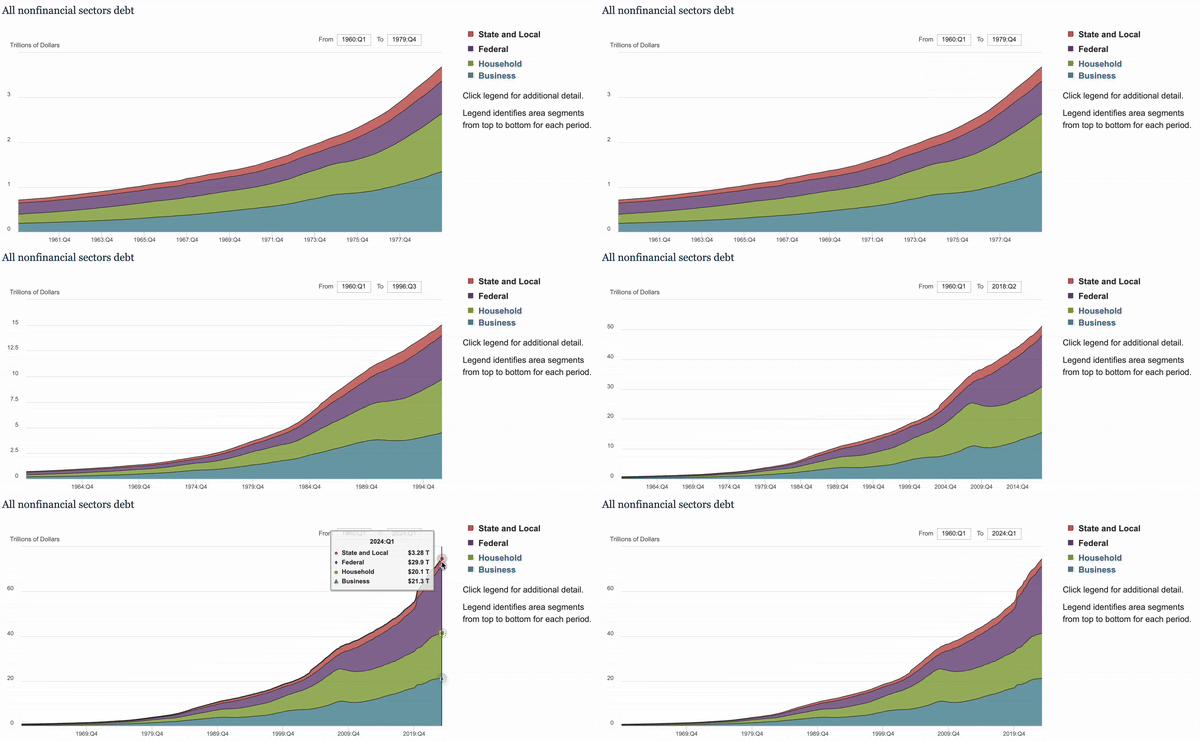
All sectors in this chart are dependent on the ‘price of money’.
Therefore, when looking at interest rates, we should look at the total demand for borrowed funds by all significant borrowers combined (e.g., state and local government, federal government, households and businesses)
And whilst the growth of debt is fascinating (or troubling pending your ideological lens) – I was primarily interested in whether a proven (consistent) relationship exists between:
- changing rate of interest (both short and long-term); vs
- year-over-year change across total aggregate nonfinancial debt.
For example, does a change in borrowing growth (up and down) influence what the Fed does with monetary policy?
It turns out the answer is yes.
To answer this question – I assessed two things:
- The accumulation of all forms of debt over several decades (in terms of YoY % change); and
- Measured that against the relative change in rates
Now with respect to the rates – I used two benchmarks:
- Bank prime rate – the interest rate banks use to set interest rates for many types of consumer loans, such as auto loans, credit cards, and home equity loans; and
- US 10-year yield – the cornerstone of market-based rates.
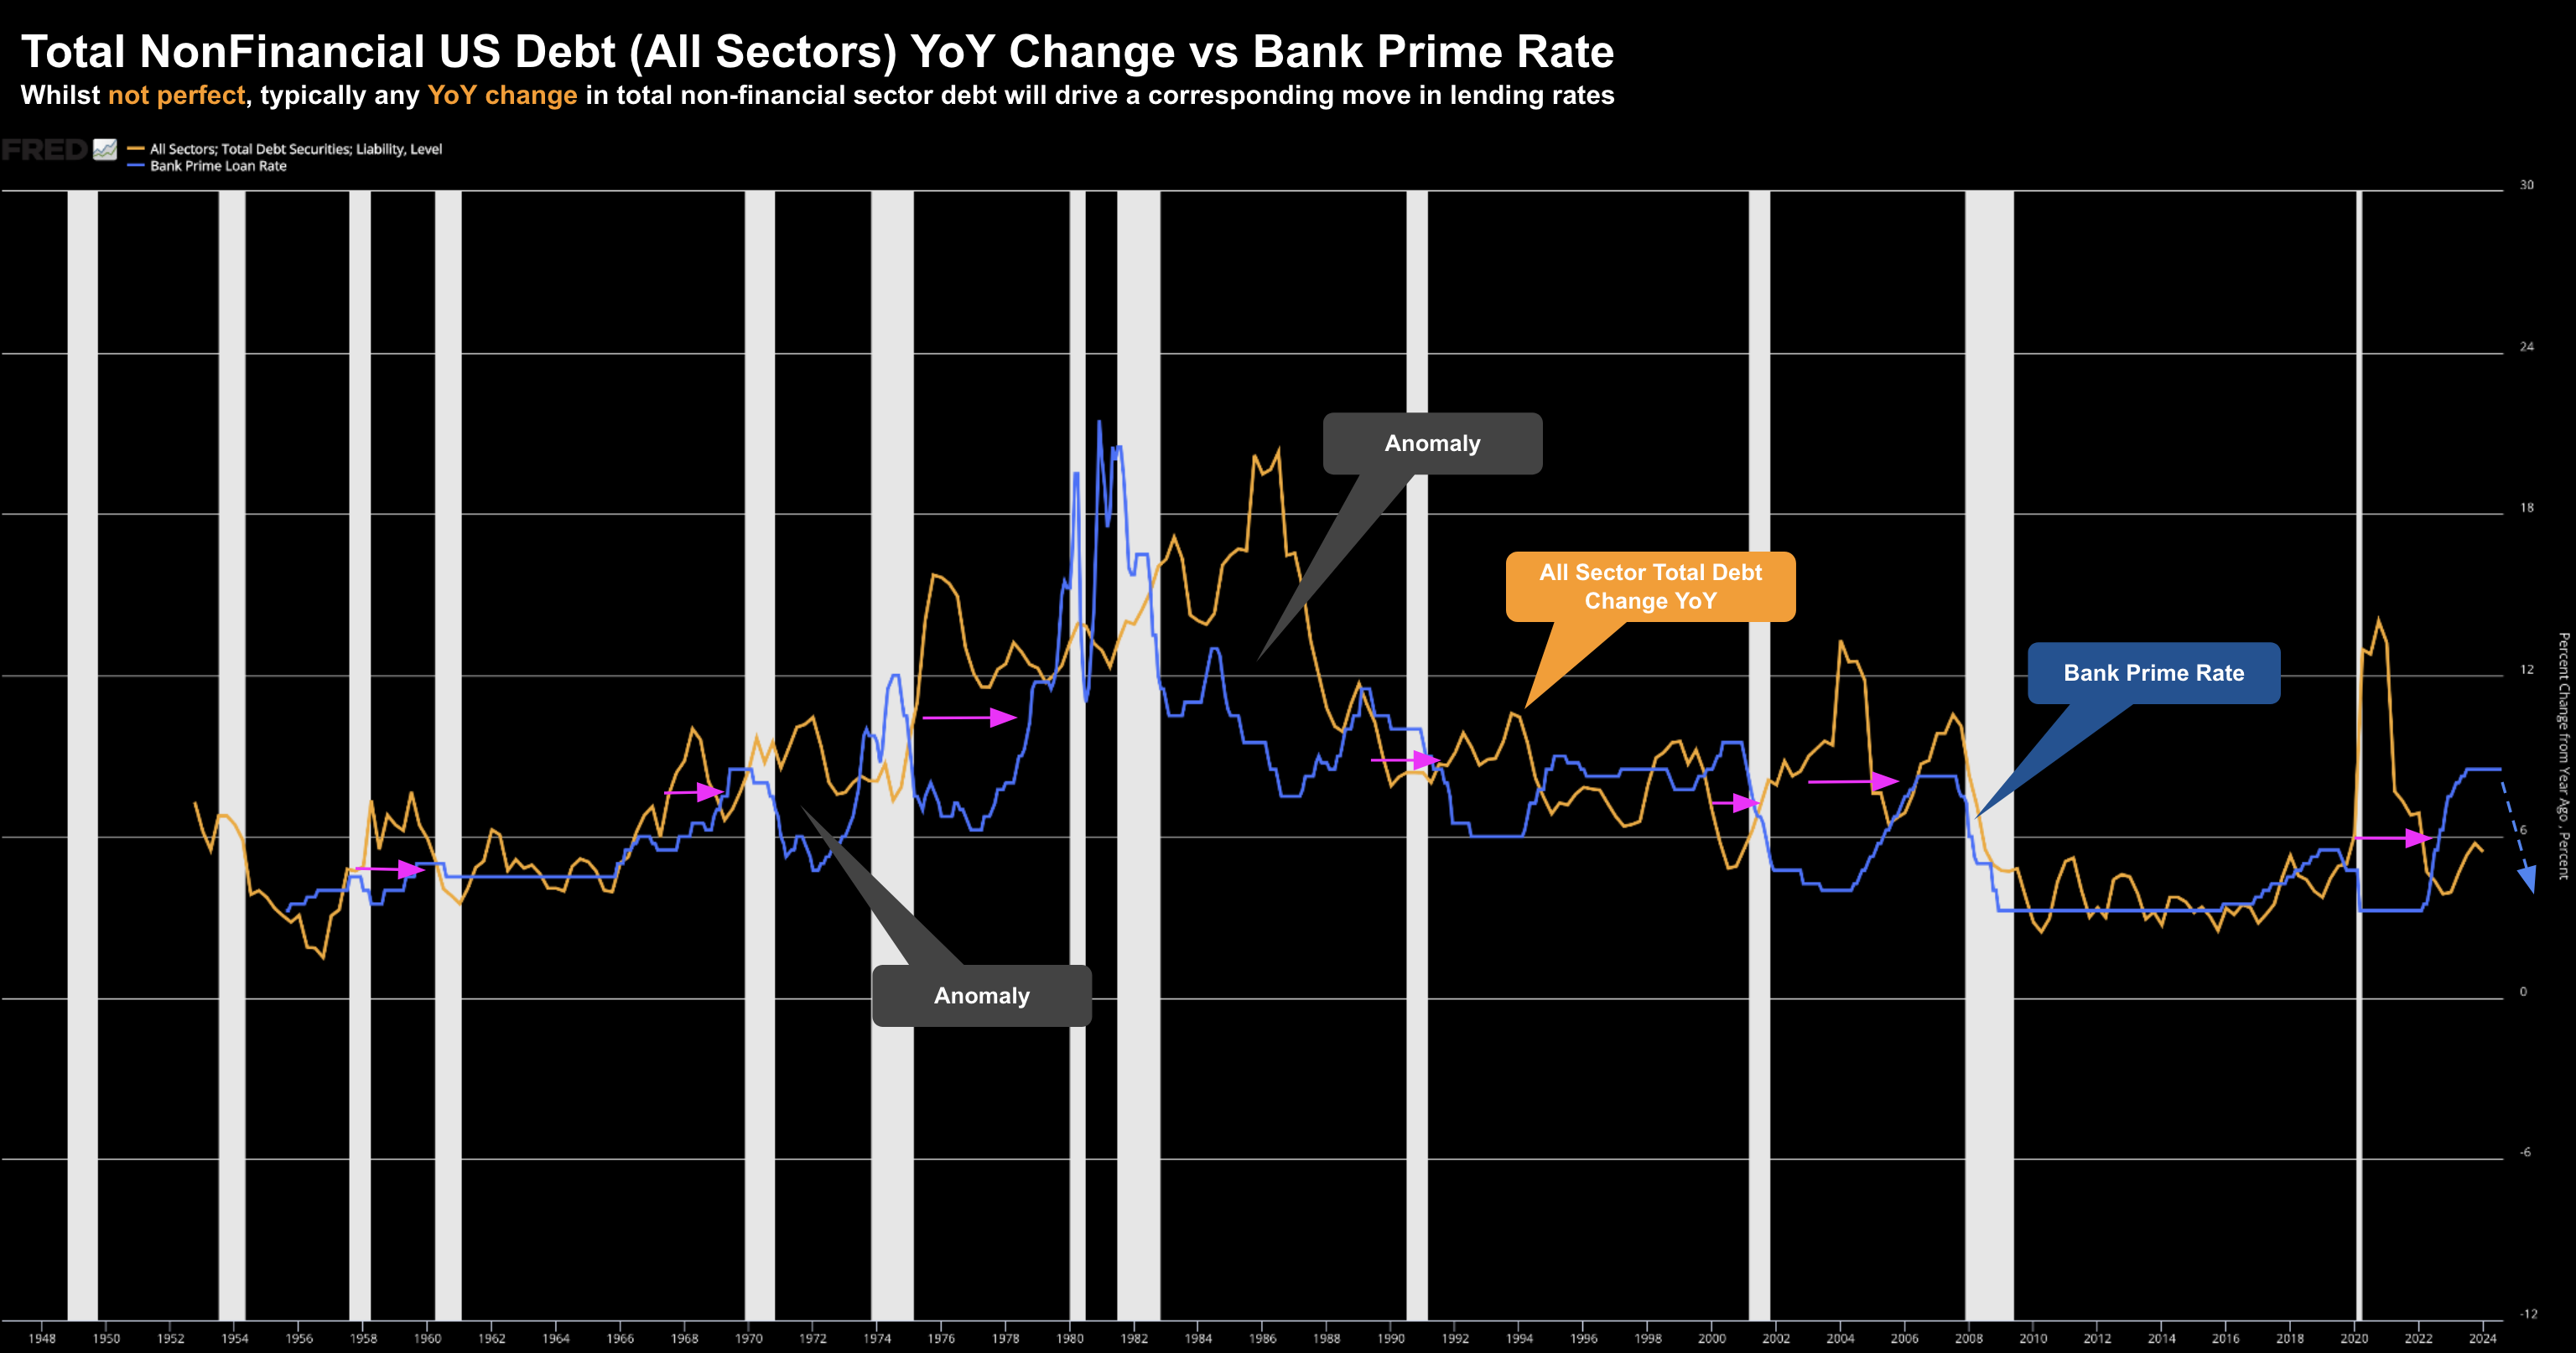
#1. All Nonfinancial Debt YoY Change vs Bank Prime Rate
August 22 2024
Whilst not perfect, there is a persuasive argument to suggest we find causation between the year-over-year change in total borrowing vs the bank prime rate.
For example, the pink arrows show when we see bank lending rates react to the change in debt. In most cases (not all) we see an approximate two-three year lag before market rates respond.
However, there are two anomalies worth highlighting.
In the early to mid 80s – after generational high inflation – interest rates plunged and debt followed. We saw something similar in the early 70s.
That said, in most other instances over the past 50+ years, it has been the change in total debt which has led to a corresponding change in lending rates.
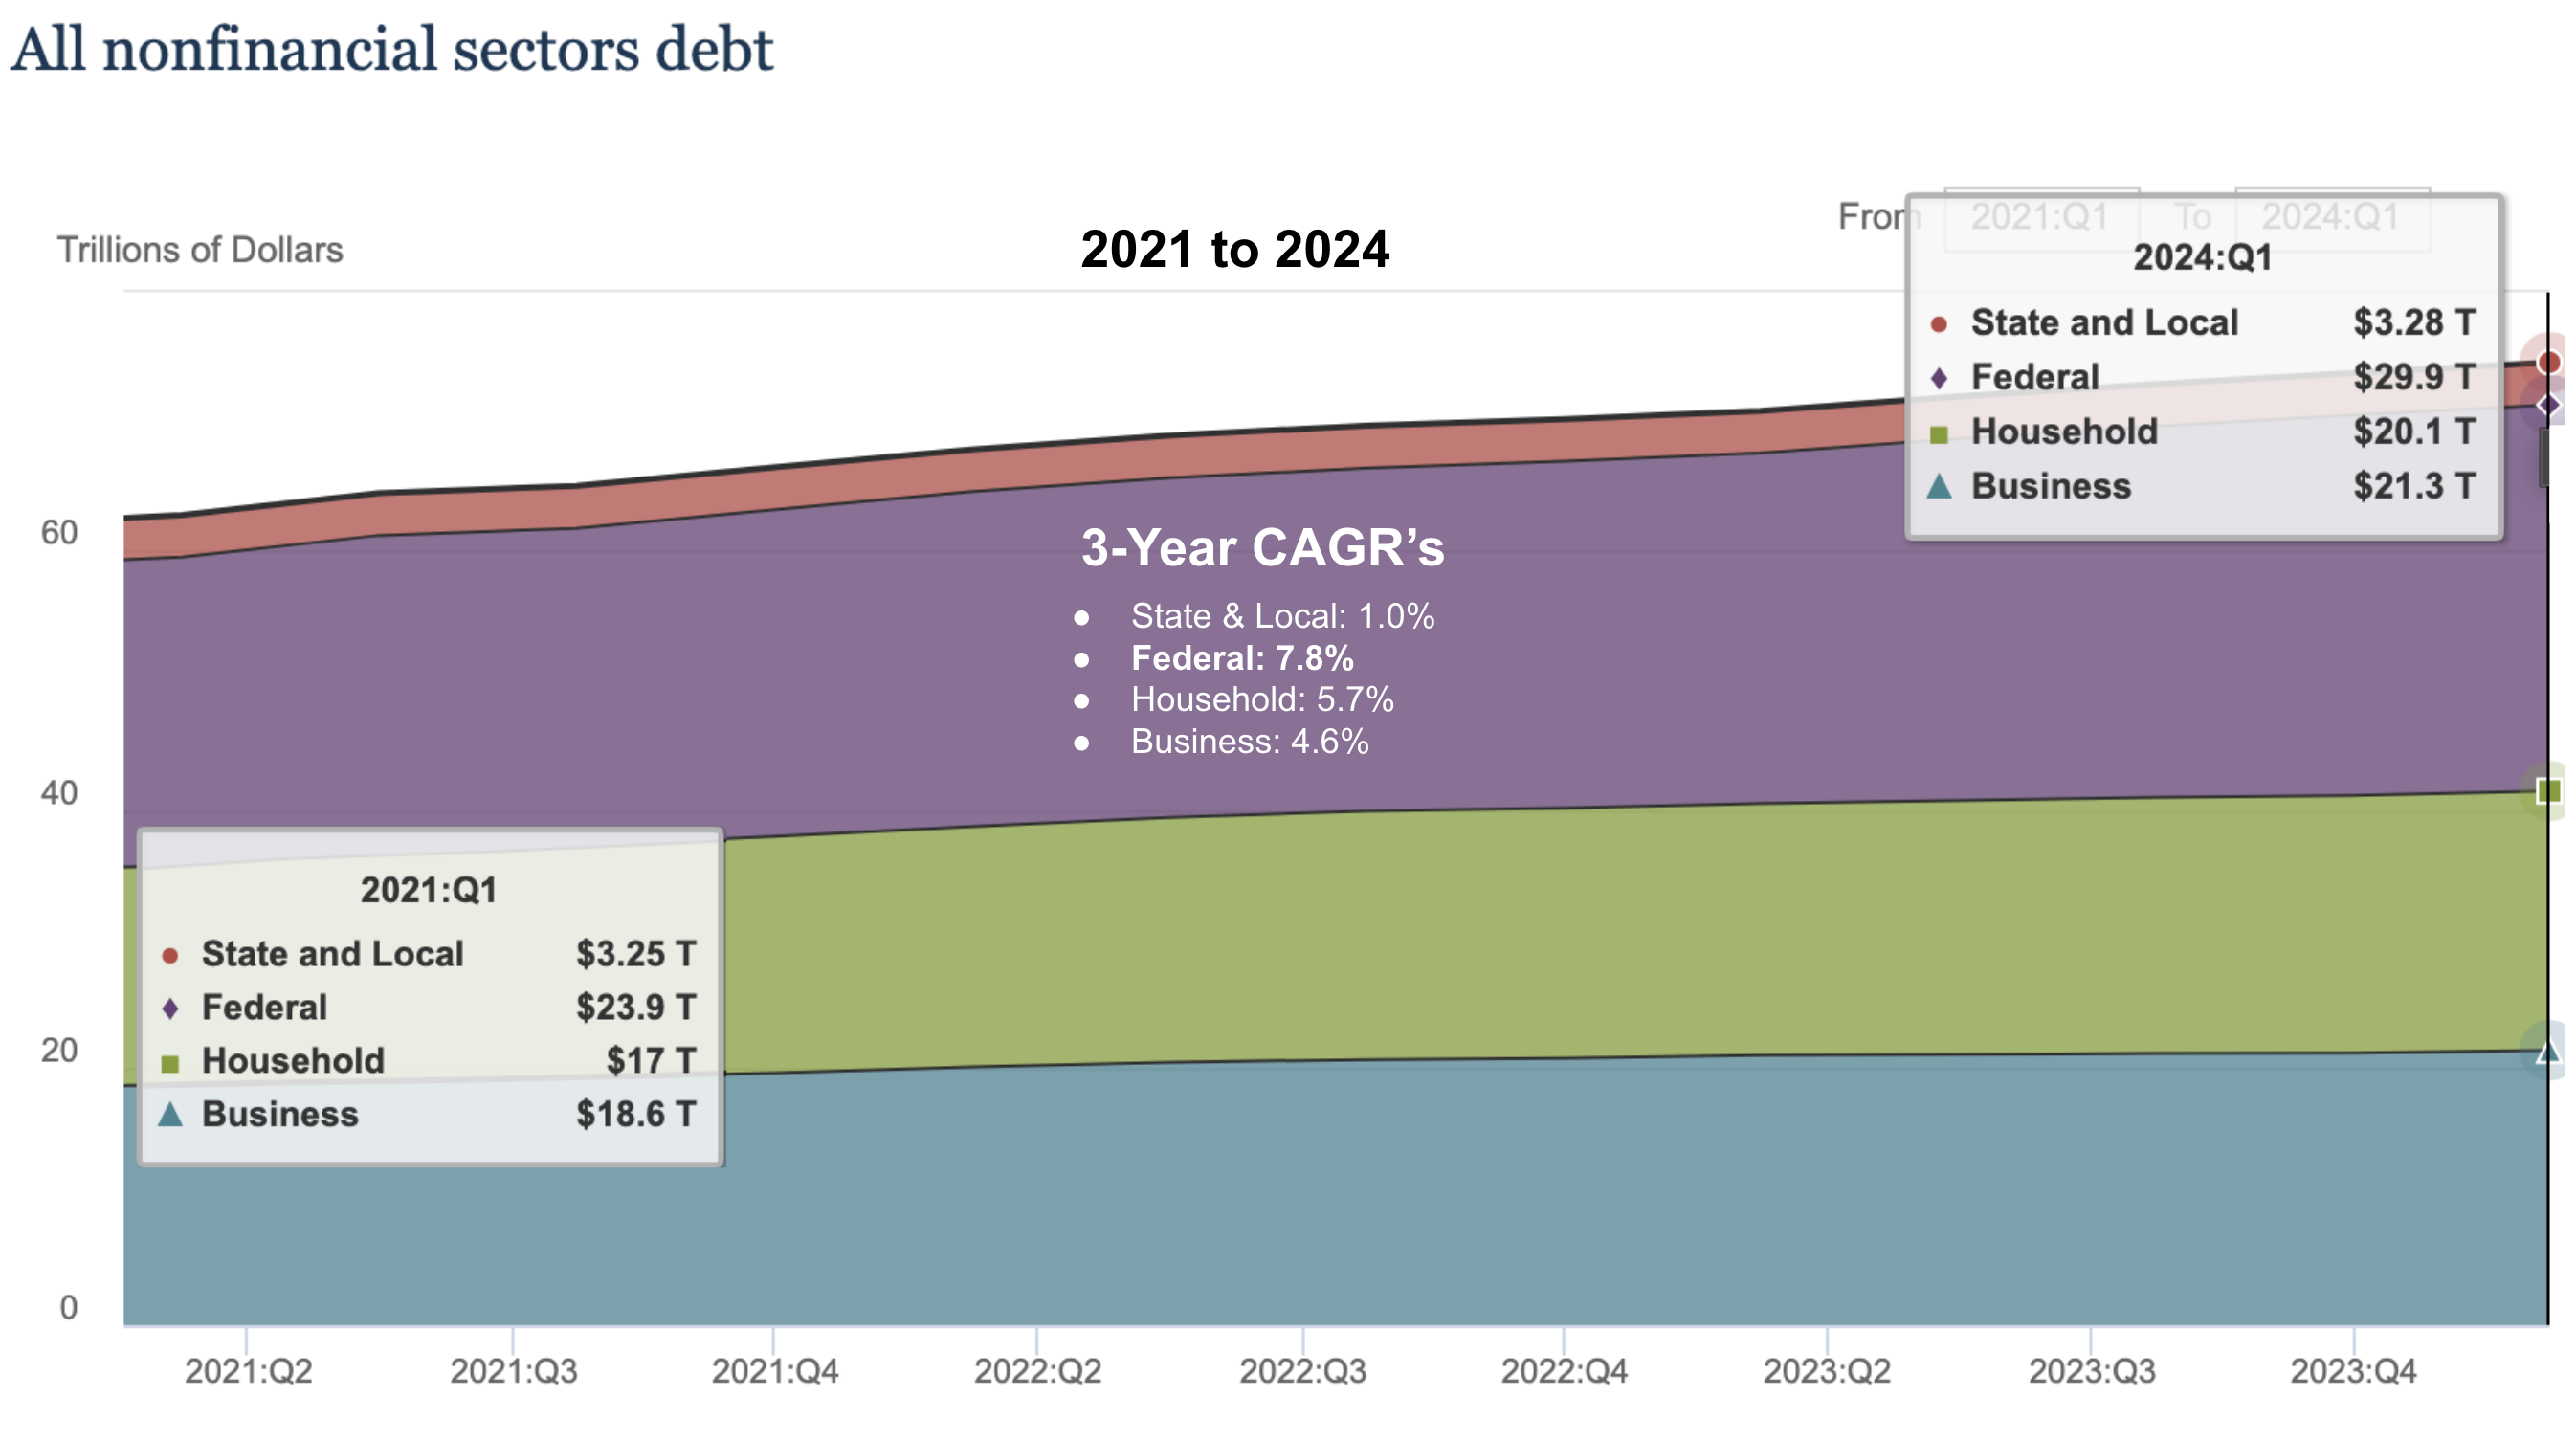
Now it’s worth examining the relative slowdown in aggregate debt growth (all forms) post Q1 2021
Below are the respective CAGRs (for each sector) over the most recent 3-year period:
Whilst the Federal Government has increased spending by $6.0 Trillion over this time (another discussion) – overall debt growth has slowed to around ~4% per year.
Put another way, the private sector (where we want to see investment and expansion to generate growth) – has effectively gone on strike (nb: look no further than the lack of incentives).
Based on this – and given the ~3 year lag – there’s a high probability we see market rates drop over the next 12 months.
Let’s apply the same analysis – replace the bank prime rate with the US 10-year yield (in purple).
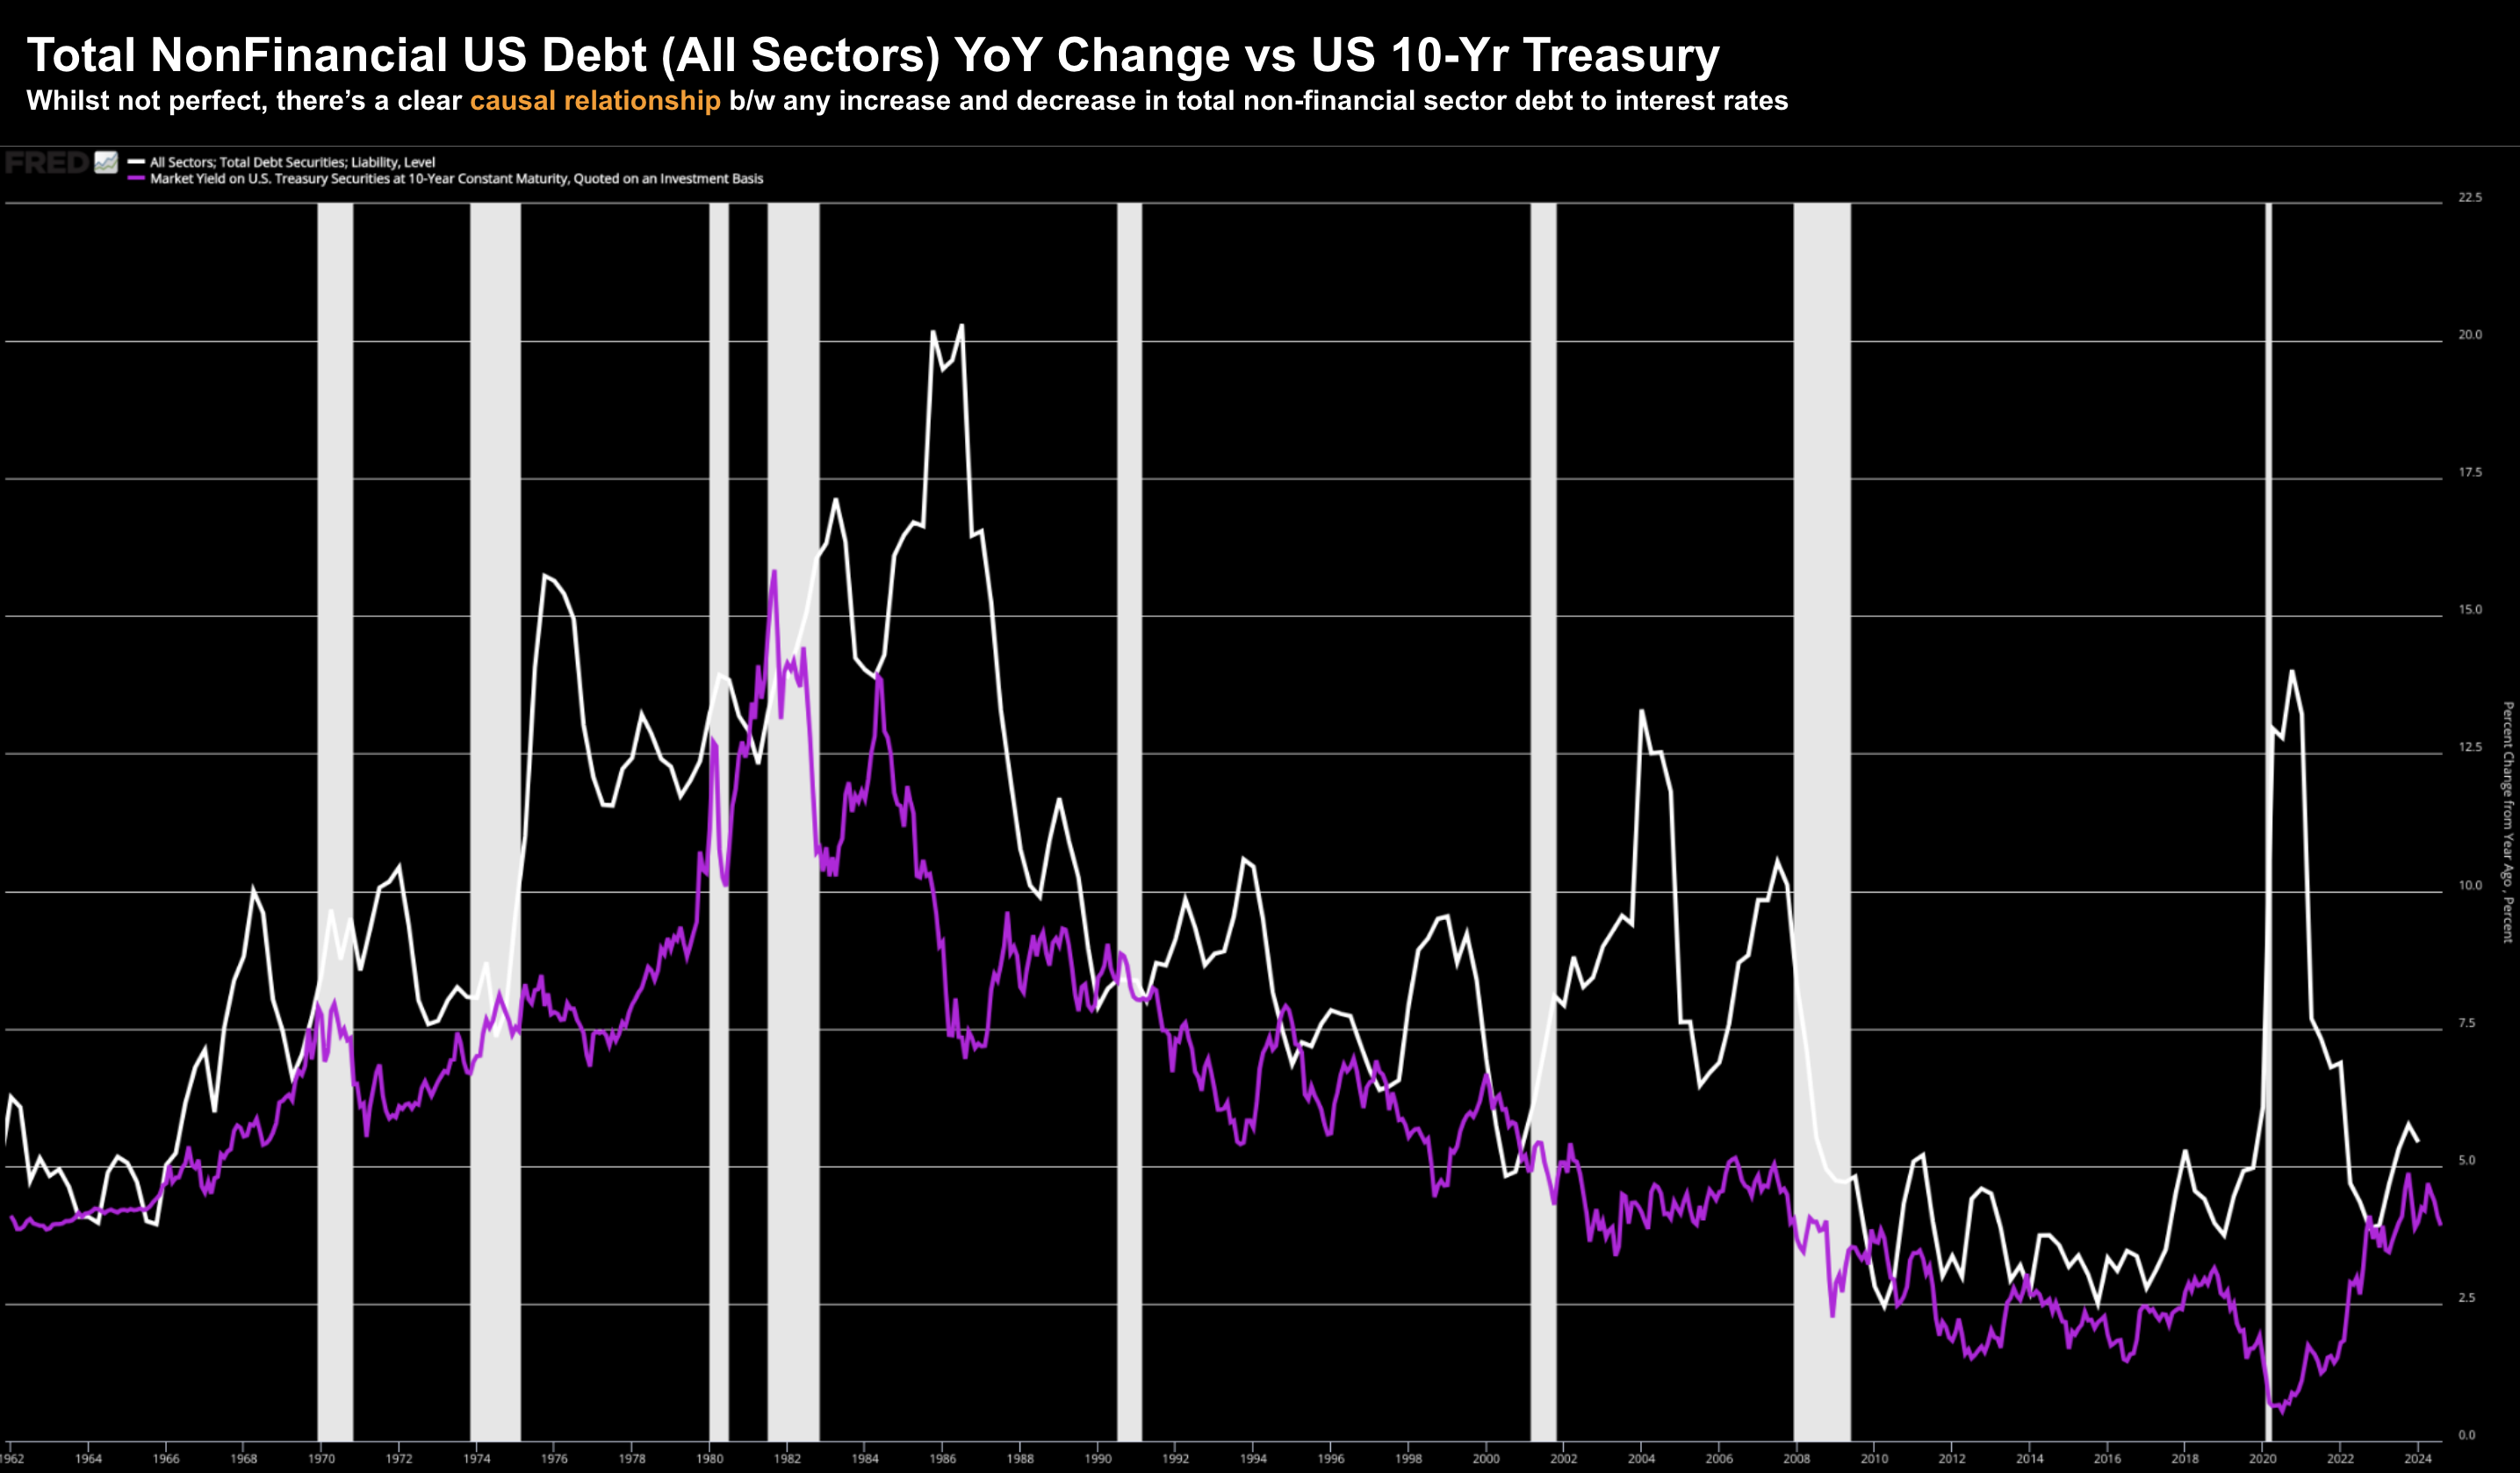
#2. All Nonfinancial Debt YoY Change vs 10-Year Yield
August 22 2024
Here we see a similar correlation….
The general trends of the two datasets tend to follow each other with a lag (barring a couple sharp spikes in debt growth).
This relationship credibly suggests that accelerations and decelerations in the combined growth of federal government, state and local government, corporate, and individual debt usually determines the direction of long-term rates.
To that end, its plausible rates go lower over the next couple of years (as debt growth slowed post 2021)
However, if we’re to see an upward trajectory of year-over-year increases in total debt (which we’ve seen reignite during the course of 2023) – then it’s likely we see a classic divergent lead/lag pattern
From mine, it’s not just inflation and what we see with employment which shape the direction of rates.
We should also carefully evaluate any year-over-year change with total aggregate debt growth across all sectors (not only federal government – which is now the largest contributor at ~40%)
If that continues to accelerate (which is plausible) – it follows rates will then resume their path higher.
Putting it All Together
Expect a mostly dovish tone from Powell this Friday when he speaks at Jackson Hole.
He will most likely indicate the Fed is now in a ‘solid’ position to start easing rates.
And stock have already priced that in.
Given the credible causal relationships I’ve shared with (a) inflation and (b) total aggregate debt – the path for rates seems clear.
However, Fed officials in recent speeches have stressed that the central bank’s moves will depend on what economic data shows.
That’s been a consistent caveat.
Now Powell may not to offer any specifics about how much the Fed will cut rates in September (or future meetings).
Again, why remove optionality?
However, I think he will opt for 25 bps to avoid sending the wrong signal.
Consumers are still spending – albeit more slowly. And stocks remain at or near record highs.
And unless it is messaged very carefully – a 50 basis point cut could show signs of panic the economy is weakening faster than expected.
In closing, regardless of whether we see “25, 50, 75 or 100 bps” of cuts between now and December, keep a close eye on employment.
And whilst it’s a lagging indicator – if the Fed are cutting into weakening jobs – stocks will likely react less favorably.

