- Forecasting the timing of ‘long and variable’ lags is impossible
- More cracks appear in the labor market… as unemployment ticks up
- Is the market paused to take a breather… and what NVDA tells us
If you’re a keen follower of “Fed speak” – you will have heard the following phrase more than once:
“Monetary policy works with long and variable lags”
Fed Chair Jay Powell said as much in June.
For example, have a read of this question from the Washington Post to Chair Powell eight months ago:
Hi, Chair Powell. Rachel Siegel from the Washington Post. Thanks for taking our questions. I wanted to ask further on the lag effects—when you’re considering when you would hike again throughout the course of the year, are there things that you would expect to kick in as those lag effects come, come into effect that would inform your decisions? Have you learned things over the past year that give you some sense of timeline for when to expect those lags to come into effect?
As an experienced financial journalist, Rachel should know that this is an impossible question to answer.
In short, there are far too many variables in the economy. And unfortunately, the borrowing and spending patterns of ~330M consumers does not happen in a vacuum (as some like to think).
That said, this was Chair Powell’s considered response:
Yeah. So it’s a—it’s a challenging thing in economics. It’s, it’s sort of standard thinking that monetary policy affects economic activity with long and variable lags.
Of course, these days, financial conditions begin to tighten well in advance of actual rate hikes.
So if you—if you look back when we were lifting off, we started talking about lifting off—by the time we had lifted off, the two-year [interest rate], which is a pretty good estimate of where [monetary] policy is going, had gone from 20 basis points to 200 basis points.
So in that sense, tightening happens much sooner than it used to in a world where— where news was in newspapers and not, you know, not on, on the wire.
So that’s, that’s different.
But it’s still the case that what you see is interest-sensitive spending is affected very, very quickly—so housing, and durable goods, and things like that.
But broader demand, and spending, and, and asset values, and things like that—they just take longer.
Obviously what Powell (or anyone) cannot answer is how much longer?
As to the question of “how long” – Milton Friedman – who coined the term “long and variable lags” – published a paper titled “Have Monetary Policies Failed?”
He concluded that it could take up to two years before the full effects are found on inflation.
During the 1970s, as the government and the Federal Reserve struggled to tame inflation, some of Friedman’s ideas were proven right.
However, today it’s (perhaps falsely) assumed these lags are now somewhat shorter than approx two years.
For example, echoing Powell’s sentiment in June – Fed President Christopher Waller said:
… [previously] markets had to kind of go figure out that the Fed was in there doing something. That’s not how we do things anymore. We start telling people in advance.”
In addition, we now have far more sophisticated (real-time) data tools which (in theory) allows the market to be more responsive (note: more on this later when I talk to the massive downward revisions to the latest employment numbers – why do we always get it so wrong?)
That said, despite the advancements in technology and the Fed’s more open communication channels, has that much changed over the past 60 years?
I don’t think so…
Long and variable lags still exist with monetary policy. And as I say – nothing happens in a vacuum.
Experts like Powell are still unable to give a precise answer to the question the Washington Post asked.
All he can say something along the lines of “…things like broader demand, spending and asset prices just take longer”.
Whilst they may take longer (whatever ‘longer’ is said to mean) – it’s not a question of if the (negative) impacts of slowing demand and lower asset prices hit… it’s a question of when.
That’s something the stock market is yet to reckon with.
The Lagging Impact on Employment
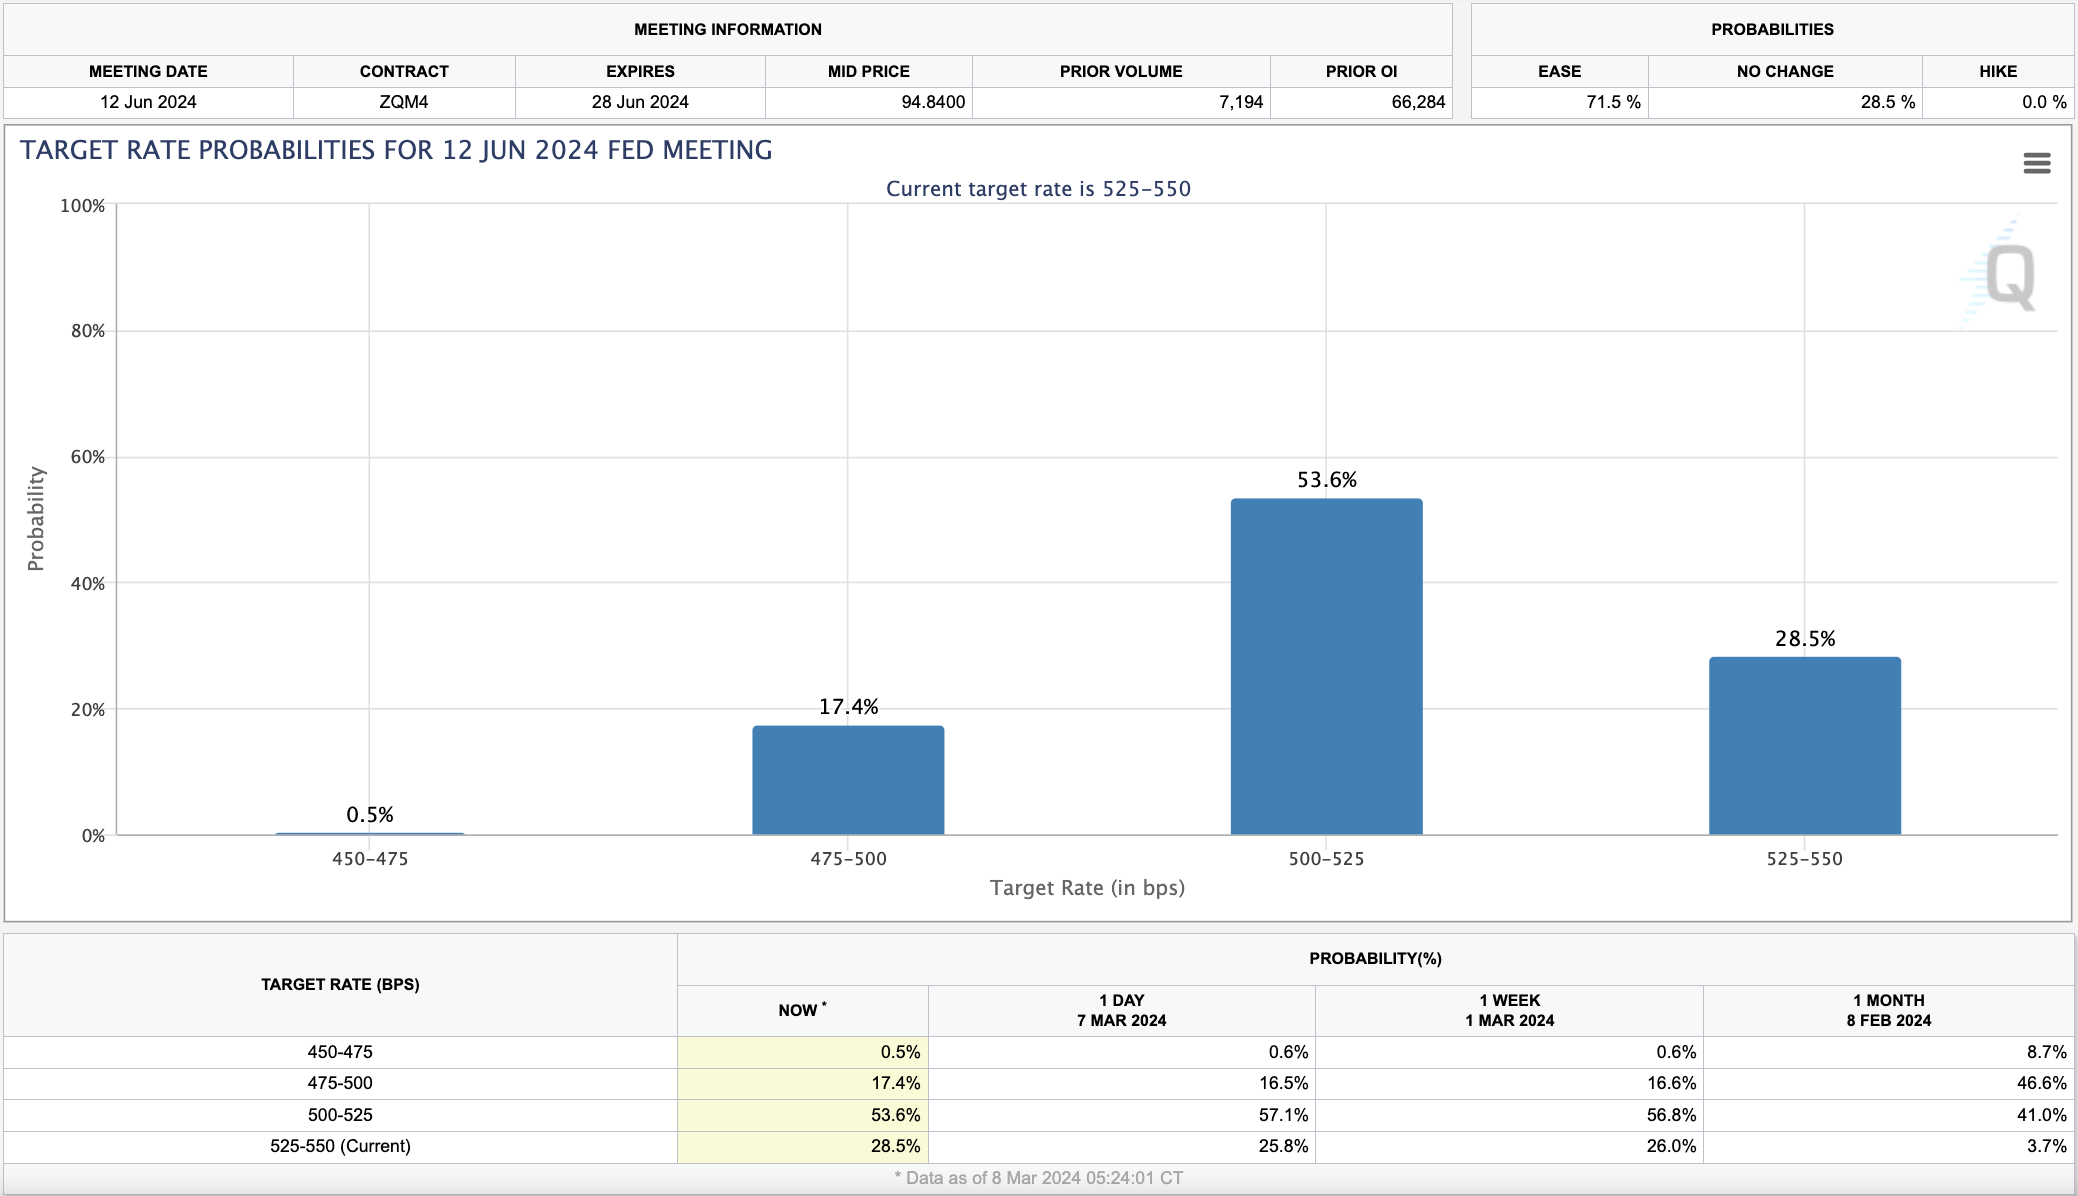
According to the CME’s FedWatch Tool – the market believes the Fed’s first rate cut will be June.
The market has priced in this cut opposite two key assumptions:
- Core inflation (including services and wages) will have sufficiently cooled enough for the Fed to cut rate; and
- The broader slowing in the economy will also justify monetary easing
Again, these assumptions will change pending what we see with inflation prints and employment.
For example, last month saw the hottest Core Services inflation print in several years, up a whopping 0.6% MoM. That will raise an eyebrow at the Fed.
But with respect to employment – whilst the job market is still considered tight (with 9M open jobs and an unemployment rate below 4.0%) – there are some early signs of cooling (as I touched on last week)
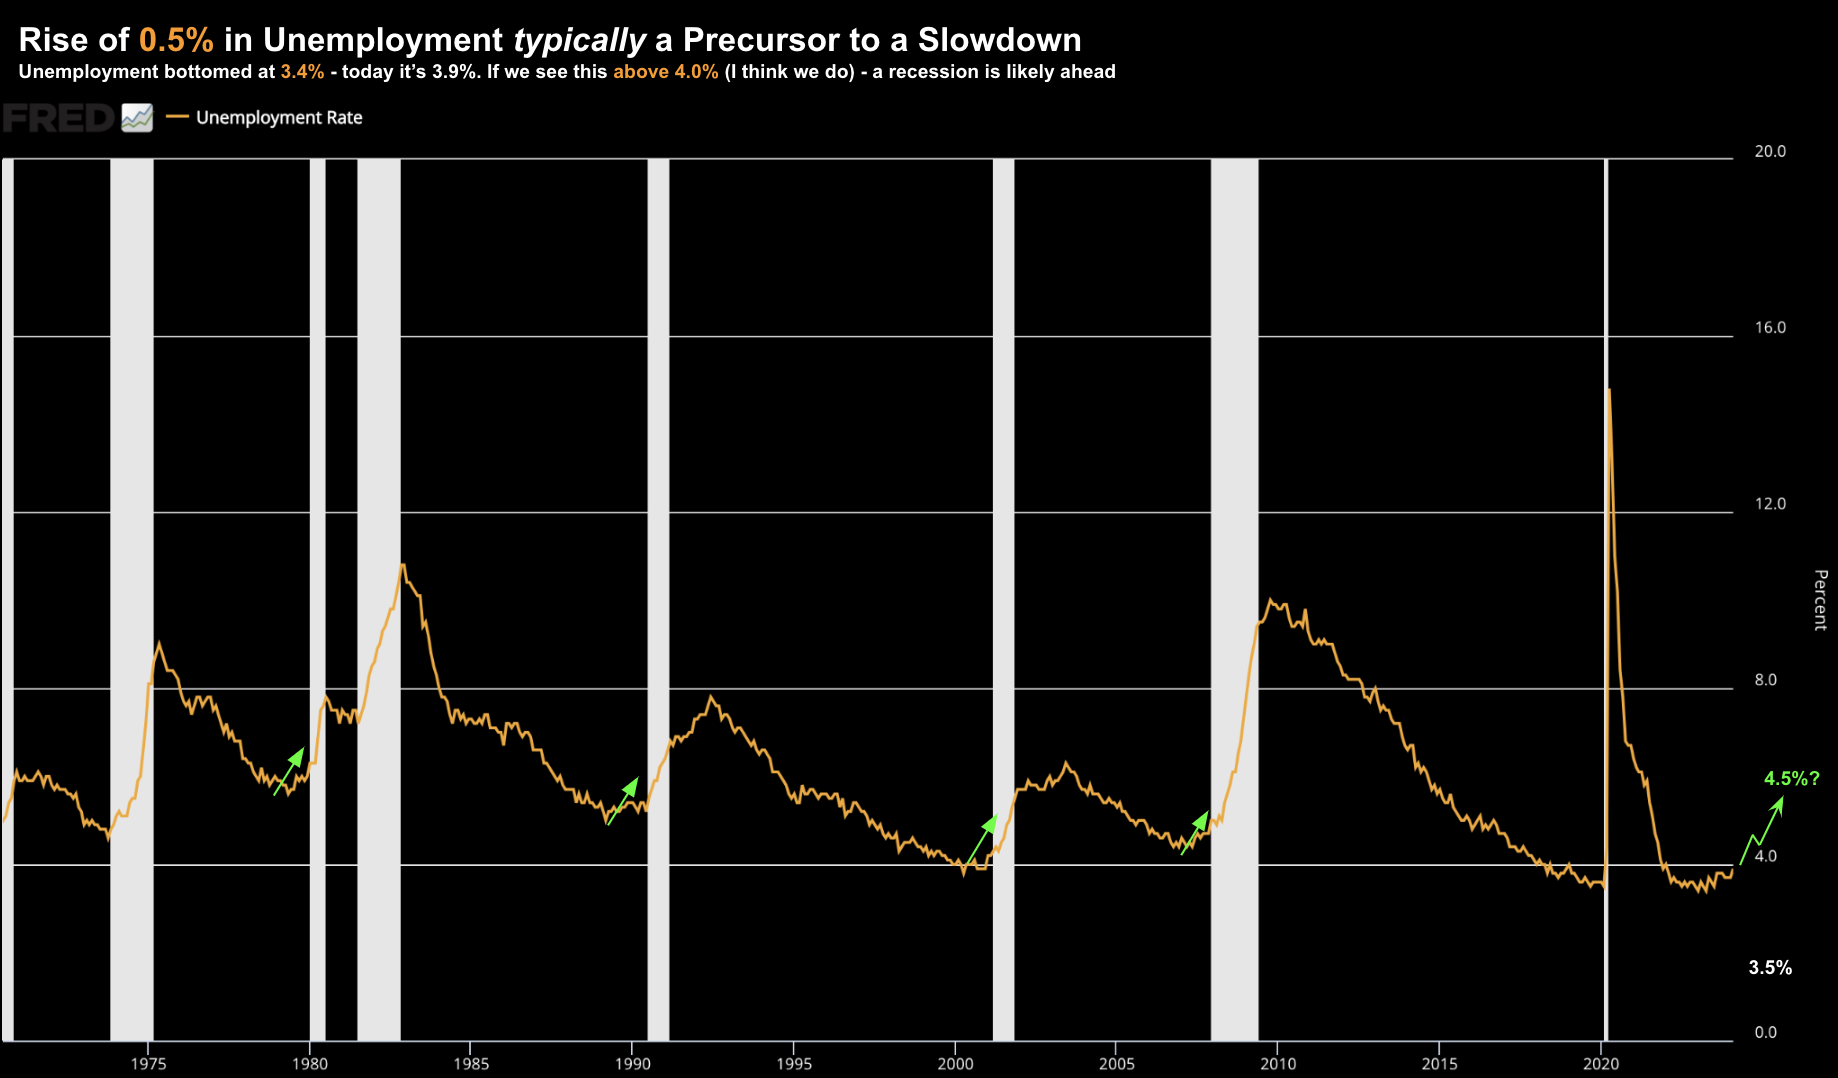
Students of economic history will know that sharp rises in the unemployment rate (e.g., more than 0.5% change) often precede economic slowdowns.
Consider the long term chart below for unemployment:
As the chart shows, unemployment bottomed in April 2023 at 3.4%
Today’s labor report told us that this figure is now 3.9%.
- An increase of 275,000 payrolls in February – well above the 200,000 consensus
- Average hourly earnings grew at the slowest rate since Feb 2022 – 0.1% MoM and (m/m) and 4.3% YoY; and
- Labor force participation rate remained at 62.5%, down from November’s 62.8%.
Just a quick note on the 275K monthly job additions – this is misleading.
For example, last month was said to gain 353,000 jobs – a figure I expected would be revised lower. As it turns out – that number is now just 229K.
That’s a large revision lower (n.b., what was that about sophisticated real-time tools vs the 1970s?!)
In addition, the two-month revision of negative 167K jobs implies that December’s report was revised down by a further 43,000.
Back of the envelope math tells me the headline “75,000 beat” (which the market was quick to cheer) was actually a 92,000 miss on a rolling 3-month basis.
But that’s not a headline you will hear from the government or mainstream media.
Now, slowing wage growth is very good news. From mine, this gives the Fed a small bit of latitude to potentially cut.
And whilst 4.3% YoY is uncomfortably high (the Fed’s goal is 3.0%) – the month-on-month number of 0.1% is welcomed news.
As I’ve written in the past – the slowing landscape for jobs is very typical of a “late cycle” market. Repeating what I said last October:
A late cycle market is characterized by when we have close to full employment. With full employment, economic activity is typically more robust however closer to its peak. This implies that growth remains positive but there are signs of it slowing.
Investors should understand that this is the riskiest and most difficult part of the economic cycle to navigate.
Put another way, it’s not the phase of the cycle where you want “100%” asset exposure – as things can turn sharply.
When I look at the data – we’re watching both labor conditions and consumption deteriorate.
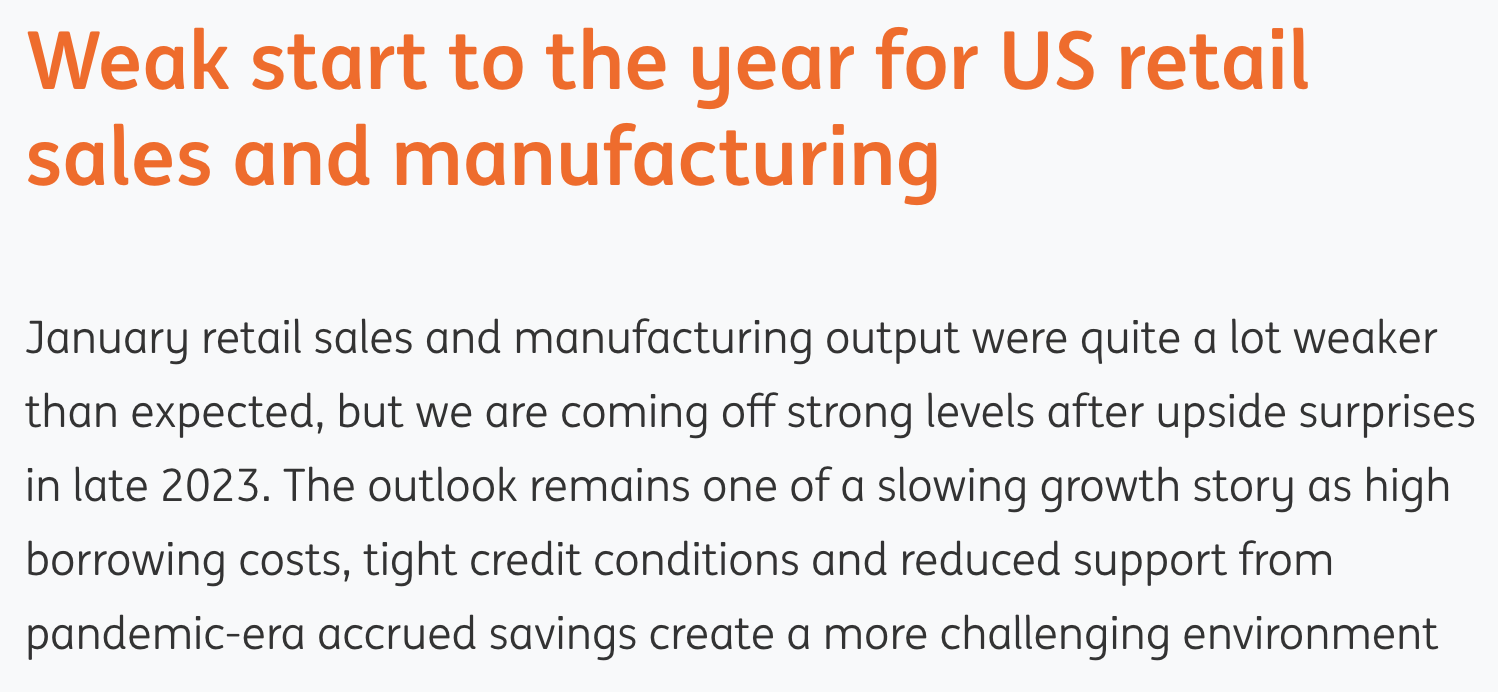
For example, I called out the very weak start to 2024 retail spending recently – also talking to consumer patterns here.
That said, we know these (waning) patterns can often persist longer than we think.
This was the case through 2023…
~$2 Trillion in pent-up savings; ~$6 Trillion in fiscal spending / borrowing; and ~75% of Americans securing 30-year mortgages below 4.0%… have all helped offset the impact of tighter monetary policy.
But over time – the so-called long and variable lags of monetary policy will continue to slowly work their way through the economy.
And I think we’re just starting to see these impacts now… not that equities have taken notice.
S&P 500 Hits Pause
It was a wild ride for stocks to close the week – mostly lead by the rise (and pivot) by Nvidia (NVDA)
From mine, NVDA is now the barometer for the entire market.
Today was case in point. The AI chip maker was ~5% higher earlier in the session – almost testing $1,000 a share – only to sharply reverse by the close.
Not surprisingly, that was the same pattern for the S&P 500. NVDA’s weekly chart is below:
March 8 2024
As an aside, I mentioned to a friend earlier in the week – with NVDA trading around $850 – that it’s likely to test $1,000. For context, this friend was looking to short the stock… to which I added “good luck with that… you’re a bold man”
I also reminded him:
“There are old traders. And there are bold traders. But there are few old bold traders”
This week alone – NVDA moved 15.4% from low to high. That’s extraordinary for a stock with a market cap of around ~$2.2 Trillion (and not far below Apple at ~$2.6 Trillion).
However, with NVDA’s index weighting disproportionately large (now the third largest on the S&P 500) – any meaningful move in either direction is going to shift the market.
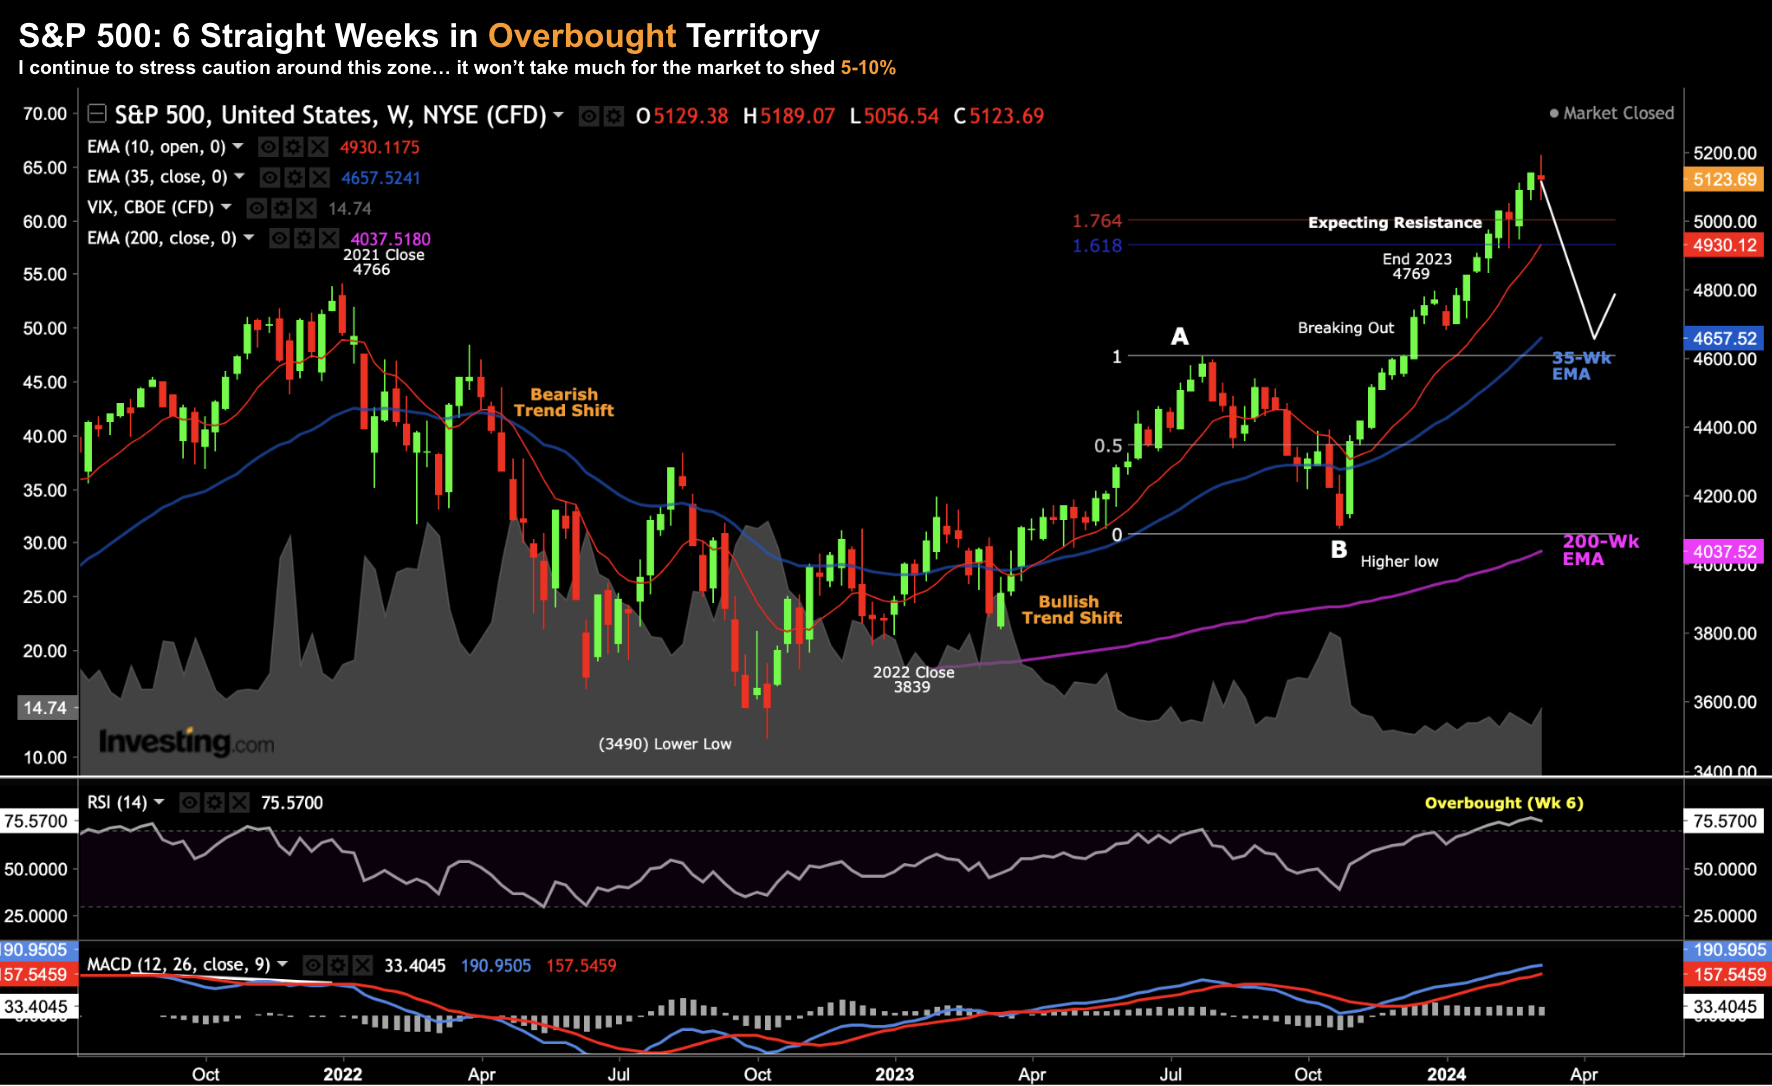
Let’s turn to the S&P 500 – are things about to turn lower?
March 8 2024
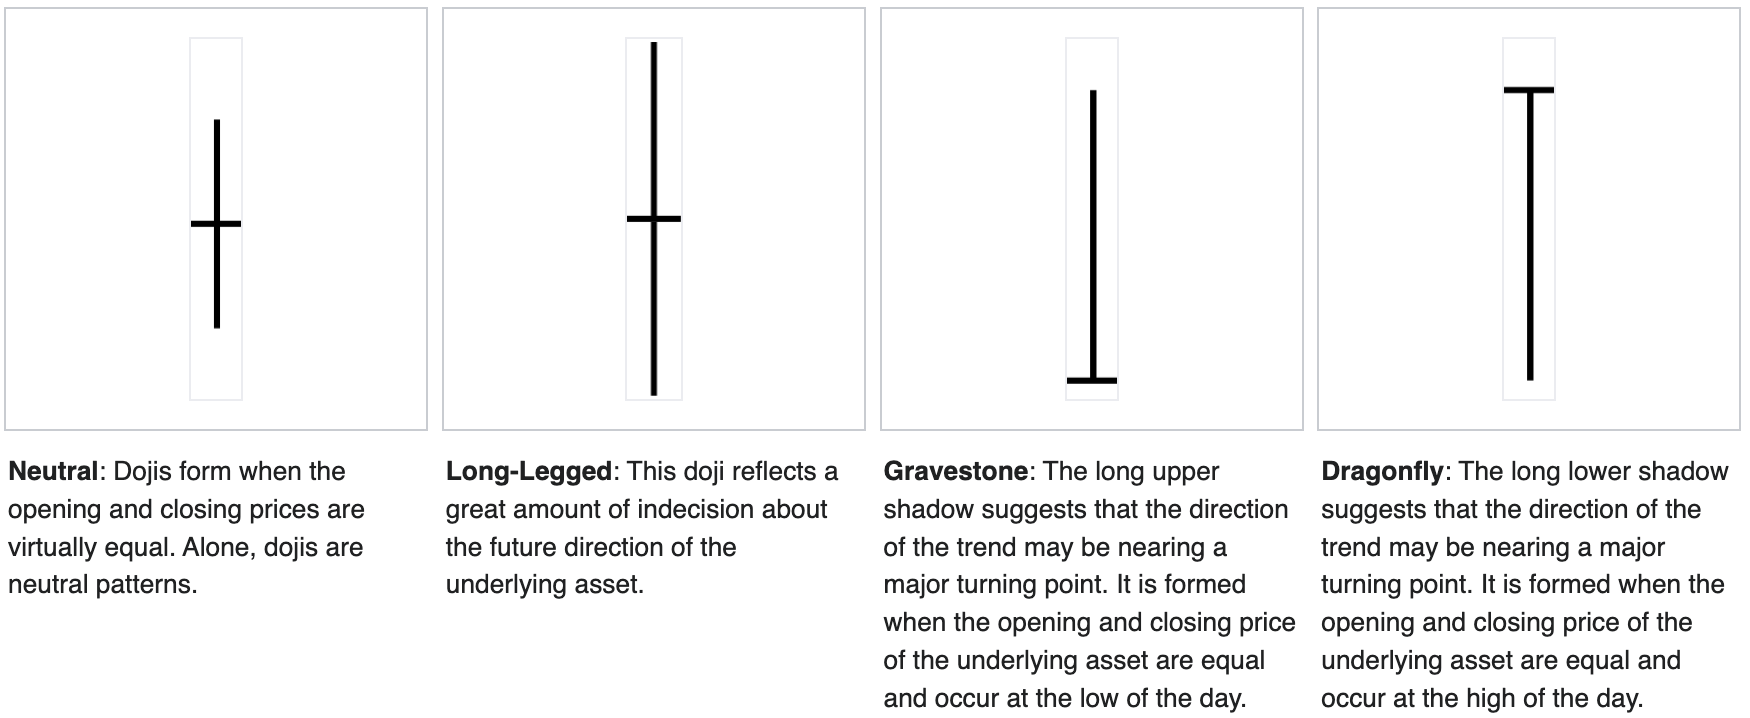
Here I draw your attention to the candle type we saw this week.
Chartists would call this a long-legged “doji” – a pattern which expresses indecision from traders. Below are the four types of ‘doji’ candles:
What’s important is doji formations are often (not always) reversal signals.
However, this remains to be seen. I don’t treat doji candles as trading signals – merely an observation.
Speaking more broadly, we’re now six consecutive weeks in overbought territory on the weekly RSI.
And whilst that’s not unusual or a trading signal to take in isolation (as markets can stay overbought for weeks and months) – it does suggest caution.
The other observation is the very low VIX at 14.7
From mine, this suggests a high degree of complacency given the risks (i.e., the attitude that nothing can go wrong).
But as they say… “when everyone leans to one side of the boat” – well you know what happens.
Putting it All Together
My word of advice for those who feel money is burning a hole in their pocket is don’t suffer FOMO.
It’s a dangerous mindset to fall victim too.
These kinds of momentum spikes are not usual.
I’ve seen very similar patterns repeat over and over in my 25+ years trading markets.
You expect them… you don’t chase them.
When I started this game in the mid-90s – I fell victim to it.
I learned about chasing momentum in the early 2000s – chasing charts very similar to NVDA. In fact, almost every tech chart resembled NVDA back then (especially CSCO).
For about 12 months I felt like a genius… my portfolio up over 70% in a year. I was thinking this investing game was easy.
Fast forward to 2001 and I was humbled.
Those were my “tuition fees”.
And now I feel very lucky to have learned from such a valuable lesson whilst still in my mid 20’s. The best time you can make (big) mistakes is when you are young.
You will pay to play when it comes to asset speculation. And most of us will pay in two ways:
- Time spent learning how to trade / understand markets; and/or
- With meaningful capital losses
If you’re really lucky – you may avoid the latter (I wasn’t able to)
But you cannot avoid the former.
Don’t be tempted to chase this market higher… FOMO seldom pays dividends. This is a long game.
Stay patient and wait for quality stocks to come to you.

