- “Sell in May and Go Away” – an old market adage I don’t pay attention to
- Why one analysts sees “euphoria” in stocks (which is true in parts)
- Another great book to add to your collection
It’s that time of year…
“Sell in May and Go Away” is an old market adage.
Personally I don’t give it much weight… basically none.
Who invests with a timeframe of only a handful of months?
Not many that I know who are consistently profitable.
But therein lies the rub:
This saying is very much a function of how you choose to invest.
Your time horizons are likely very different to mine.
This post will offer some background where the adage comes from.
And from there, I will try and answer the question of whether the market is “euphoric”.
And finally, I’ll share some names that I’ve been adding to.
Spoiler alert: it’s not NVDA.
Why Sell in May?
For me, May is no different to any of the other 11 months in the year.
It might be opportunistic or it could be a time to take profits.
However, when viewed over a horizon of many years – you accept that it’s just another month where anything can happen.
However, the saying goes that investors are wise to consider selling their stocks in May and re-entering the market around September or October.
This idea is rooted in the historical observation that the stock market tends to underperform from May through October.
For example, during this period, we typically find:
- Lower trading volumes (as investors take summer holidays) – leading to less activity and potentially increased volatility.
- Fewer catalysts resulting in lower stock momentum; and
- May to September averaging a return of 2% vs ~7% during the period October through April.
But again, much of this comes back to your own trading and/or investing plan.
As someone who tends to hold stock positions for years (i.e., not weeks or months) – the adage is basically meaningless.
But if you’re a short-term trader (e.g., you’re trying to time trades from one month to the next) – the adage might be relevant.
Are we “Euphoric”?
For example, does it include such things as:
- Forward PE’s in excess of 21x?’
- The market at all-time highs; or up over 20% in a few months?
- Earnings growth expectations of 12% YoY?
- Very low (or no) risk of recession over the next 12 months?
Maybe there’s an element of each… I don’t pretend to know.
I will share one leading analyst’s view shortly – who leans into a multitude of indicators to suggest it could be time to take profits.
Irrespective, we can say the market is ‘quite optimistic‘ to say the least.
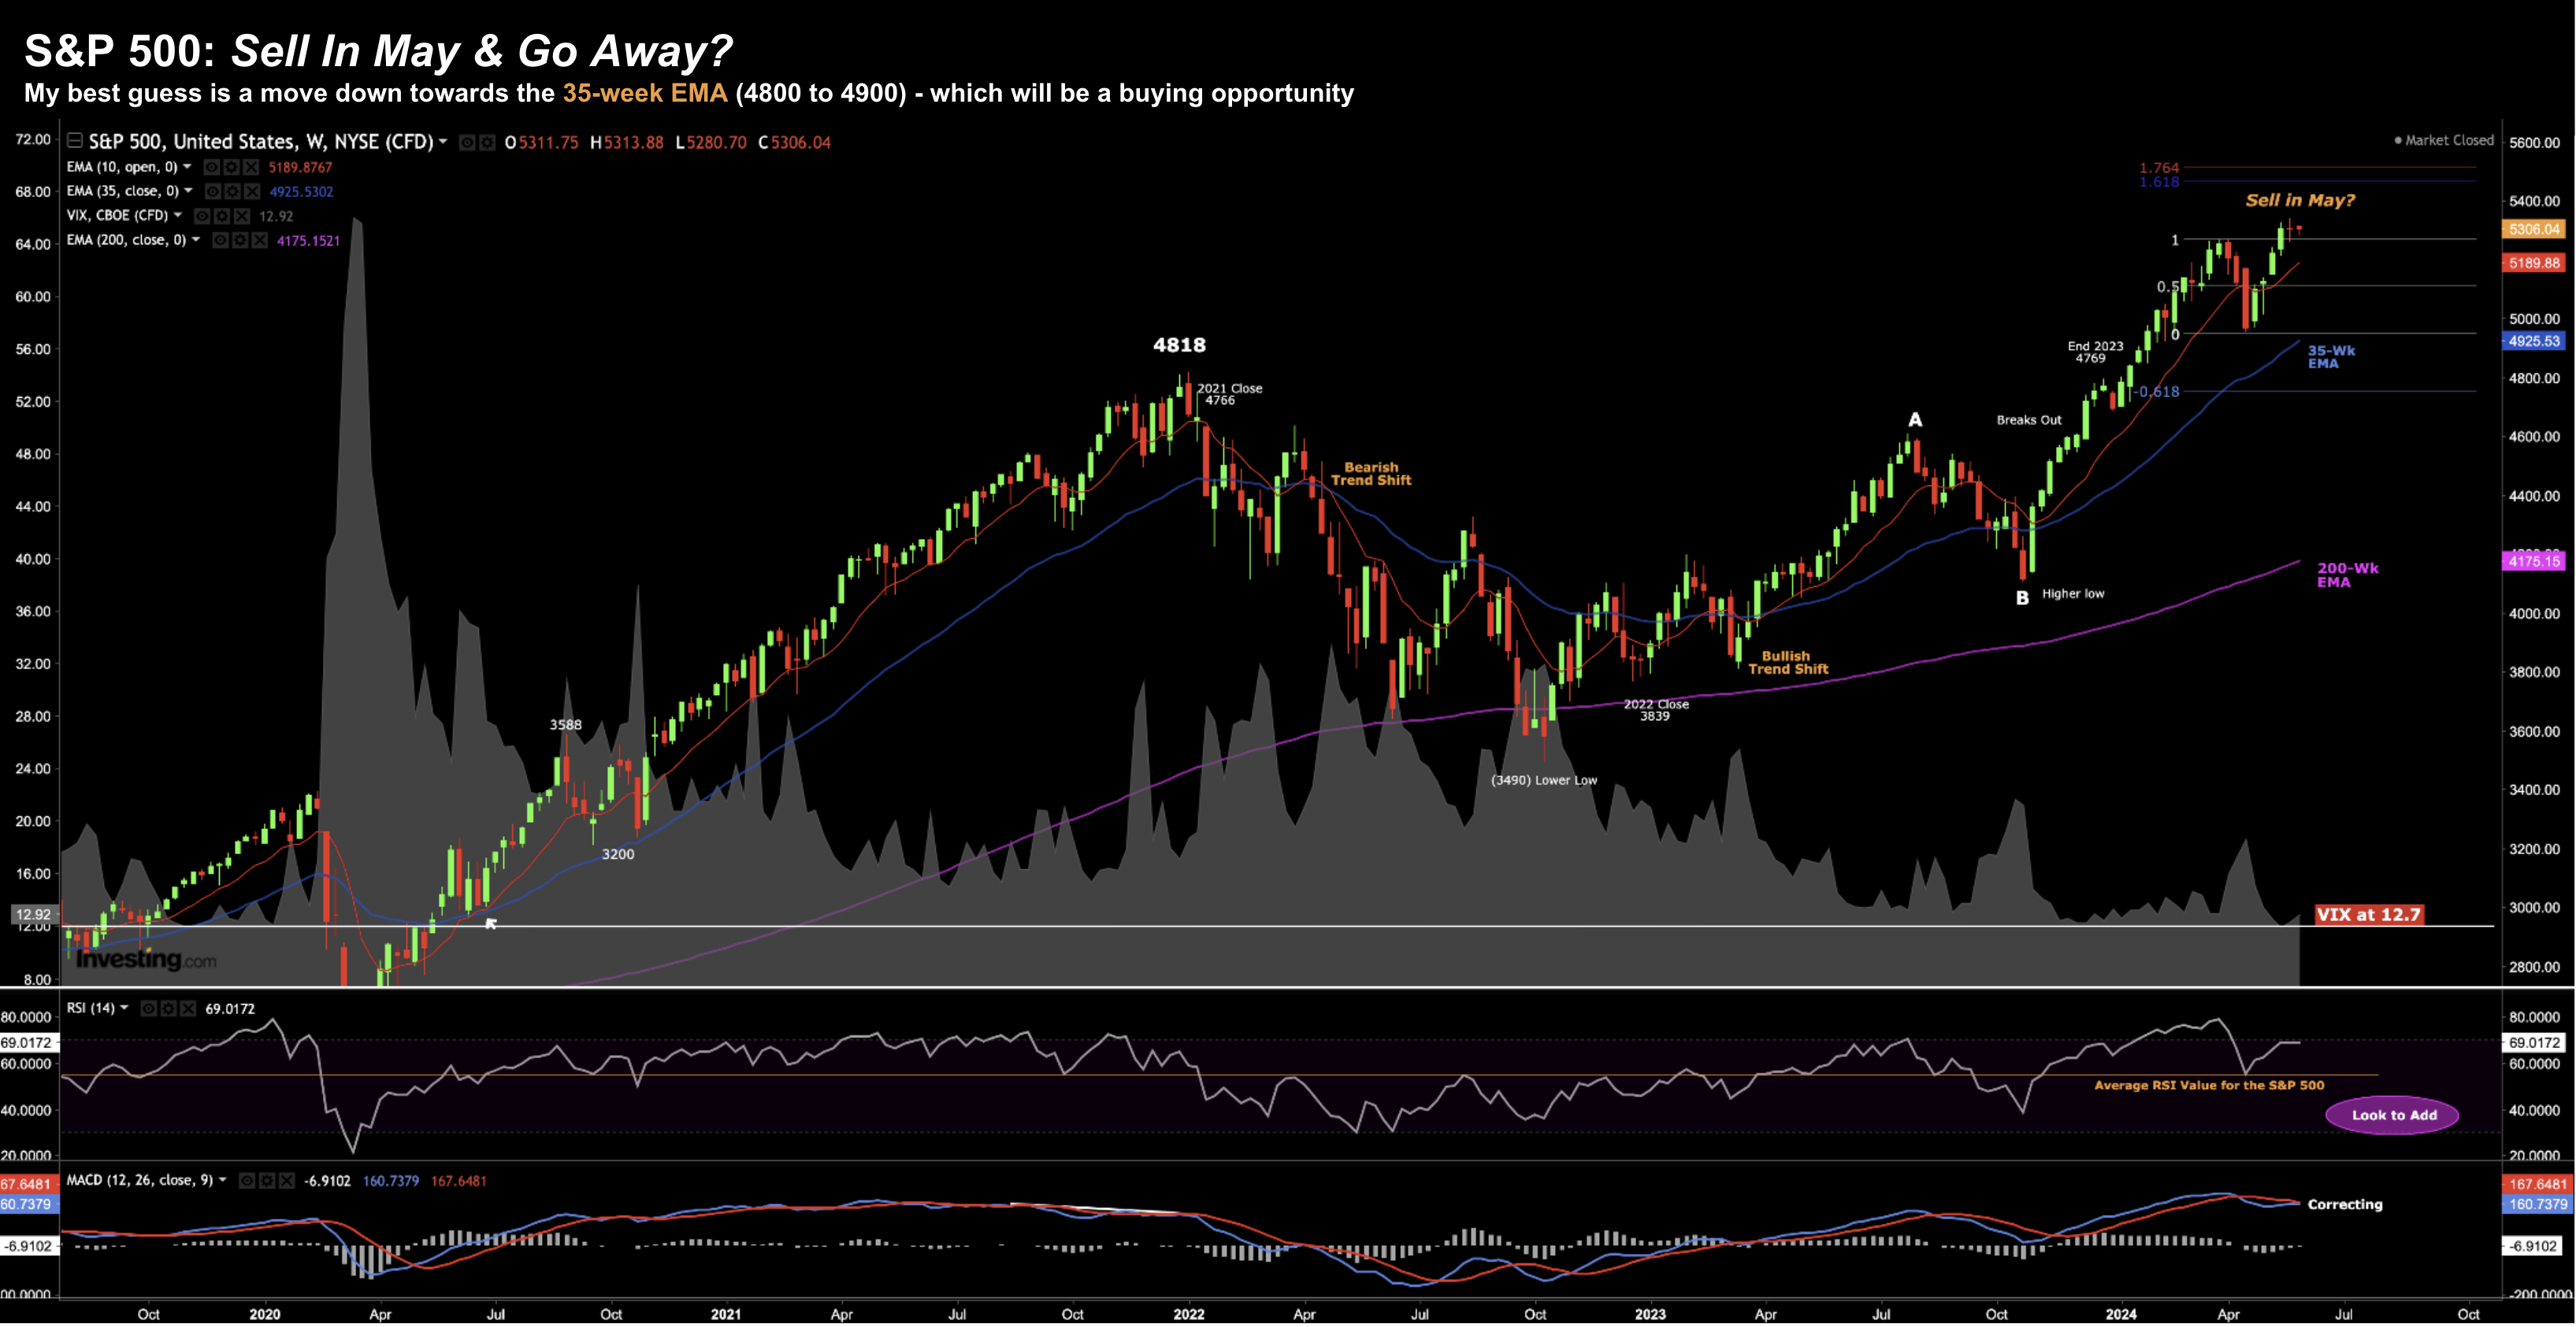
The Index is trading very close to all-time highs (above 5300) – as we see with the weekly chart:
May 28 2024
Since October last year – it’s been a surge for the ages.
What’s more, with the VIX trading ~12 – it suggests a level of complacency not seen since pre-pandemic.
Put another way, participants don’t expect much volatility in the near-term (which could be a lazy assumption)
But how representative is the Index of the broader market?
From mine, not very.
Consider market darling Nvidia (NVDA)
If we were to remove the leading AI-chip maker’s performance over the past two sessions – the market would be down considerably.
The stock comprises ~3% of the total market weight. Therefore, given its 10%+ rise post earnings last week – it saved the S&P 500.
Beyond that – most stocks have been heading lower.
Leading names like (and this is not exhaustive) J&J, AbbVie, Bristol Myers, McDonalds, Lululemon, Starbucks, Target, Intel, Cisco and Adobe have all been heading sharply lower.
In addition, the KRE Regional Banking ETF has shed 6% in two sessions.
If nothing else, it reinforces how narrow the market is.
That means it’s vulnerable.
But let’s come back to the term “euphoria”.
Have stocks got in front of their skis?
This week, I saw Citi’s Levkovich Indicator suggest things are approaching this level.
For those less familiar, this is a sentiment gauge developed by David Levkovich, a strategist at Citi.
His indicator tracks various factors like margin debt, short interest, and the put-to-call ratio to assess investor sentiment towards the stock market.
A “euphoria” reading on the Levkovich Indicator historically suggests that the market might be overheated and potentially due for a correction.
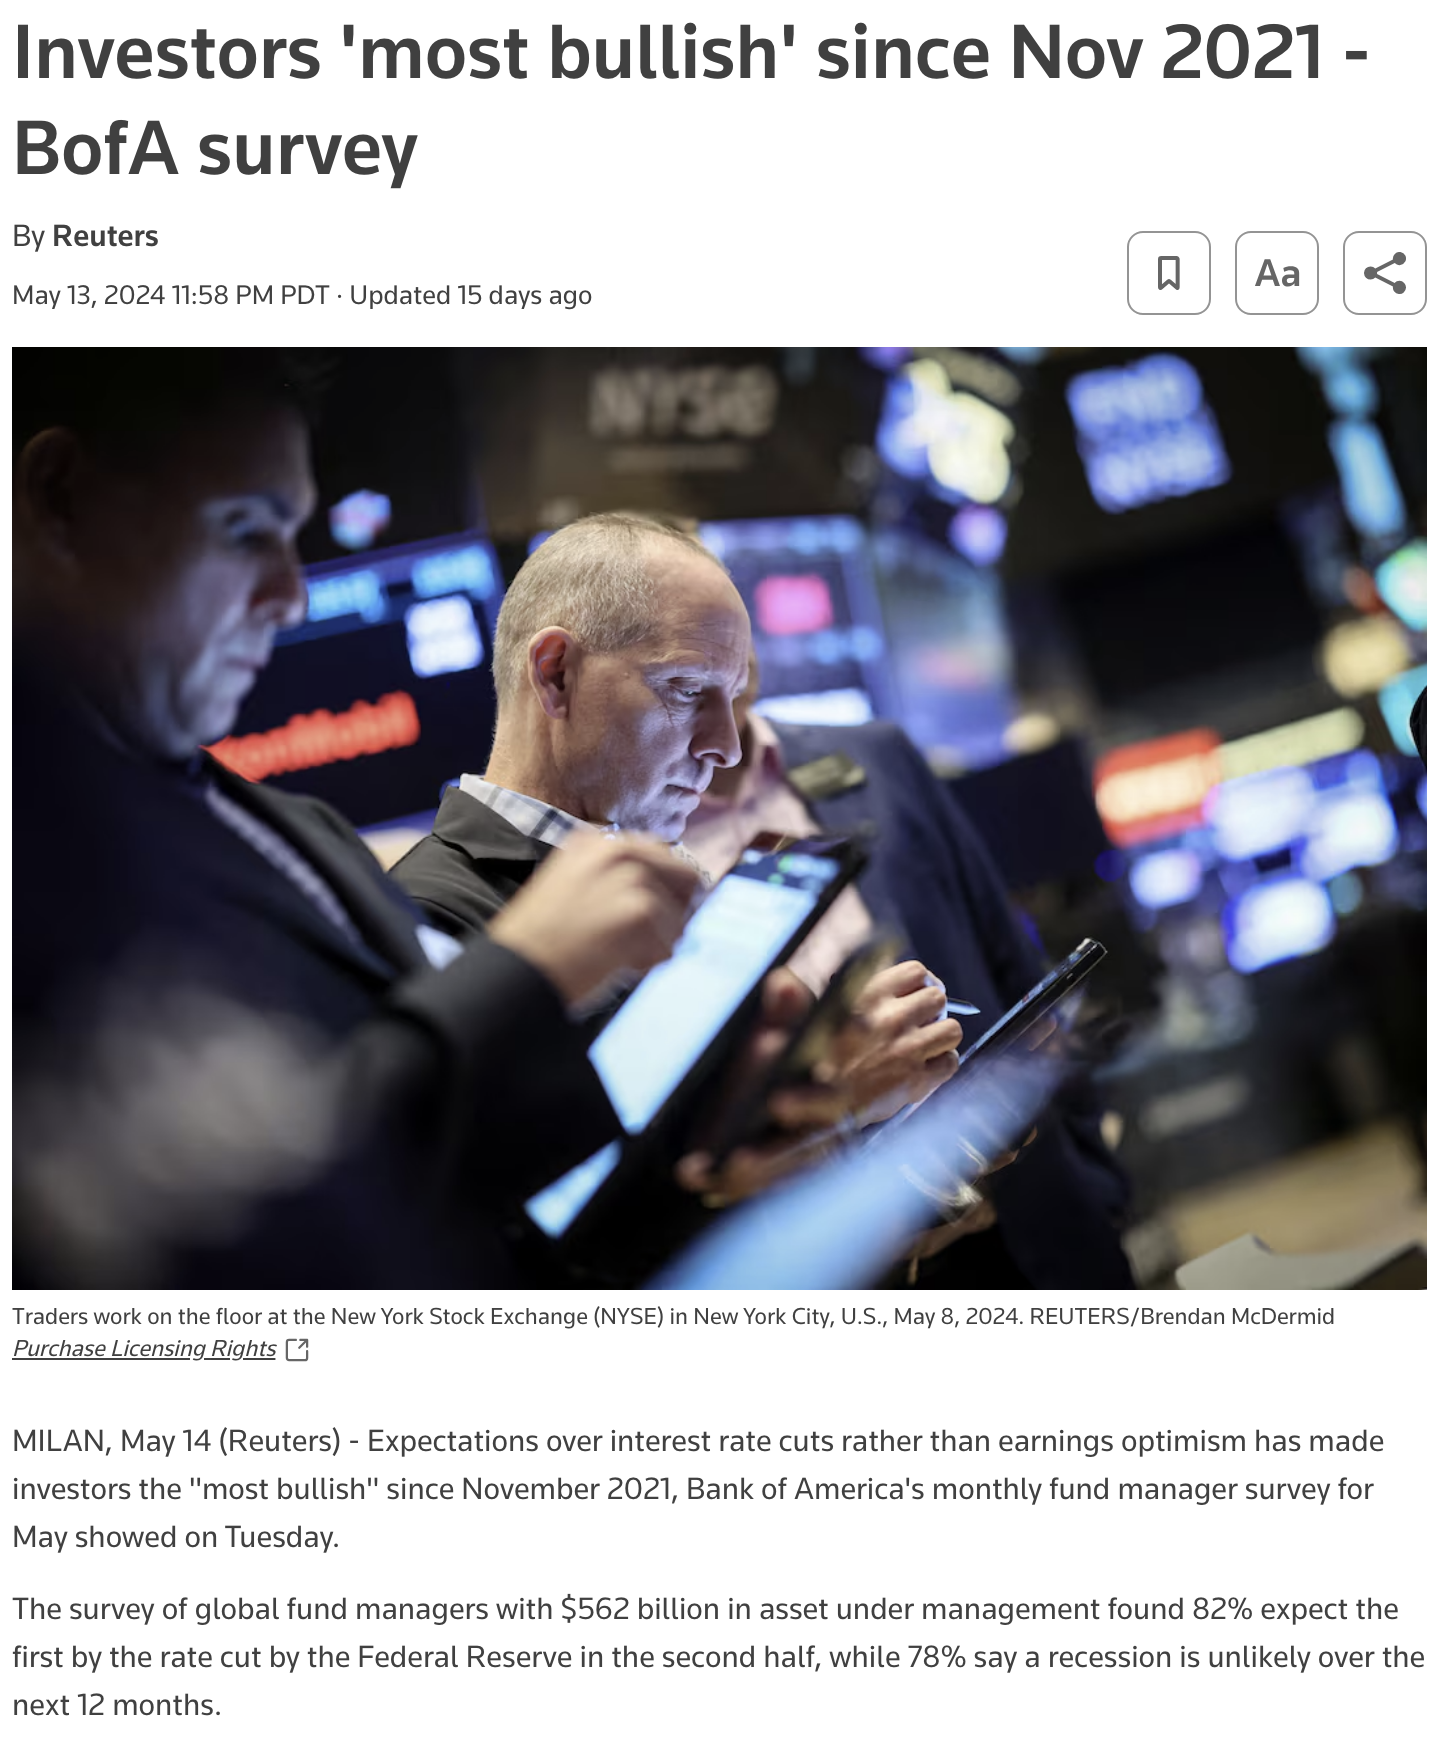
In addition to the Levkovich Indicator, Bank of America’s portfolio managers survey shows that institutional cash levels have fallen to a three-year low of 4% even as global growth expectations fell
From Reuters:
As the article states above – “78% of fund managers say a recession is unlikely over the next 12 months”
That’s optimism.
As for me, I’ve been taking half positions in some of the (sold) names mentioned above.
For example, names like (certainly not limited to) McDonalds, J&J, Starbucks, Bristol Myers, AbbVie and Intel are now starting to look more attractive (long-term) to me.
Now, could they shed “another 20%+” from here?
Of course!
And if they do – great news!
From there, assuming their respective businesses have not changed materially – I will make them full positions (vs the half-positions I’ve taken recently).
“Be greedy when others are fearful… be fearful when they are greedy”
It’s fair to say there might be a little bit of greed in a stock like NVDA (and others).
And equally, all kinds of fear with a stock like “McDonalds” and “Starbucks”.
Putting it All Together
Over the long weekend, I read a terrific book:
“The Great Depression: A Diary” – by Benjamin Roth.
Any serious long-term investor should read this.
As an aside, I think most people spend far too much time obsessing over the past “24 or 72 hours” (the news cycle) vs what we can learn from the past “5,000 years”.
Far more of our time should be spent studying the latter.
99.9% of the former is noise.
Filter it.
Now this book wasn’t on my list of 89 Books to Make You Smarter last year (as I had not discovered it) – but it will make this year’s list.
Roth – a lawyer from Youngstown, Ohio – a former steel working town – offers a firsthand account of the economic hardship experienced by ordinary Americans during the Great Depression.
But here’s the thing:
His diary was never meant to be published.
It was personal.
He saw it as his own (self-described) ‘post-graduate study’ – educating himself on things like the economy, investing, monetary policy, politics and the stock market.
The lessons he learned are equally applicable today.
Here’s one snippet:
“And so the stories run without end. It all comes to the same point. Every investor should at all times have a reasonable portion of his holdings in liquid securities that can’t shrink much.
In boom times everything should be sold and converted into government securities.
When prices of more speculative stocks and bonds and businesses have reached bottom – then is the time to buy again”
But one of the many lessons Roth would learn is picking the timing of the bottom can be very difficult (if not impossible).
He tells of various investing journey’s of professionals who made (and lost) money speculating.
Most made similar mistakes…. the same mistakes we see today.
And it makes sense – if people don’t learn from history – they are bound to repeat the same errors.
Outside the many investing lessons, he talks to the anxieties and struggles of everyday people grappling with job losses, financial insecurity, and a sense of uncertainty about the future. For example:
- The impact of the stock market crash on people’s lives post 1929;
- Investing through the Depression years (e.g., each year thinking it could not get worse – but it did);
- The rise of unemployment and its toll on his family and community;
- Excessive government intervention – resulting in more harm than good (despite good intent); and
- People’s anxieties about inflation, politics and war
From mine, the power of this book lies in its personal perspective.
It’s not written by some ‘Depression Historian‘ – this book was written in real-time (as it was unfolding).
It offers us a great historical record of what life (and business) was like through the 1930s and early 1940s.
Spend the US$14 (for the Kindle version) – it’s a terrific read – with many timeless lessons for asset speculators.


