The Intelligent Investor
Part 3: Embracing Market Cycles
Words: 1,149 Time: 6 Minutes
“Rule number one: most things will prove to be cyclical. Rule number two: some of the greatest opportunities for gain and loss come when other people forget rule number one.”
– Howard Marks
💥 Why This Matters
- Long-term trends: The intelligent investor will understand the long-term trends (and cycles) in stock prices, earnings, and dividends to gain insights into the relative attractiveness or risks of investing in stocks at any given time.
- Markets are cyclical: Markets will always oscillate between excessive optimism and pessimism for future market returns. It’s a process that repeats. This creates powerful opportunities for the patient investor who can act rationally and independently.
- Mean reversion: Everything always reverts to the mean over the long run; however prices spend very little time at the mean. They’re mostly between “not too bad” and “not terrible”.
🧑🎓 Learning from History
For me, Chapter 3 (along with Chapter 8 and 20) contain some of the most impactful lessons readers can take from this book.
If these three chapters are the only chapters you read (i.e., less than 30 minutes of your time) – you will enjoy a significant advantage over the average investor (assuming you take the time to put practice into work).
Graham starts this chapter by explaining that an investor’s portfolio of stocks provides only a small representation of the vast and complex entity known as the ‘stock market’.
Given this, it’s essential that the investor possess a reasonable understanding of the market’s history, particularly its significant fluctuations in price levels and the shifting relationships between stock prices, earnings, and dividends.
With such knowledge, the investor will be better equipped to make informed decisions about whether the market is at an attractive or dangerous level at any given time.

investor’s a meaningful advantage.
Expanding on this principle, billionaire investor (and Benjamin Graham student) – Howard Marks – published the masterful “Mastering The Market Cycle: Getting the Odds on Your Side” – which centers on this practice.
Marks believes the patient investor will enjoy a large advantage by assessing the present stage of the market cycle. His formula for (long-term) success is two-fold:
- Adequate and sustainable returns during bull markets; while
- Minimizing losses during bear markets
And whilst this sounds obvious to anyone reading this – it’s harder to do in practice. However, Graham’s book is a lesson on how this can be done through diligence.
🔄 A System of Pattern Recognition
To demonstrate market price fluctuations, Graham analyzes three distinct patterns over a 70-year market period.
And whilst the book doesn’t look at market cycles post 1970 – the same pattern repeats (as I will demonstrate)
That is, the pattern of human behavior (specifically the emotions of fear and greed) never change.
Below are the three phases Graham observed:
- Phase 1: 1900 to 1924, consists mainly of similar market cycles lasting three to five years, with an annual growth rate of ~3%.
- Phase 2: 1924 to 1949, includes the “New Era” bull market of the late 1920s, culminating in the devastating crash of 1929. During this period, irregular market fluctuations occurred, and the annual growth rate from 1924 to 1949 was only 1.5%, leaving the public with little enthusiasm for stocks.
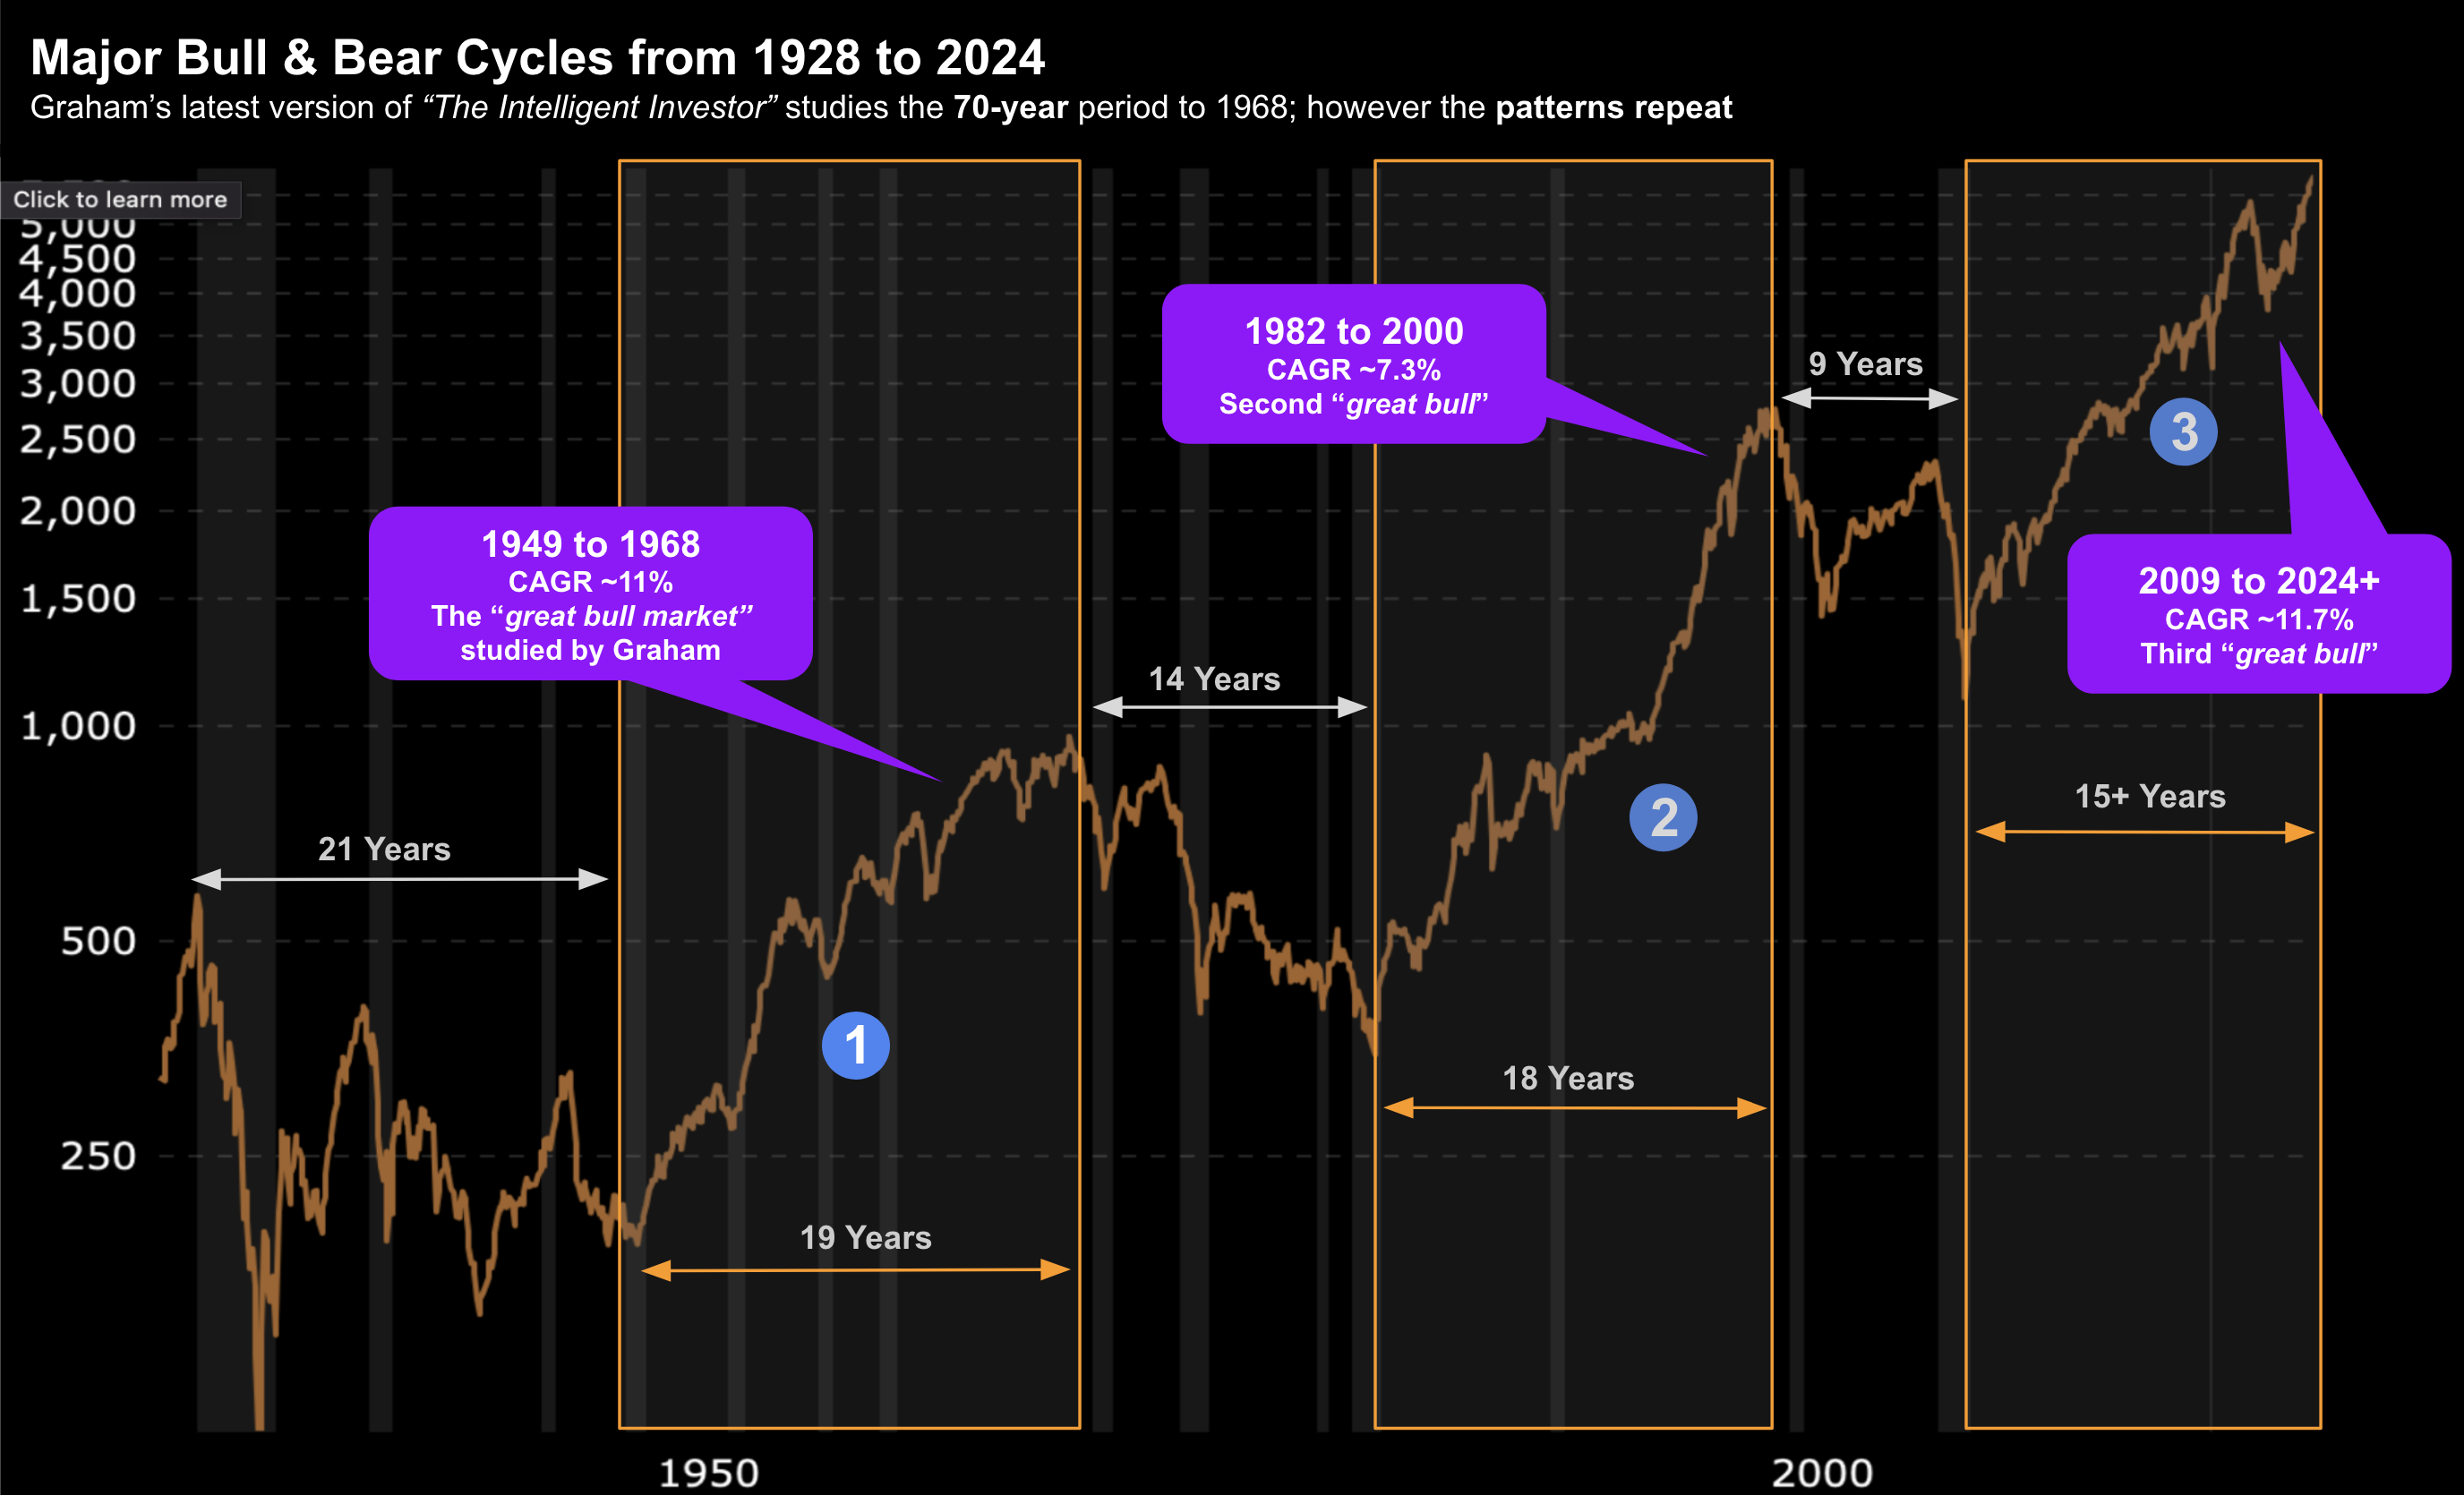
- Phase 3: The greatest bull market in history (at the time) began in 1949. Despite significant setbacks in 1956-57 and 1961-62, the market quickly recovered, leading experts to view these dips as mere recessions within a single prolonged bull market, rather than separate cycles. Between the DJIA’s low of 162 in mid-1949 and its high of 995 in early 1966, the market saw a sixfold increase over 17 years, averaging an 11% annual growth rate, excluding dividends. However, this optimism led to the dangerous belief that such extraordinary gains would continue indefinitely.
As mentioned, we’ve seen these cycles repeat twice since 1970 – where the current bull from 2009 rivals the ~11% CAGR achieved between 1948 and 1968:

One of the more salient observations Graham highlights was the shift in price-to-earnings (P/E) ratios since World War II:
- In 1949, the S&P composite index sold at just 6.3x the earnings of the prior 12 months. By 1961, this ratio had climbed to 22.9x earnings.
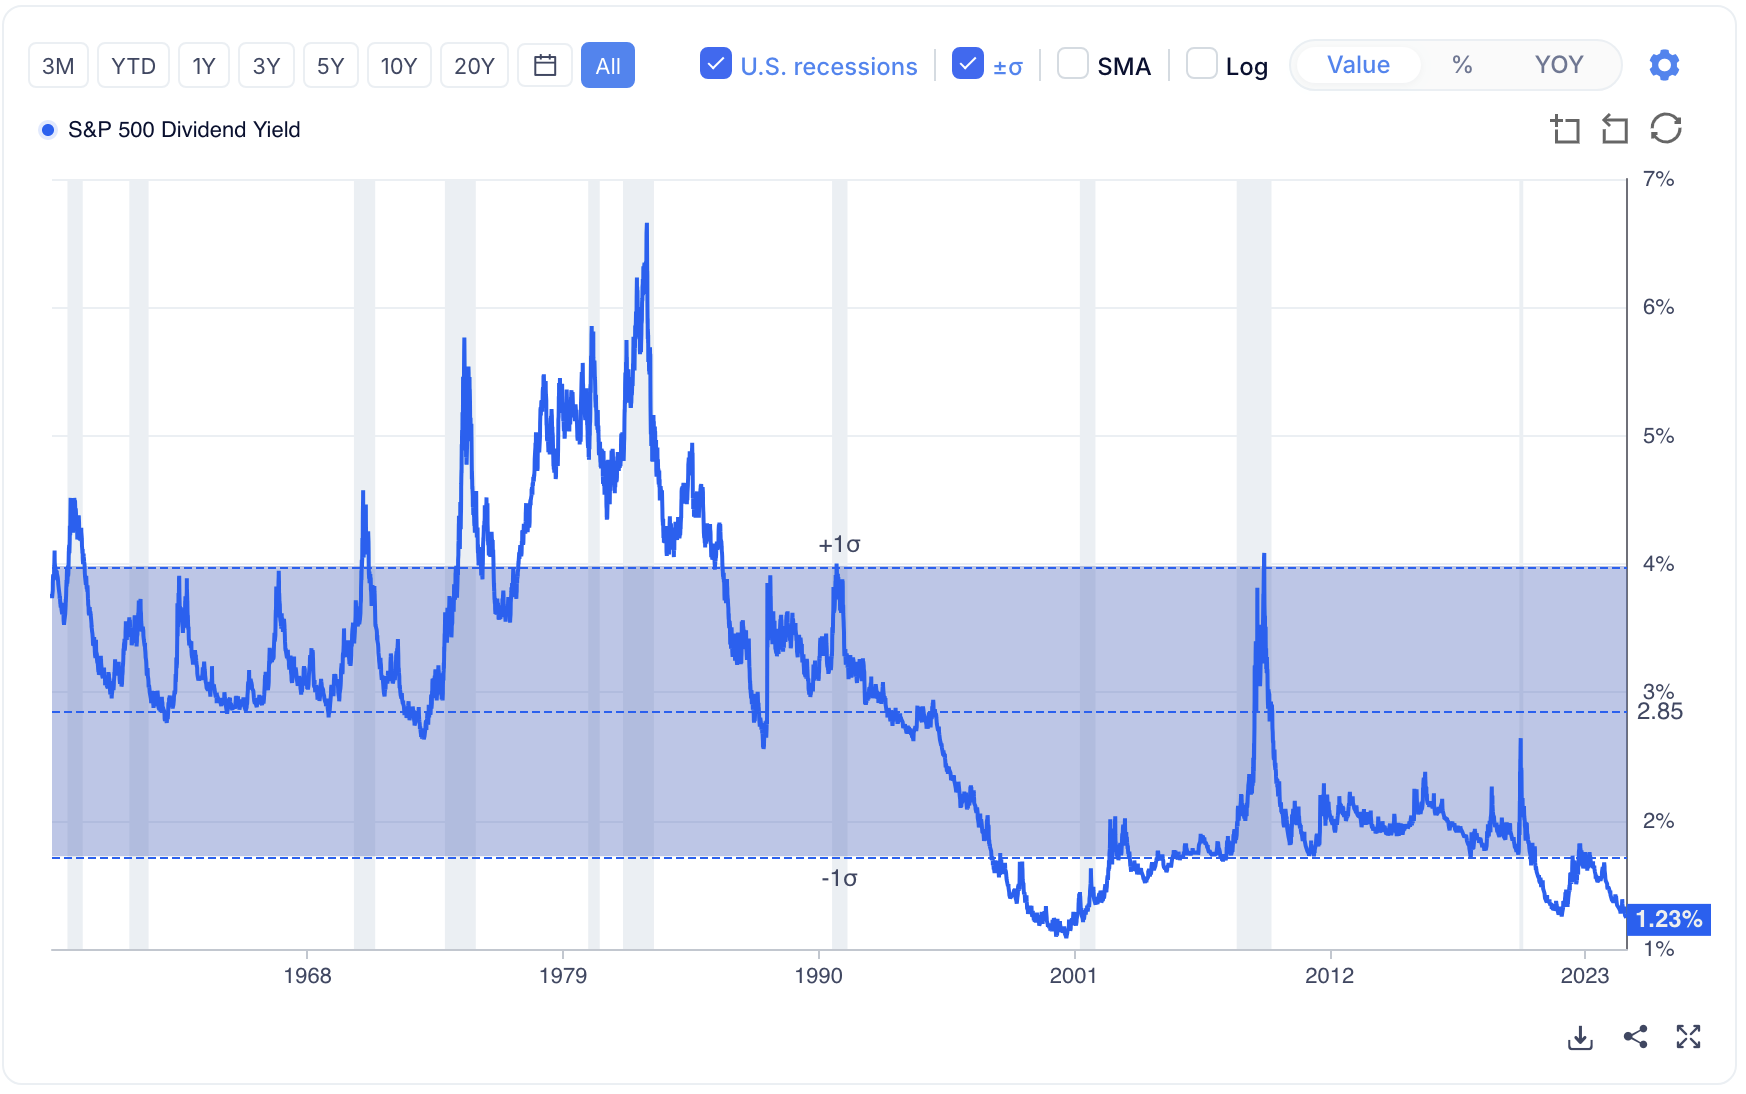
- Similarly, the dividend yield on the S&P index fell from over 7% in 1949 to only 3% by 1961.
- This shift occurred even as interest rates on high-grade bonds increased from 2.60% to 4.50%
For seasoned investors, the dramatic rise in P/E ratios (with lower yields) on stocks signaled potential trouble ahead, reminiscent of the 1926-1929 bull market and its subsequent collapse.
However, these fears were not fully realized, as the market did not experience a crash comparable to that of 1929-1932 (where the market lost ~90% of its value)
It was not until 1969 the market experienced a major downturn – which lasted for a period of 14 years – losing ~62% over this period.
Irrespective, the mistakes investors made in the lead up to the crash of 1929 were repeated in the lead up to 1969. We saw something similar in the dot.com bust of 2000 (and the global financial crisis of 2008).
Fast forward to October 2024 – the S&P 500 trades at a forward PE of 22x; with a dividend yield of 1.23% (as low as anytime in history)

Based on this (and the lessons offered by Graham) — are some investors destined to repeat the same mistakes as 1929, 1968, 2000 and 2008? My guess is probably.
📐 Howard Marks’ Market Cycle
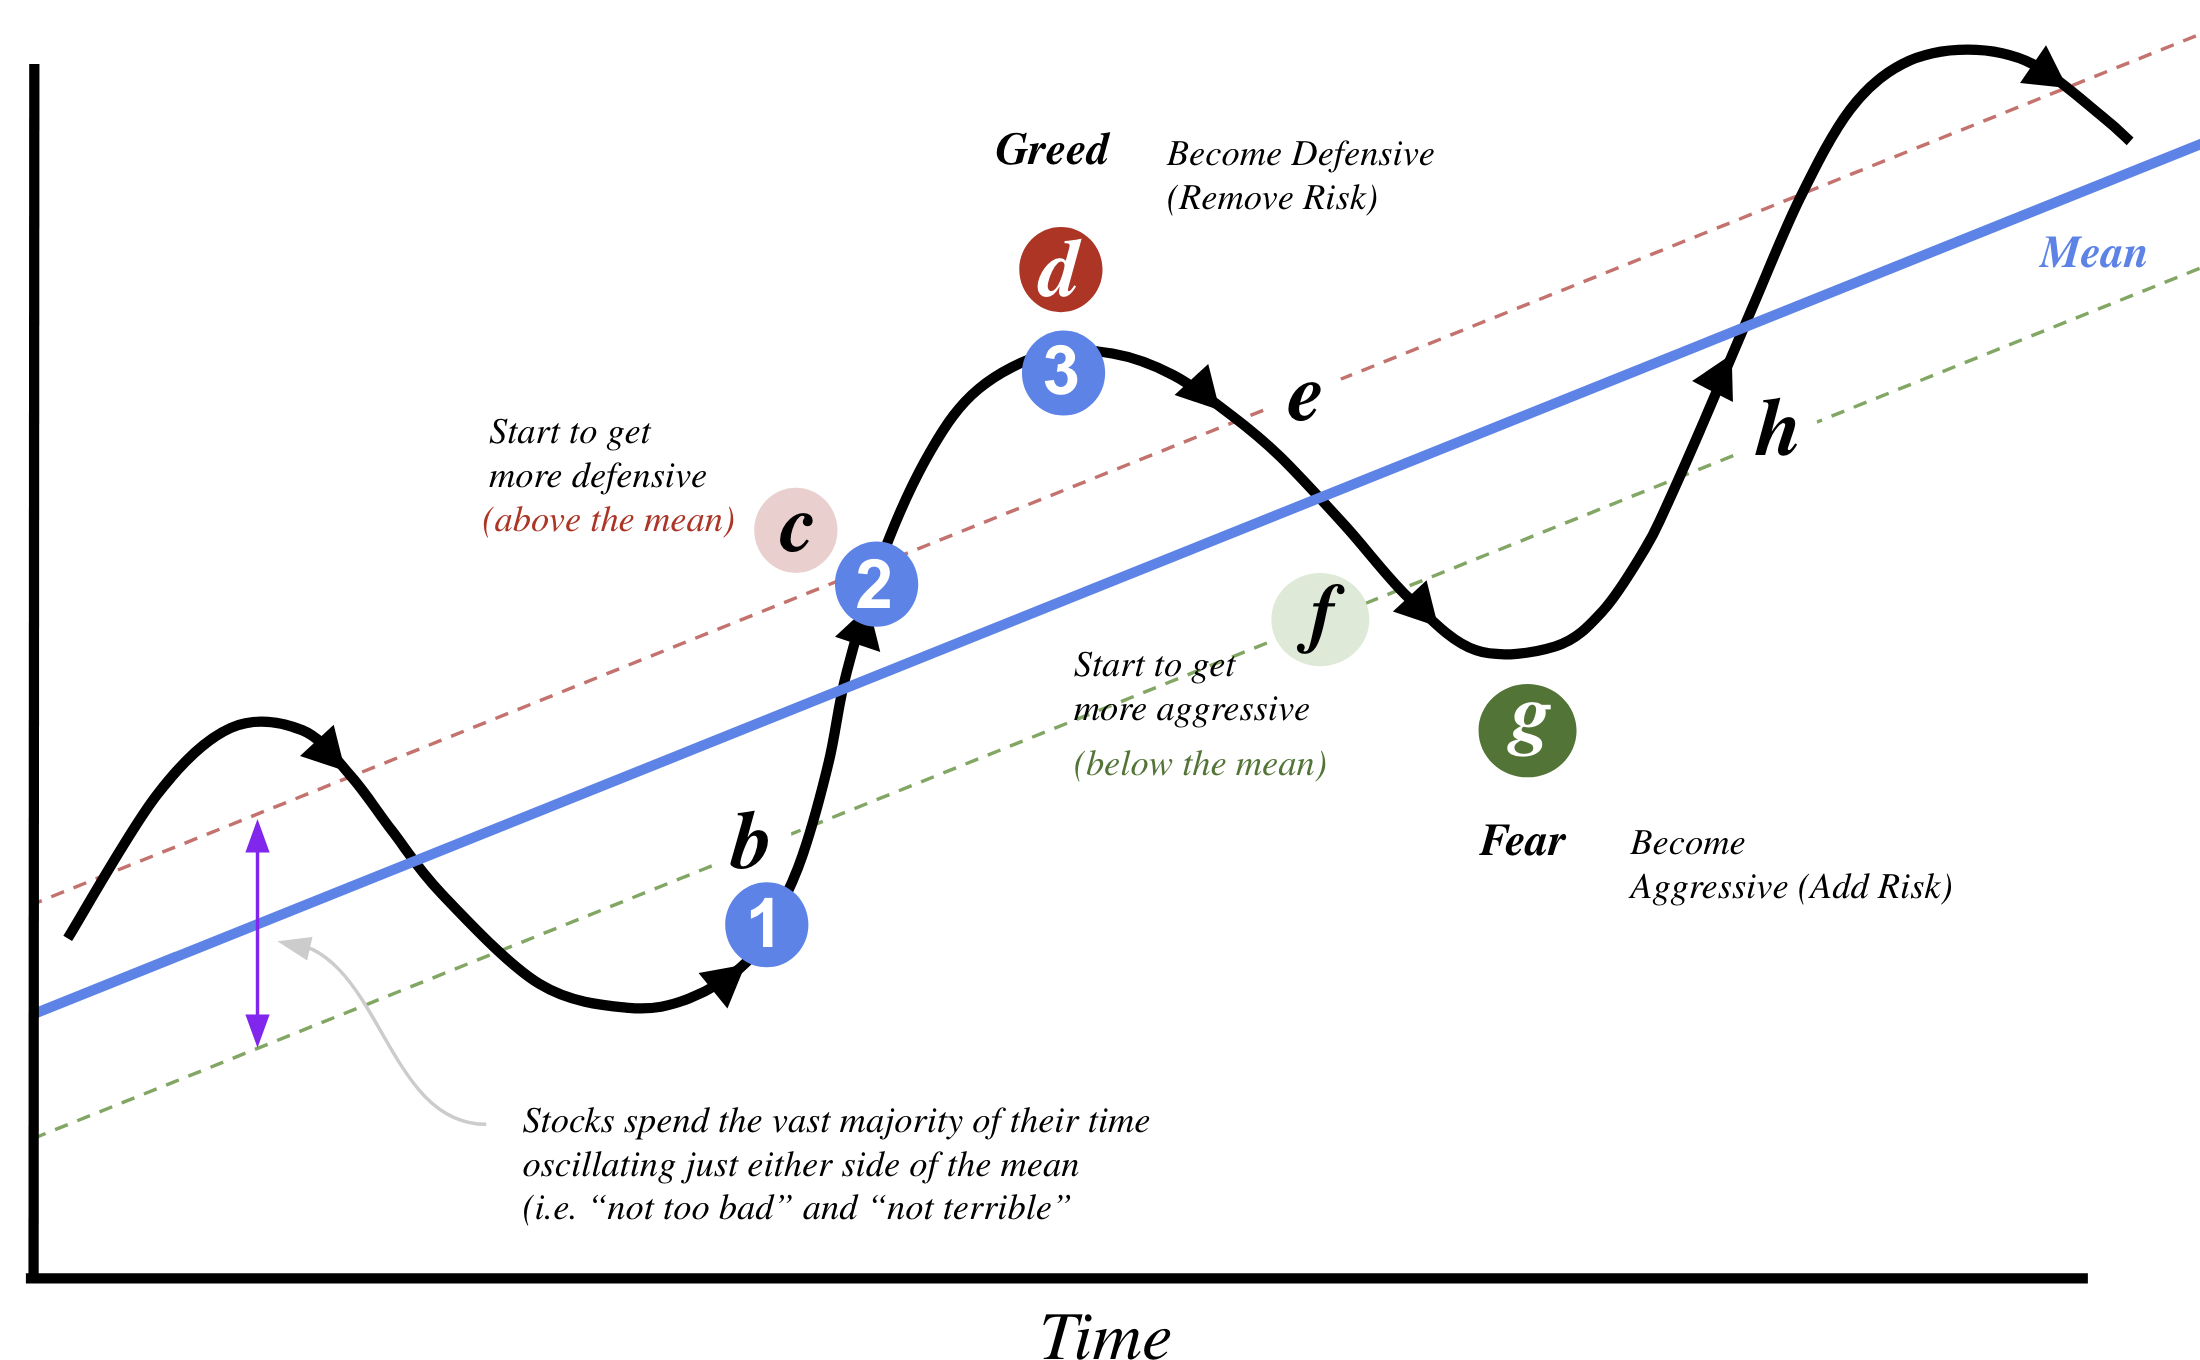
Whilst not part of “The Intelligent Investor” – Howard Marks’ market cycle model articulates the points Graham makes in his text.

I’ve annotated Marks’ diagram with my own commentary (e.g. “start to get more aggressive” etc) for clarity.
What’s important here is two-fold; i.e., knowing when to:
(a) becoming more defensive (investors are overly optimistic); and
(b) becoming more aggressive (investors are overly fearful).
The other observation is markets spend the vast majority of the time oscillating between either side of the long-term mean (or average).
This can be described as either “not too bad” or “not terrible“.

 3 Key Takeaways
- History may not repeat but it often rhymes. Graham cautions against predicting future market returns based solely on past performance. Consider the late 1990s – where pundits predicted endlessly rising stock markets by ignoring historical risks and assuming past trends would continue indefinitely (I made that mistake). The result was the disastrous crash; repeating again in 2008.
- Human behavior doesn’t change: Emotions such as fear and greed will continue to drive excessive optimism and widespread fear in the market. Investors should reduce risk into excessive optimism; and look for long-term buying opportunities during times of extreme panic.
- Lower expectations and remain humble: The only certainty in investing is that the future will surprise us, often catching overconfident investors off-guard. He advises lowering return expectations and remaining humble, as markets tend to punish those who are most certain of their predictions.
“You’ve got to be careful if you don’t know where you’re going, ’cause you might not get there” – Yogi Berra
