Words: 1,735 Time: 7 Minutes
- Rethinking Asset Allocation as the Landscape for Risks Shifts
- Beyond the 60/40 Mindset
- Two Fundamental Building Blocks: Ownership and Debt
Sometimes I wonder if the ‘cyber ears’ are listening?
One day after I shared my thoughts on how investors should prepare their defense against excessive stock valuations – Howard Marks – shared his latest thoughts on asset allocation.
If you don’t subscribe to Marks’ free newsletter – it’s a must. It’s one of the rare newsletters I can’t wait to open when it hits my inbox.
I always learn something…
His post was the ideal follow-up to my recent post… where I talked about finding the right balance between risk and reward.
Marks’ latest missive reminds us that the investment landscape has undergone a dramatic transformation in recent decades.
He argues the widely followed “60/40” (or 50/50 as recommended by Benjamin Graham) may not suffice given the bewildering array of asset classes and strategies that face investors.
For example, they are said to include (not limited to) domestic and international equities to various alternative investments and private assets.
This complexity demands two things:
- a clear and adaptable framework for asset allocation; along with
- a process of deciding how to distribute investments across different asset classes.
From there, this enables the investor to develop a portfolio that aligns with their own individual risk tolerance and return objectives.
In the words of Benjamin Graham, portfolio returns which are both adequate and sustainable.
⚖️ Beyond the 60/40
For those less familiar with the 60/40 portfolio – here’s a quick summary:
The portfolio implies 60% to a broad range of stocks — typically index funds or ETFs — and 40% to bonds (typically 10-year treasury bonds or other mainstream investment-grade bonds).
The 60/40 portfolio strategy has yielded stable returns during most periods in U.S. financial history (go deeper with Morgan Stanley)
And up until 2020, recent performance has been particularly strong.
For example, in the decade before the COVID-19 crisis, a U.S. based 60/40 portfolio delivered three-times its long-run average for risk-adjusted returns.
However, for 2022 returns were terrible for the 60/40.
Stocks and bonds suffered large drawdowns (as the Fed hiked rates ~500 basis points) – which saw it lose around 17.5%
In 2023, the 60/40 portfolio bounced back to gain 17.2%
However, Marks now believes this construct may no longer be sufficient in today’s environment.
He says the proliferation of asset classes and investment strategies demands a more nuanced approach to portfolio construction.
🔀 Two Fundamental Asset Classes
At the core of any portfolio are ownership (equities) and debt (fixed income):
- Equity ownership is riskier and more volatile – but offers greater returns.
- Debt is less risky – however yields lower returns.
At its core, investing involves a fundamental choice between two asset classes: ownership and debt.
Ownership assets, such as stocks, real estate, and private equity, represent a stake in a business or asset, with the potential for both gains and losses.
On the other hand, debt assets involve lending money with a contractual expectation of periodic interest payments and principal repayment.
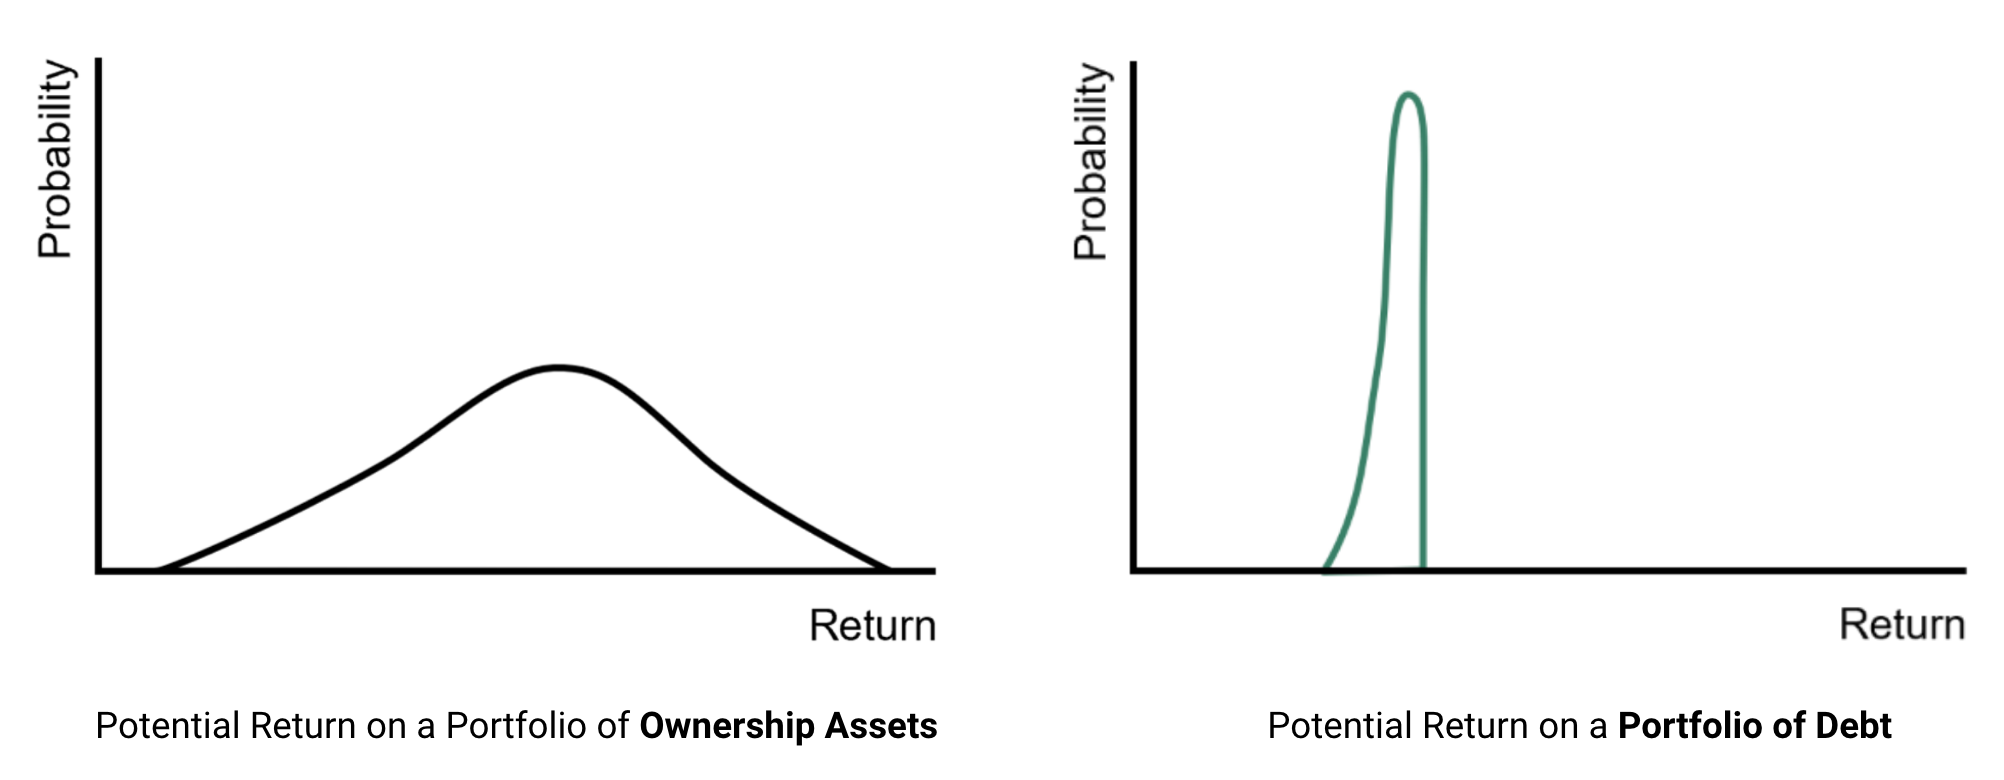
Marks demonstrates the risk / reward profile for each with these probability curves:
As Marks explains:
“Ownership assets typically have a higher expected return, greater upside potential, and greater downside risk.
Everything else being equal, the expected returns from debt are lower but likely to fall within a much tighter range”
The intelligent investor owns a combination of both.
🔧 Defining Your Risk Posture
Further to my post yesterday, the most important decision with asset allocation is determining your desired risk posture.
That is, striking the right balance between offense (growth) and defense (capital preservation).
Here’s an analogy:
Think of great sports teams who win the big games…
Not only do they play get offense – they also win with exceptionally strong defense.
It’s the same for military victories.
Wars are won with great defense – not simply offense alone.
From mine, too many investors make the mistake of skewing too far towards offense.
And this mistake is more common when you have wildly bullish markets (as many investors fall prey to herd-like behavior and emotions such as greed)
For example, I mentioned Benjamin Graham’s story about Yale University – who abandoned its fixed allocation strategy in the late 1960s in favor of a more equity-focused portfolio (taking on more risk for greater returns) – as equities surged.
However, they did this at precisely the wrong time.
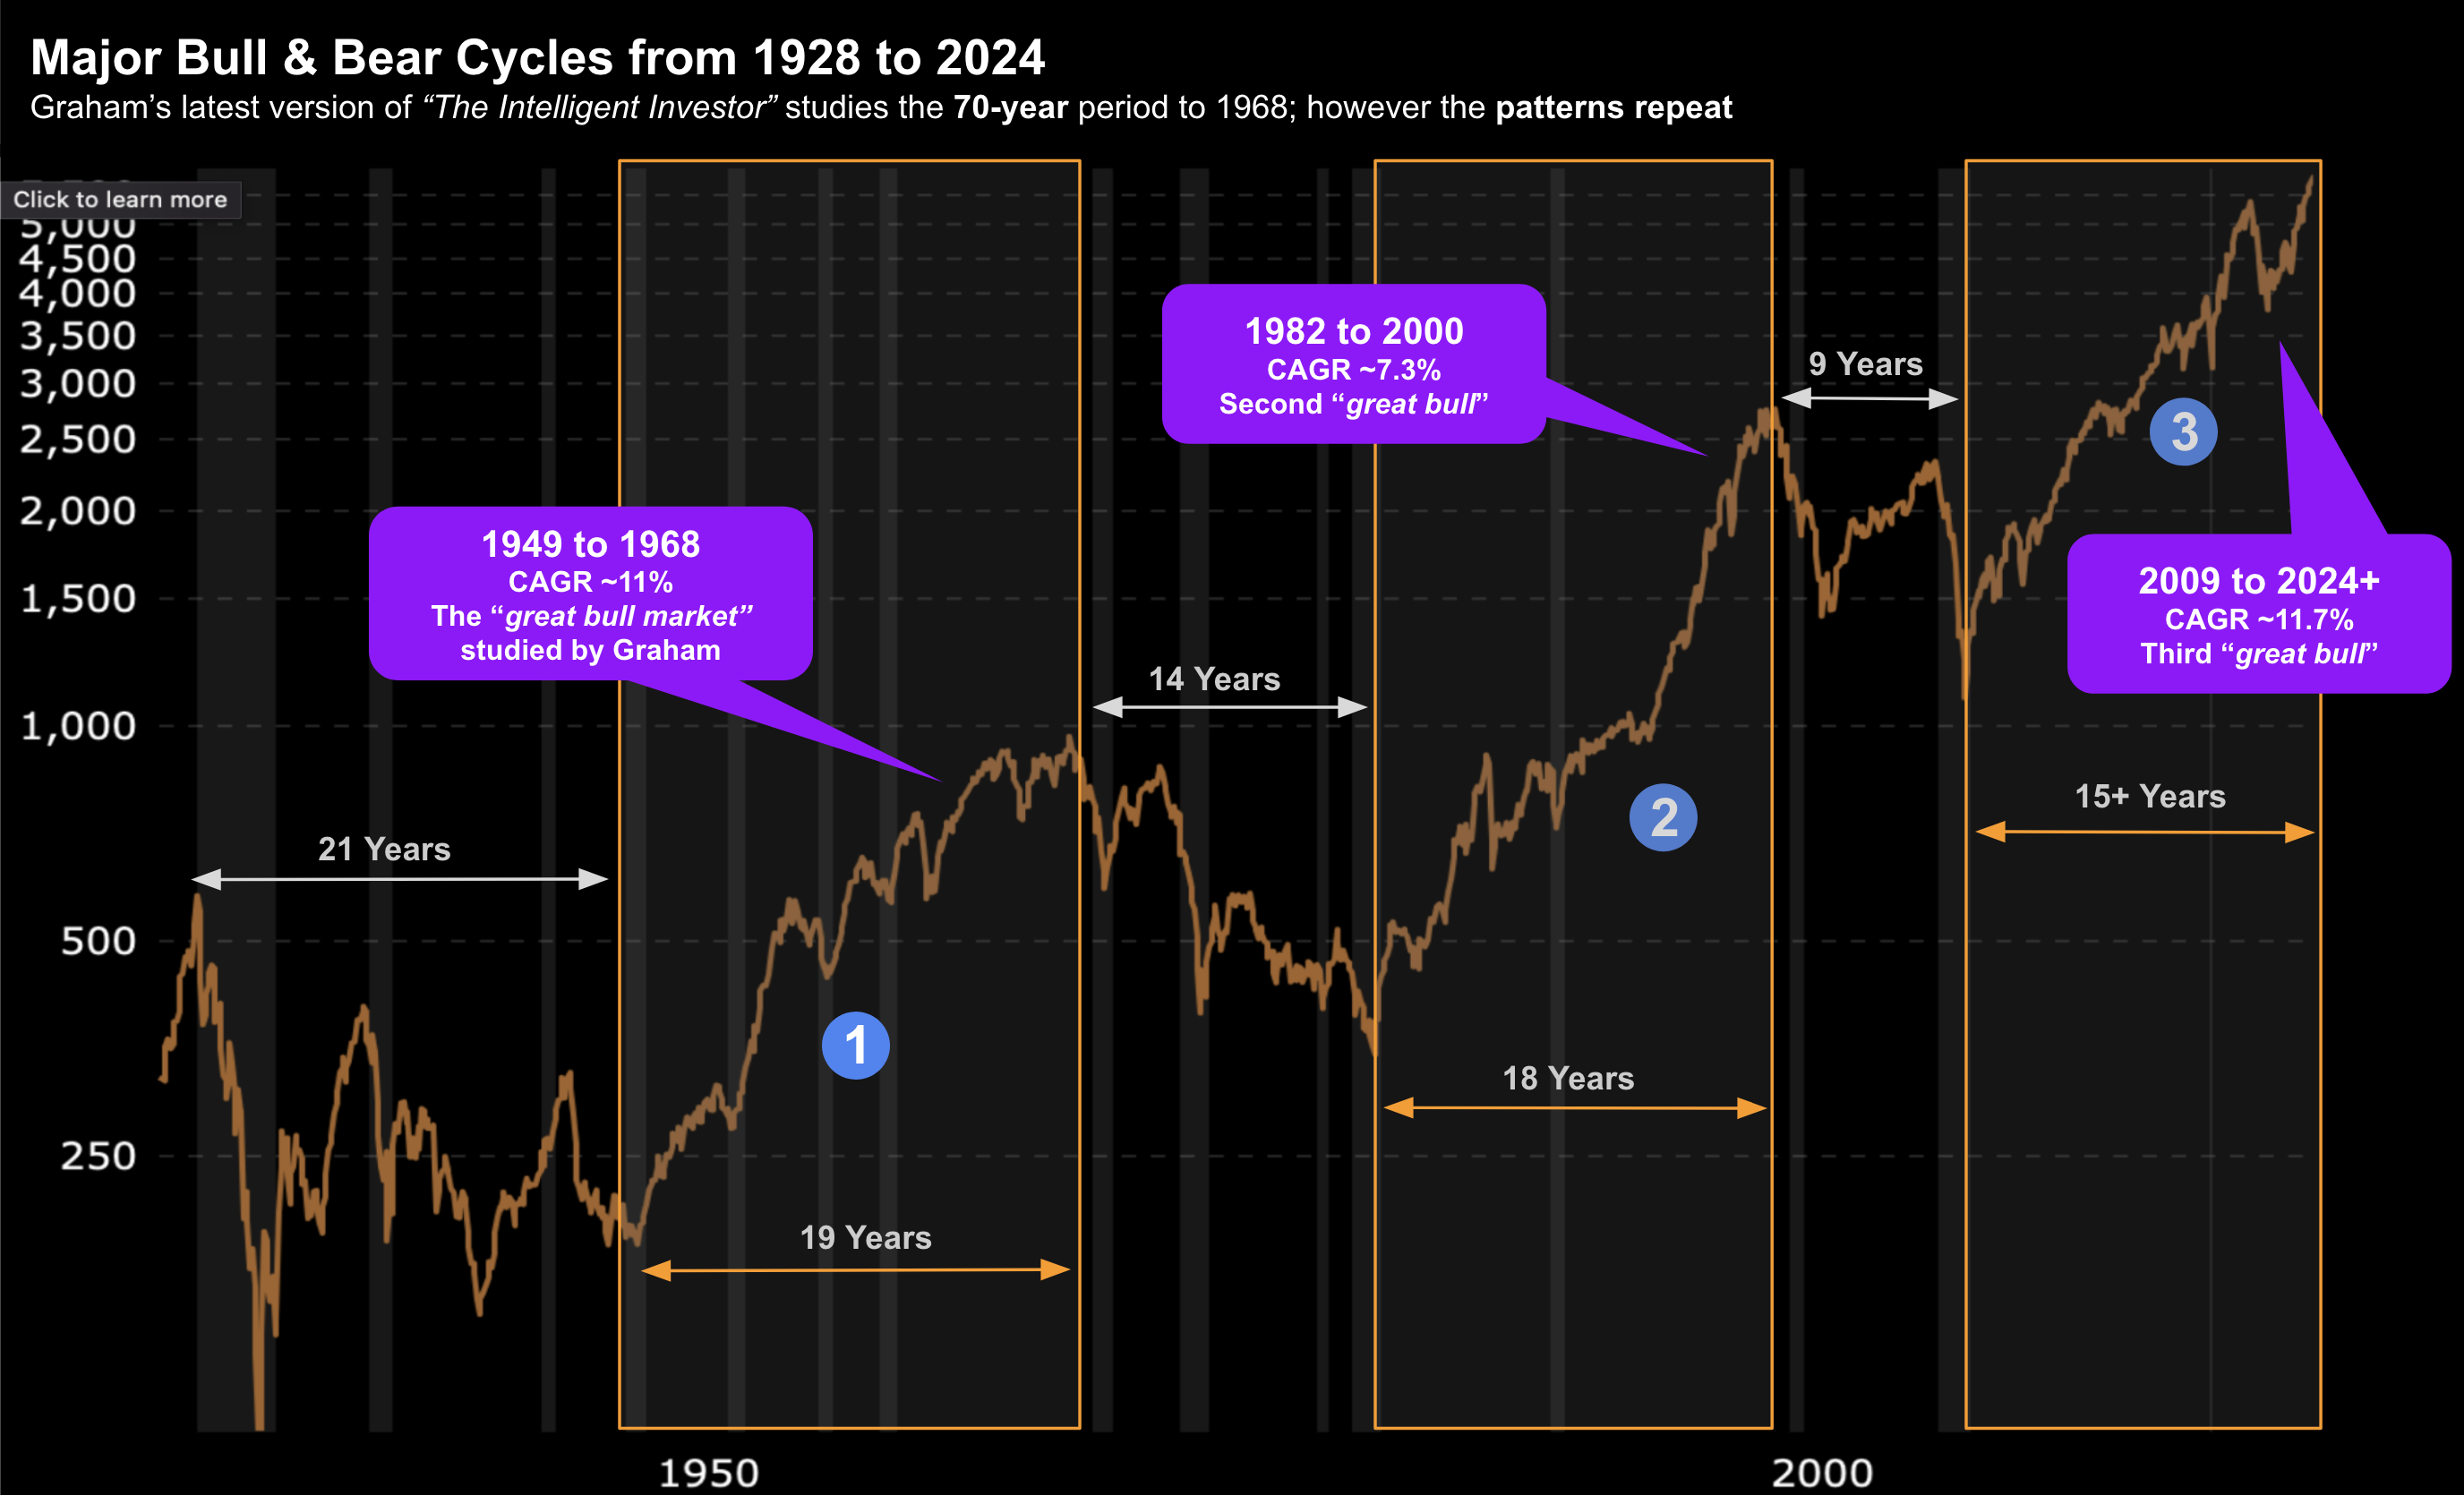
As my 100-year chart shows below, the 1970’s proved to be a “lost decade” for owenership assets (i.e., stock returns) — where valuations had run too far in the late 60s.
As Marks reminds us – this decision should be guided by factors such as your investment horizon, financial circumstances, and individual risk tolerance.
Once you’ve established your risk posture, the remaining asset allocation decisions become a matter of implementation, selecting specific asset classes and strategies to achieve your desired risk/return profile.
👩🏻💻 Risk/Return: The Trade-offs
Marks explains the relationship between risk and return is often depicted as a linear progression, with higher risk leading to higher expected returns.
However, this simplistic view fails to capture the true nature of risk.
It’s far from a straight line – but rather a probability distribution curve (otherwise known as a bell curve)
A more accurate representation acknowledges the increasing uncertainty and potential for losses associated with higher-risk investments.
As you move further out on the risk spectrum, the range of potential outcomes widens, and the downside risk becomes more pronounced.
He offers this diagram – where the black curve denotes 100% ownership assets (e.g., such as stocks)
By contrast, the green curve resembles that of debt (or fixed income)
Here’s Marks on his chart:
“I took the black (e.g. stock ownership) and green curves (e.g., debt or fixed income) describing ownership asset returns and debt returns and added some intermediate positions in blue and red to indicate various combinations of the two.
Thus, the blue curve is 2/3 debt and 1/3 ownership, and the red is 1/3 debt and 2/3 ownership.
As we move from left to right (more ownership assets, less debt), the expected return increases and the expected risk increases”
What’s critical is you understand your risk profile in terms of how your own portfolio is structured.
For example, what percentage of your portfolio is ownership vs debt?
If your entire investment portfolio consists of only property or stocks – then you are 100% invested in owernship assets (i.e., far higher risk)
Note: don’t confuse defensive equities as “defense”… they’re still ownership based assets.
𝛂 Market Efficiency and the Role of Alpha
The efficient market hypothesis suggests that all assets are fairly priced relative to their risk.
It also theorizes that there is no opportunity to consistently outperform the market through superior skill or knowledge (alpha).
However, that is deeply flawed.
In reality, markets are far from perfectly efficient.
If they were efficient – we would not experience repeated boom and bust cycles.
Markets are often mis-priced (largely due to self-defeating behaviors of investors).
This creates opportunities for patient and skilled investors to identify undervalued assets and generate alpha.
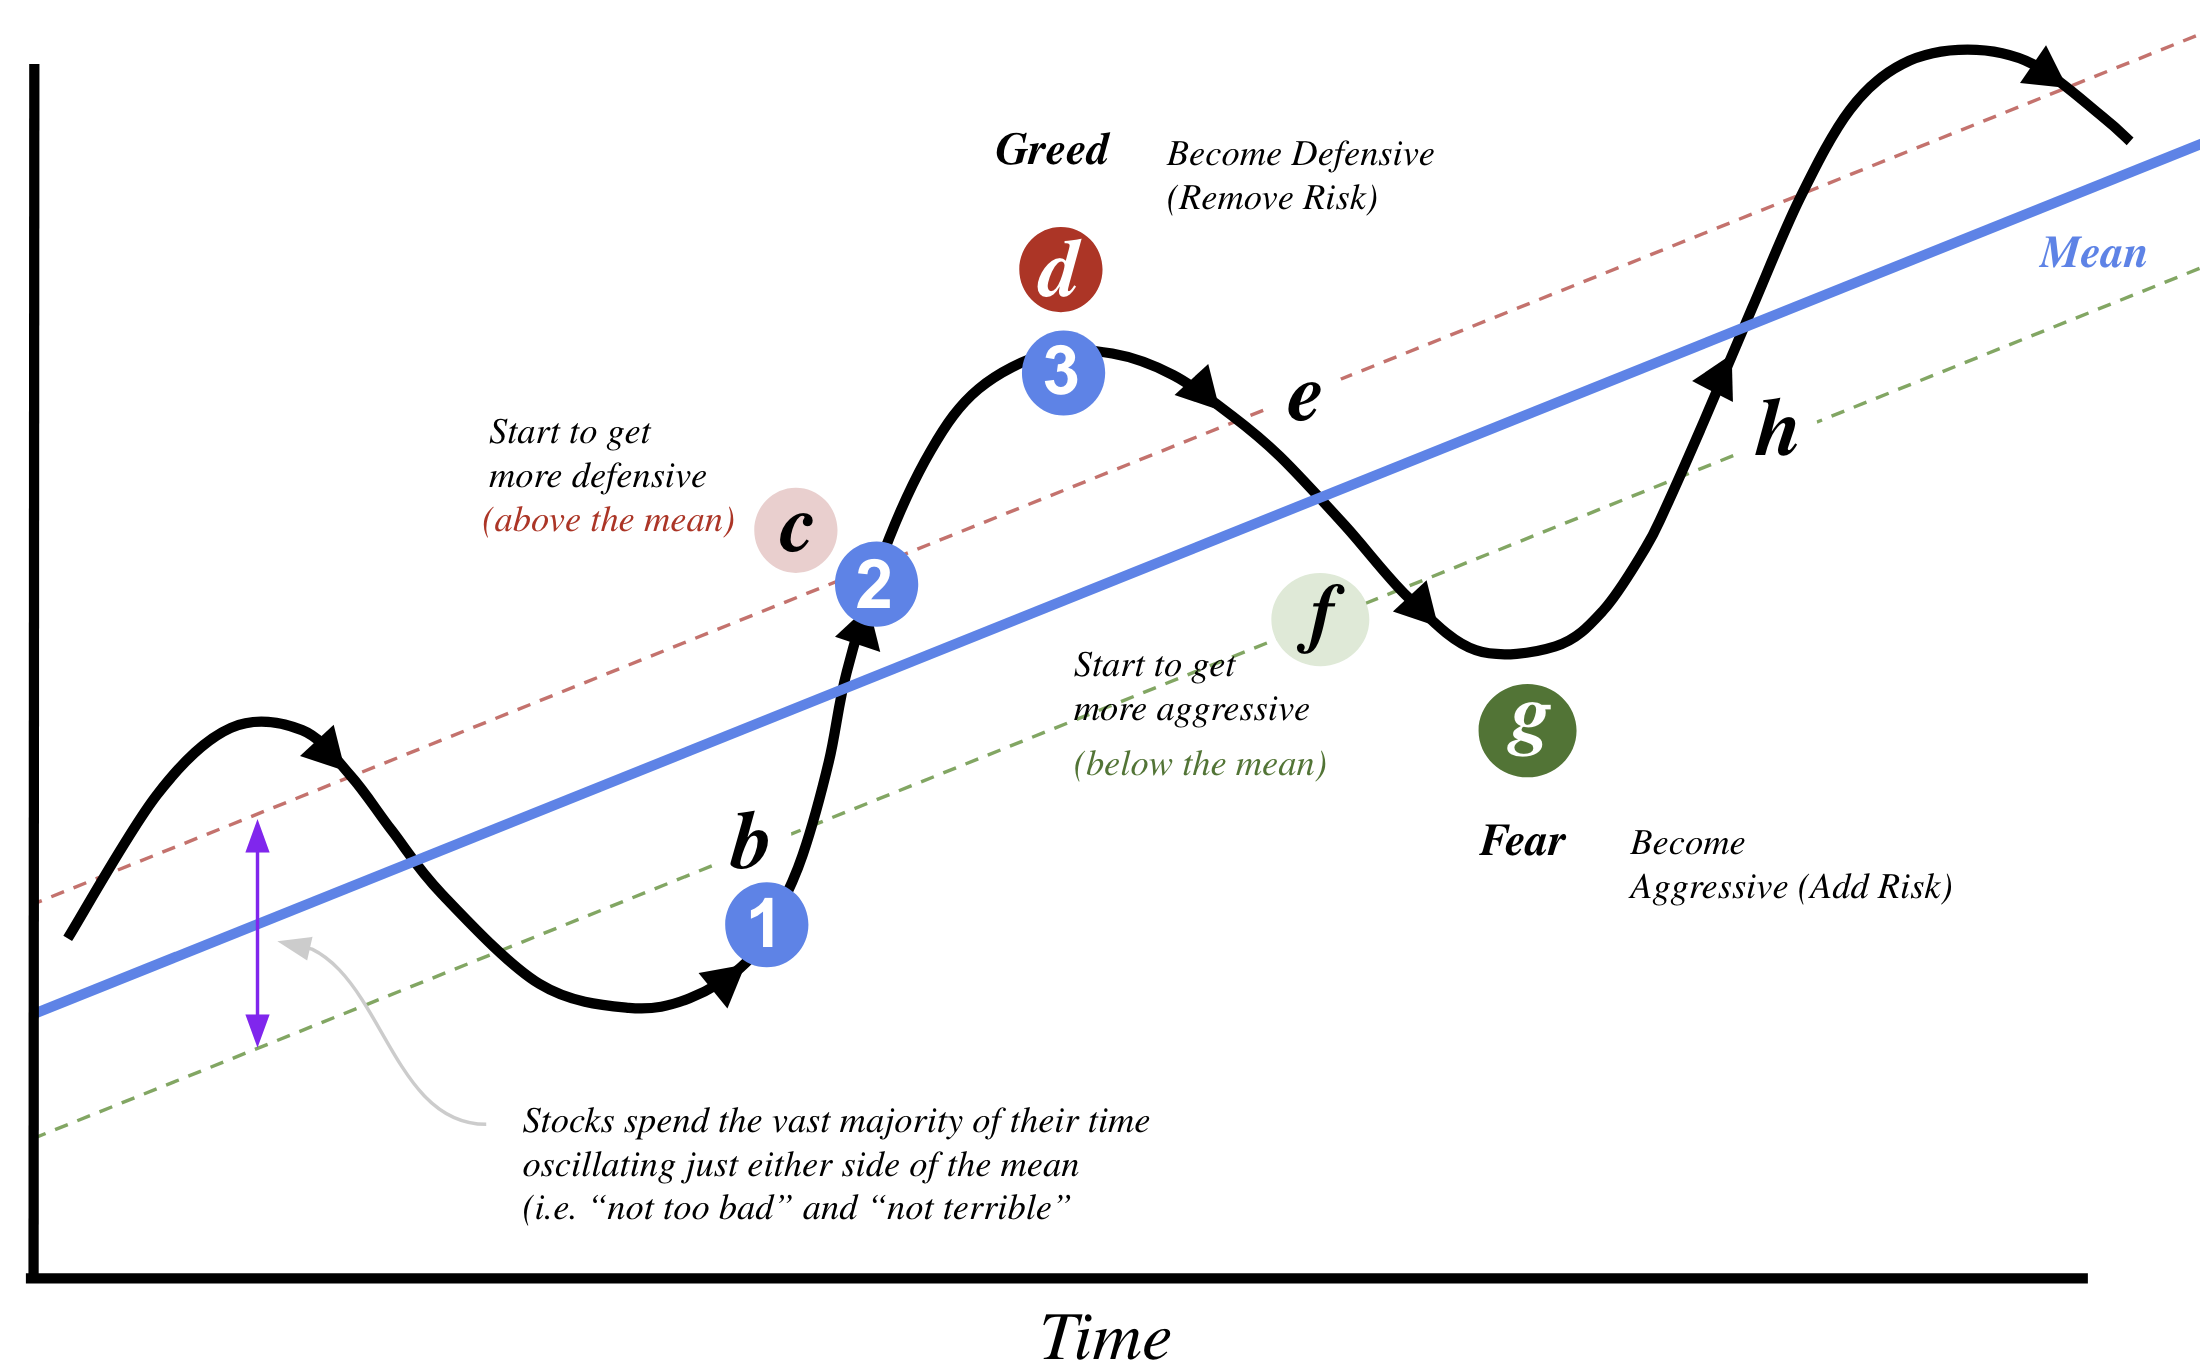
Here’s a diagram from Marks’ from his book ““Mastering The Market Cycle: Getting the Odds on Your Side”
I’ve annotated Marks’ diagram with my own commentary (e.g. “start to get more aggressive” etc) for clarity. What’s important is two-fold:
- get defensive when investors are overly optimistic; and
- get aggressive when investors are fearful.
In other words, during times of excessive optimism (point “d”) – the shape of your risk/reward profile should look more like the “blue curve” vs the “black curve”
Where the “blue curve” was 2/3 debt and 1/3 asset ownership.
However, when valuations are well below their long-term average and there is widespread fear, we then skew towards the “black curve”
🔐 Key Considerations
Below are the 5 key points I gleaned from Marks’ memo:
- Ownership vs. Debt: Understand the fundamental differences — choose the mix that aligns with your risk tolerance and return objectives.
- Risk Posture: Define your desired risk posture, considering your individual circumstances and investment goals.
- Market Efficiency: Recognize that markets are not perfectly efficient, creating opportunities for skilled investors to generate alpha.
- Dynamic Allocation: Consider adjusting your asset allocation in response to market conditions and changes in your risk tolerance.
- Manager Selection: If seeking alpha, carefully evaluate potential investment managers to identify those with a demonstrated 20+ year track record of generating superior risk-adjusted returns..
For example, with respect to that last point, specifically look at how the manager performed during the downturns of 2000, 2008 and more recently 2022 (when the S&P 500 lost ~20%)
And how did they play defense in the lead up to these events (e.g., 1999, 2007 and 2021)?
For example, long-term readers will recall I was taking risk off the table in Q4 2021 – warning of excessive valuations (specifically in tech).
This decision lead to an ~19% outperformance in 2022 (see below) – which the put me in a strong position to play offense in 2023
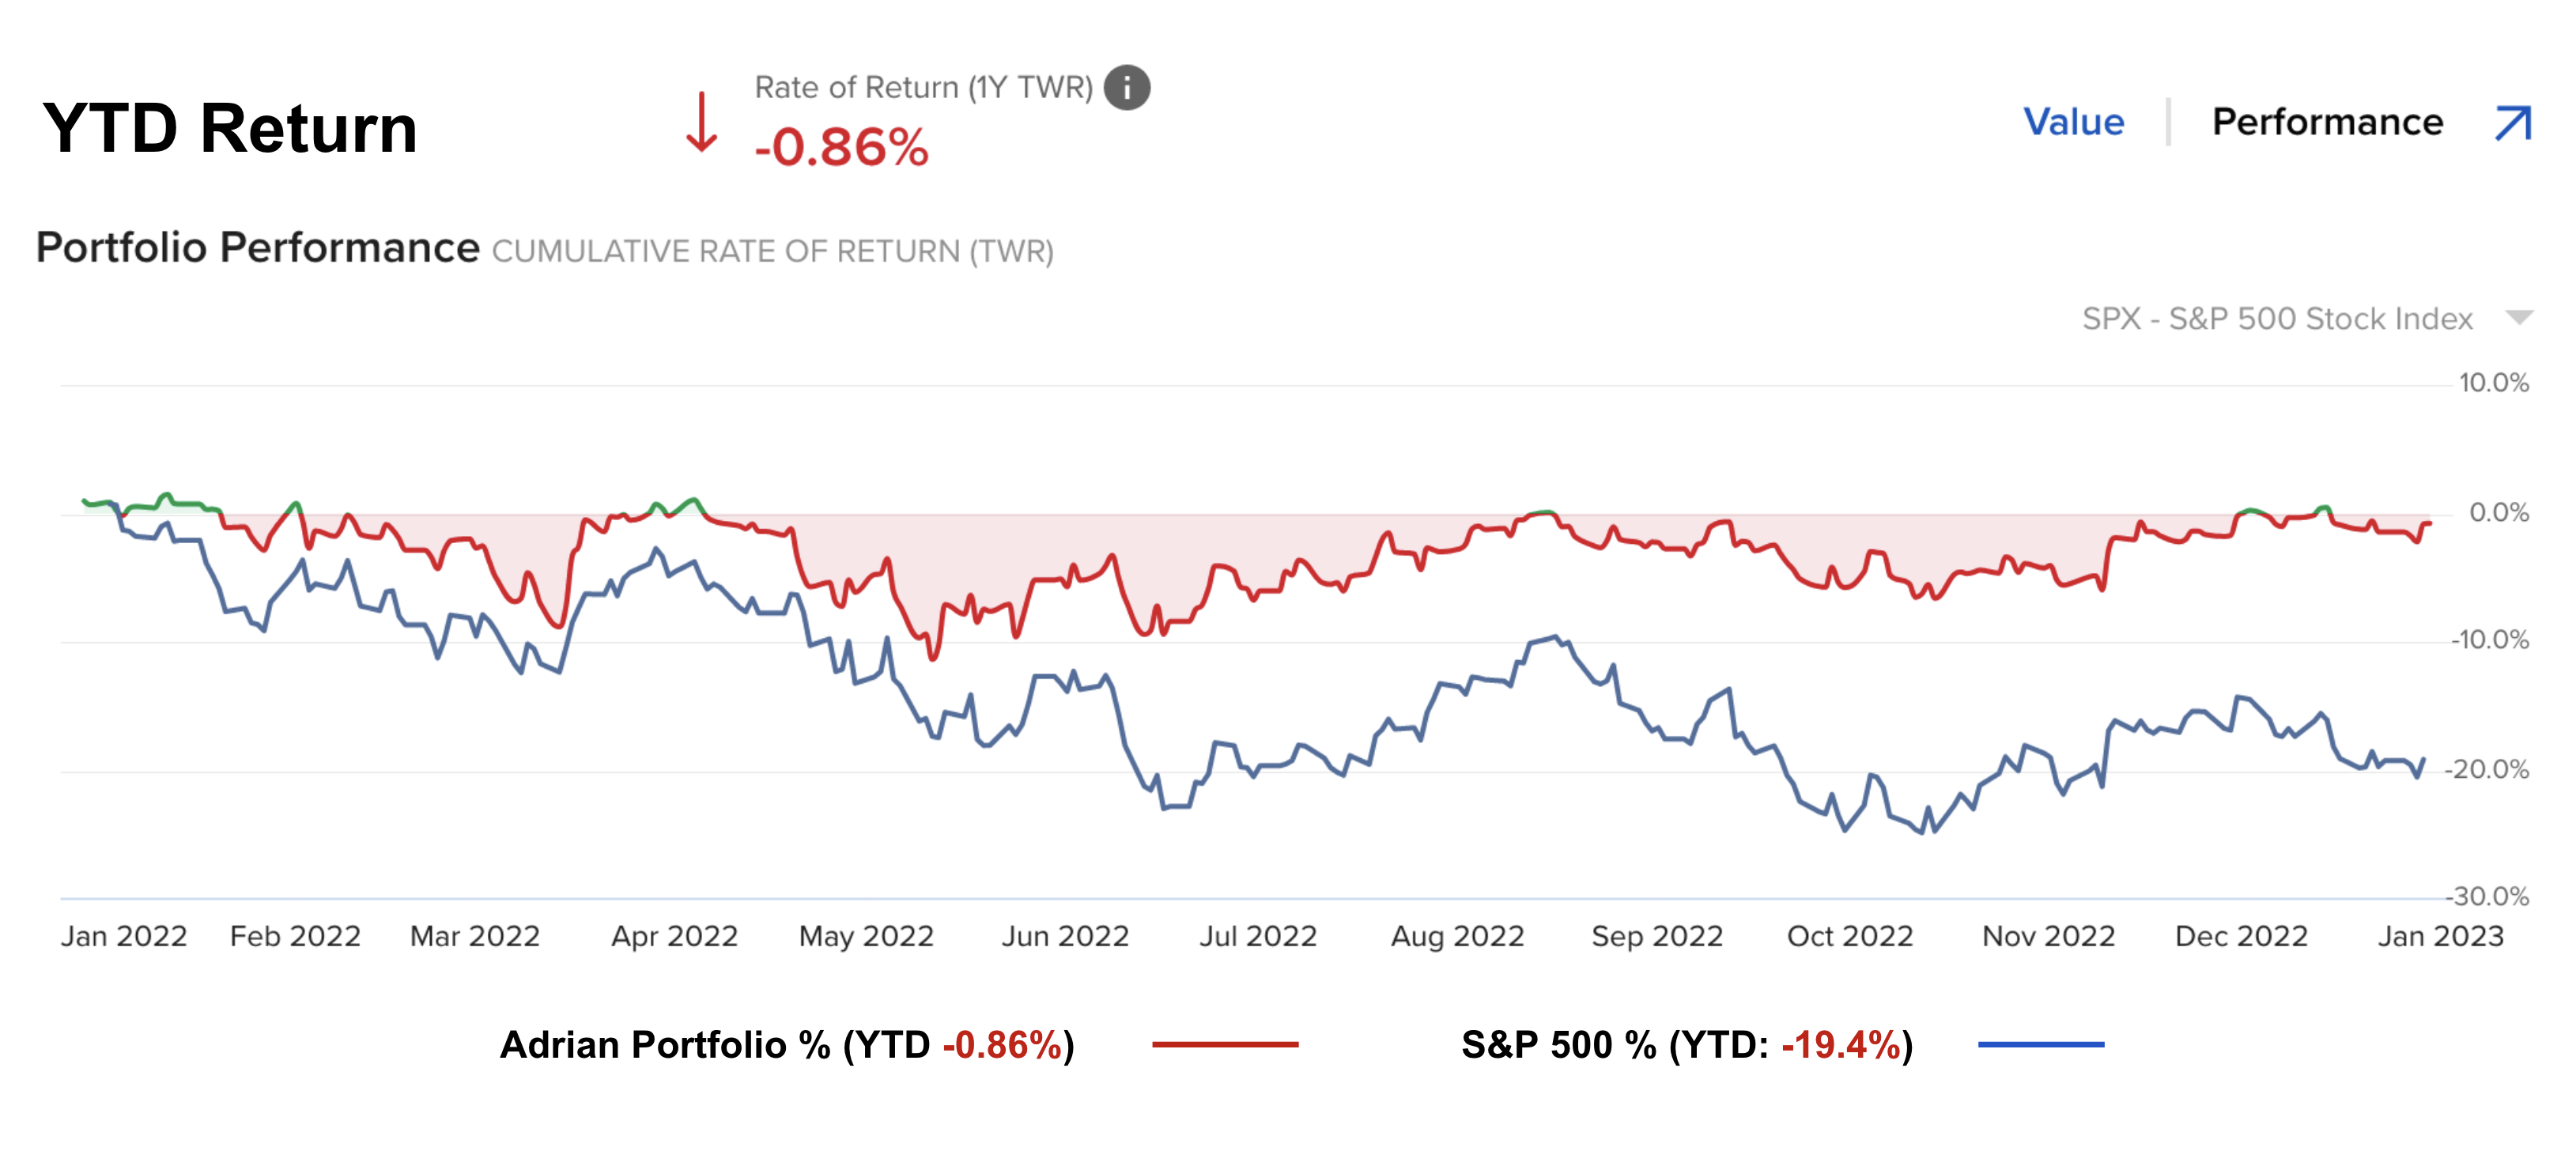
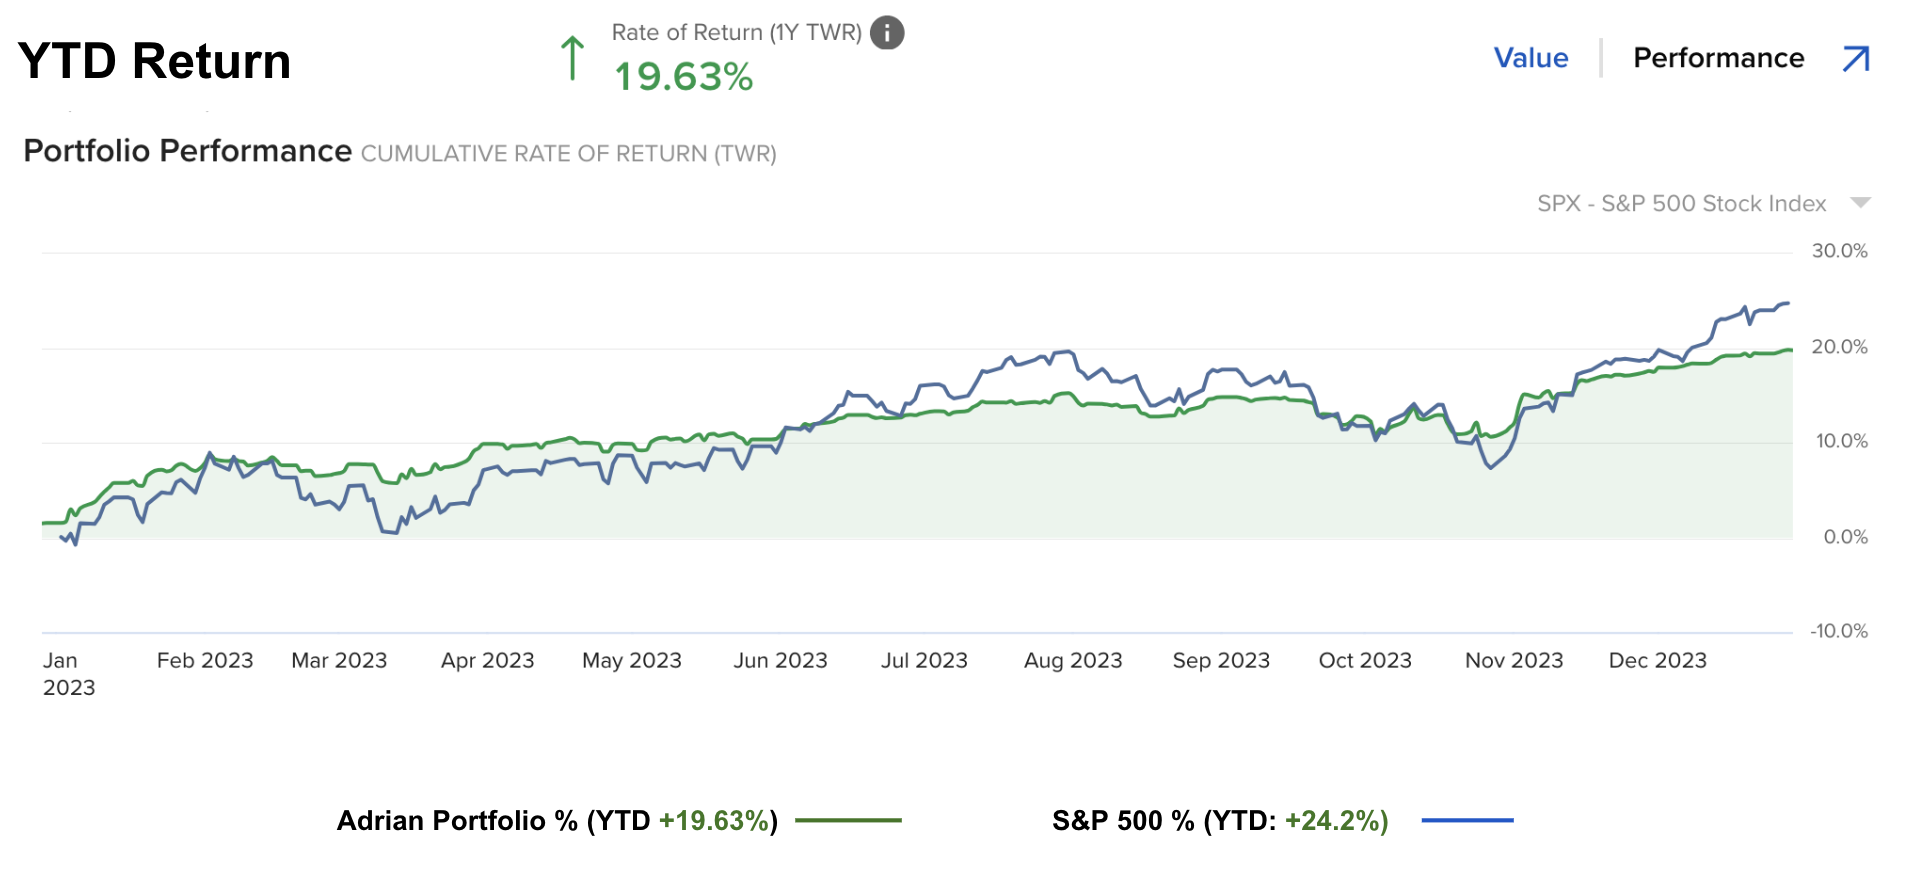
Below are my 2023 returns (~20%) – where I capitalized on better risk/reward valuations for ownership assets (e.g., stocks):
At the time of writing, S&P 500 valuations have similarities to 2021.
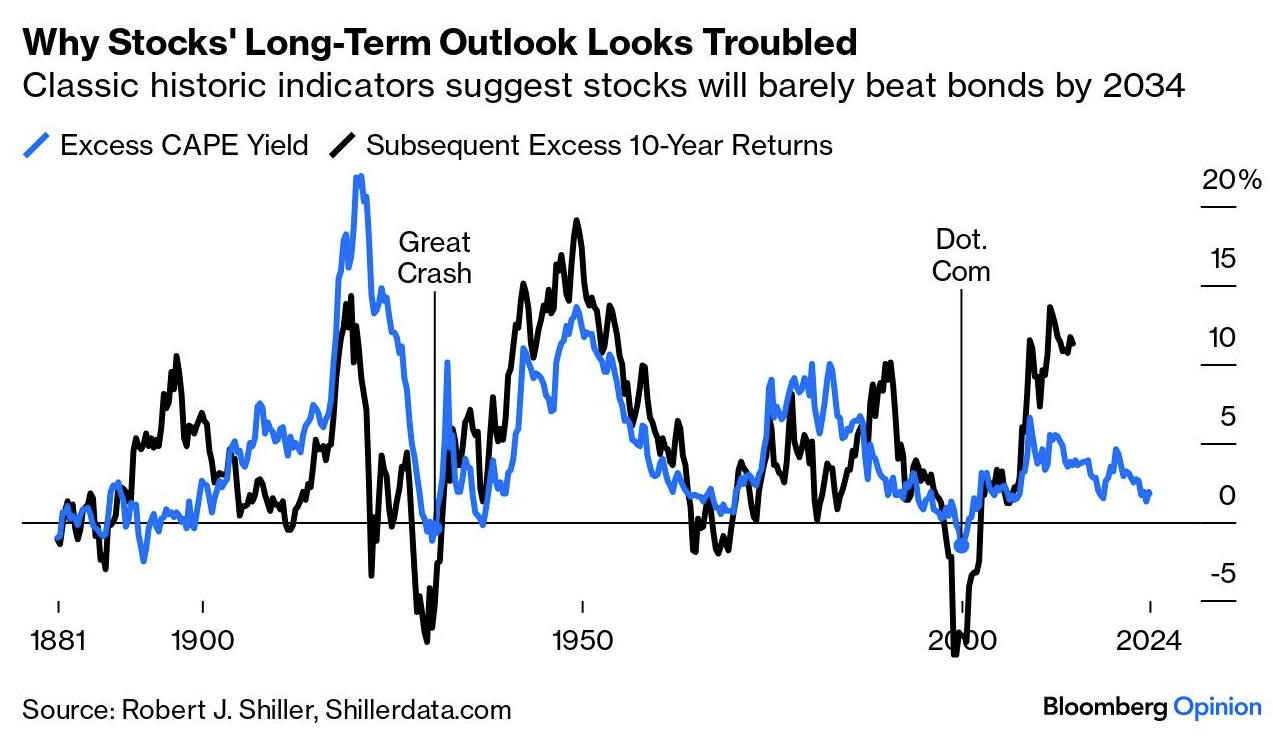
I talked about this yesterday… sharing some compelling valuation charts from Bloomberg Opinion.
However, there’s a big difference.
Bond yields are meaningfully higher – which sets up a very different equation.
Today the equity risk premium is essentially zero.
We saw something similar in 1999/2000 and prior to the crash of 1929
For me, it’s now time to carefully evaluate your defense.
And whilst the S&P 500 could easily continue to rally into the end of the year (e.g., trading as high as 6,000) – for me that is neither here nor there.
I see this as standing in front of a steamroller trying to pick up pennies!
For example, you gain another ~5% – however you’re willing to risk maybe 20%.
Is that a good trade?
I would rather risk 5-10% of downside to collect 20-30% of upside.
But that requires patience and control of your emotions.
💥 What Matters to Investors
If you have 10 minutes – make time to read Howard Marks memo.
And not just this one – read them all if you can.
Marks echoes the principles of Benjamin Graham – taking a holistic approach to asset allocation.
Asset allocation is not merely a matter of selecting asset classes.
It’s a holistic process that requires a deep understanding of your investment goals, risk tolerance, and the dynamics of the market (for example, stock valuations, bond yields, rate environment and so on).
By carefully considering these factors and implementing a well-defined strategy, investors can construct a portfolio that has the potential to achieve their financial objectives while managing risk effectively.

