Words: 1,115 Time: 5 Minutes
- Persistent issues with forecasting
- Projection vs Reality
- The need for more adaptive intertemporal thinking
Once again, it’s that time of year.
Investment houses are set to release their forecasts for the upcoming year.
Why they bother I don’t know…
And whilst there is still approximately one month to go – if the markets finish anywhere near 5,800 – most forecasts made for 2024 will be abysmal.
As a reminder – the average end-of-year forecast for 2024 was ~4600 (as I outlined here).
The closest looks like being Ed Yardeni – who forecast 5,400 EOY – however at the time appeared wildly bullish.
Well done Ed…
J.P. Morgan told their clients we would finish 2024 around 4200 – currently more than 40% off the mark.
For most people who were 40% out with their forecast – they might lose their job.
But not J.P Morgan – their brand will remain intact.
But I’m not here to sledge JP Morgan or the countless number of others who got 2024 wrong… that’s low-hanging fruit.
The point is forecasting stock market moves over such a short-term period (e.g., only one year) is a waste of time.
What’s more, for most of us, they hold little relevance.
What I consistently tell readers is what matters instead is the long-term view, spanning decades or more.
Further, that is how your performance should be measured – over decades.
Anything less than 5-years is an incredibly short period of time (let alone just 12 months)
Despite this, the same flawed approach of forecasting continues.
And it’s not about to change…
Persistent Issues in Assumptions
- The tendency for institutions to cluster around a few rounded figures; an
- There’s generally an unfounded optimism in certain asset classes.
Every year I see this pattern repeat…
From mine, it suggests a complete lack of independent thought… wreaking of group think.
And whenever you see group think – it’s highly vulnerable to blind spots.
From there, blind spots mean you miss opportunity (as I will demonstrate shortly with 2 charts)
For example, as we will see in the next few weeks, expect projections remaining cluttered – even as underlying market conditions shift dramatically.
Two patterns repeat:
- During times of overvaluation (as we find today) – expected 12-month returns do not adjust sufficiently downward; and
2. When markets are undervalued, the projections remain conservative, missing exceptional buying opportunities.
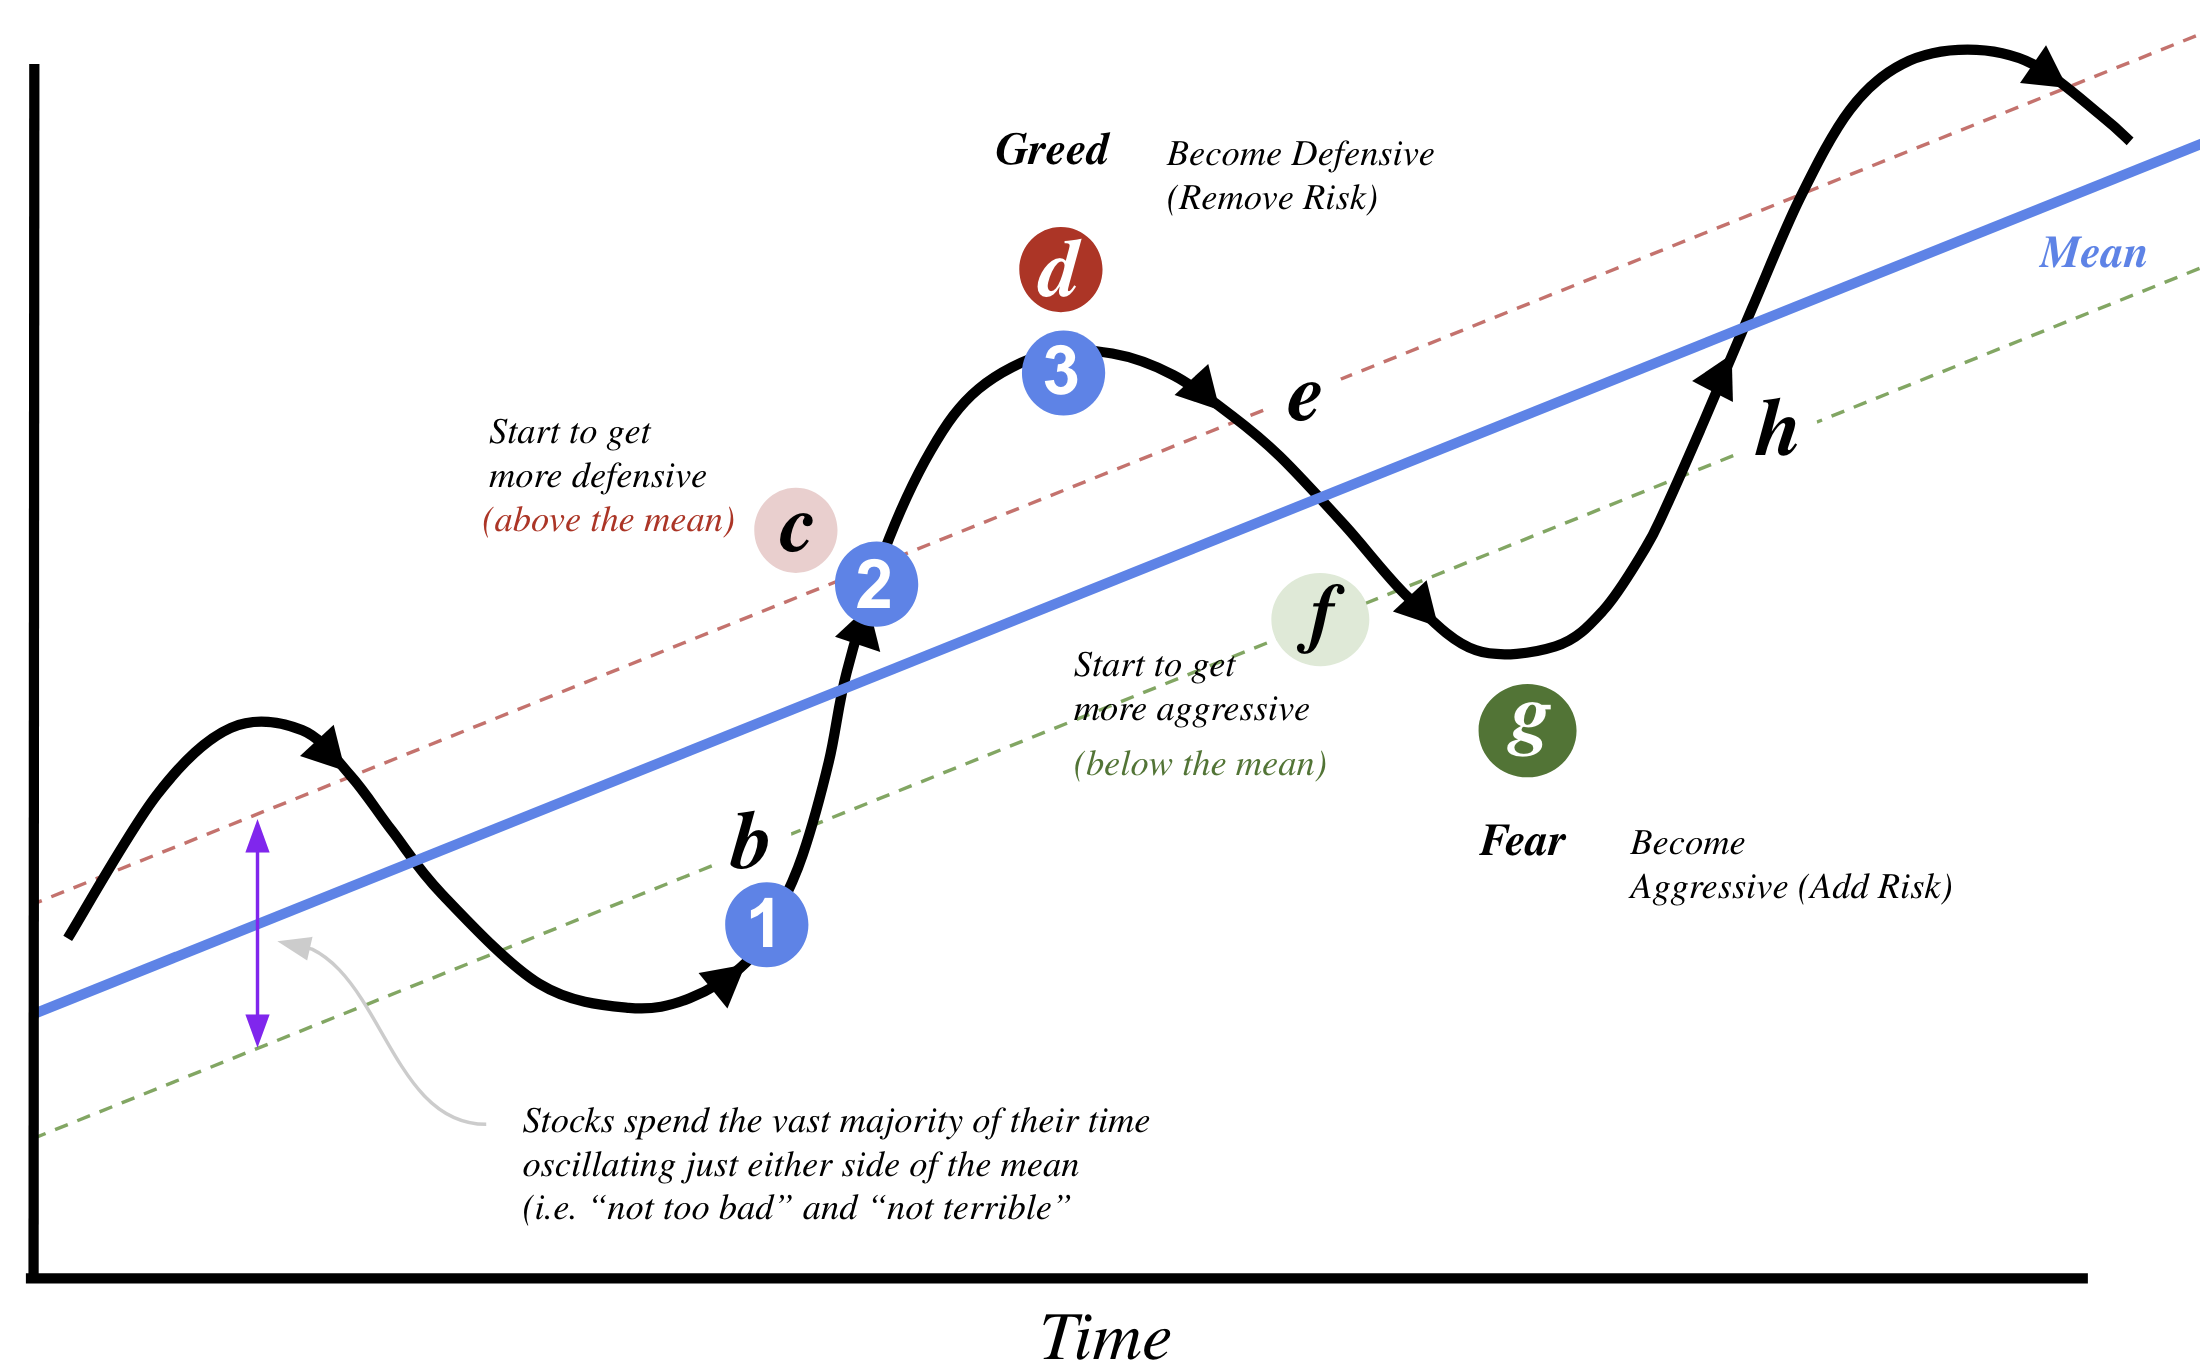
Here I’m reminded by Howard Marks market cycle:

What these long-range forecast tend to do is simply stick with the slowly rising blue line (or the mean ~8%)
From mine, this is lazy thinking and not overly helpful.
Consider this:
At the time of writing, the S&P 500 is trading 5969.
I’m willing to bet the bulk of forecasts (at least 90%) for the S&P 500 in 2025 will be somewhere between 6200 and 6600
It’s also likely we see a handful of forecasts slightly below and above that range – but your mean will be in the realm of an 8% gain.
We will find out over the next few weeks – let’s see how I go.
Now if I’m correct – feel free to pin these targets above your desk – and see how foolish they look in December of 2025.
🔭 Projections and Reality
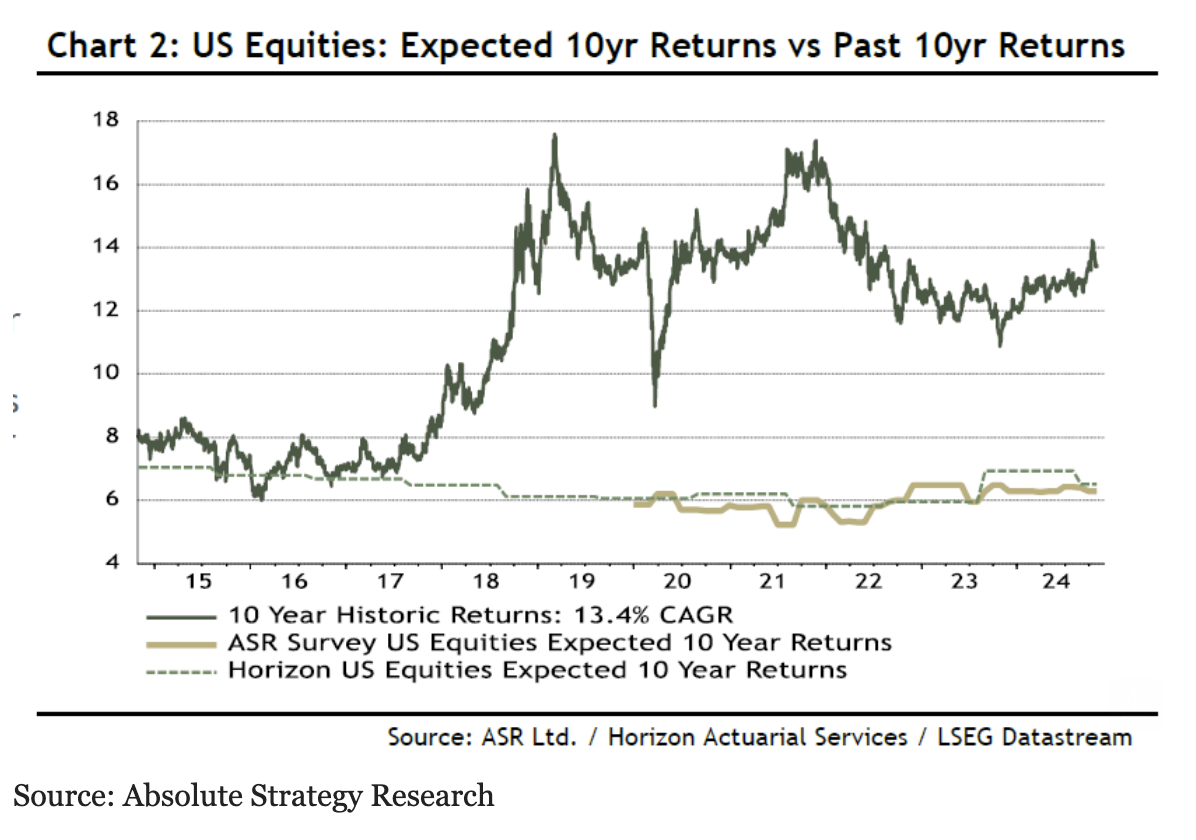
In support of my forecast thesis – data compiled by Absolute Strategy Research highlights how long-term projections fail to align with actual market outcomes.
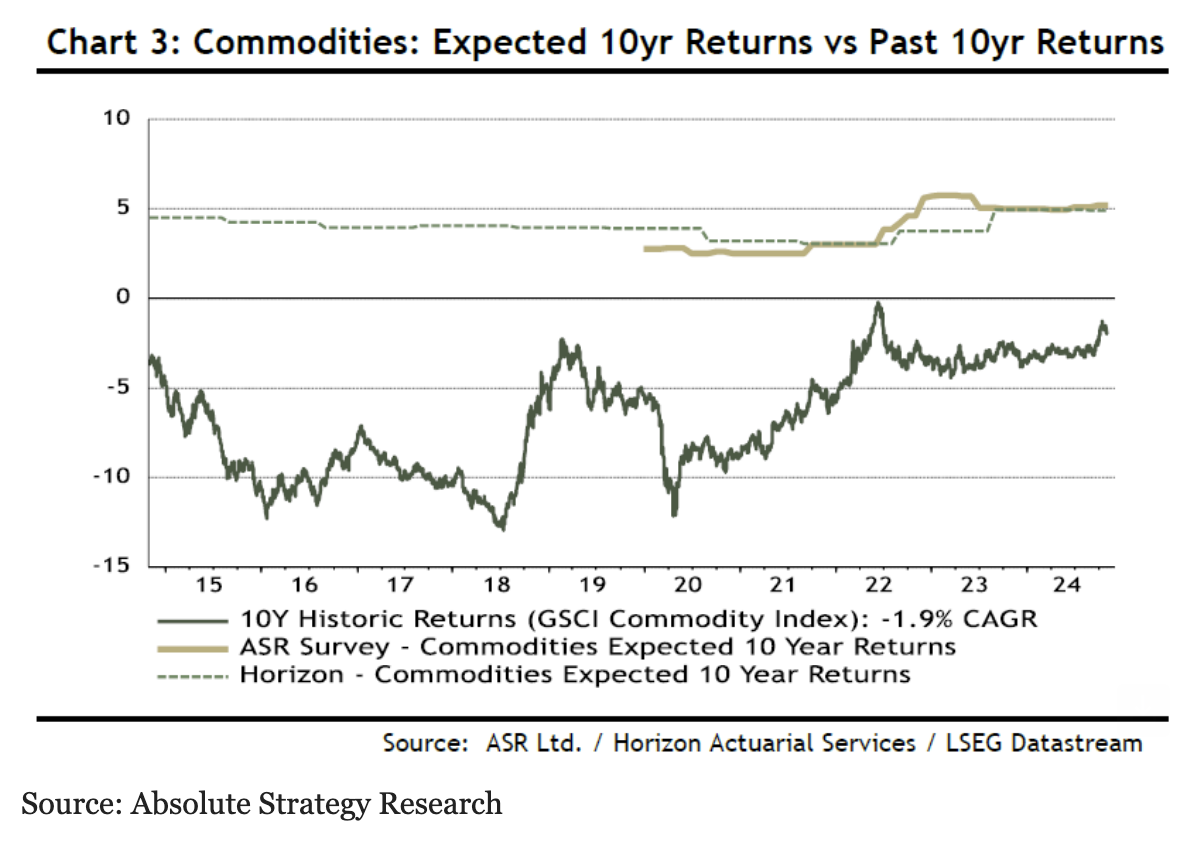
Consider these two long-range 10-year studies
The expected returns remain extremely static (i.e., never above 7% and rarely below 6%)) – even as realized returns swing significantly.
Immediately you can see the flaw…
Pension funds, for instance, maintained steady return assumptions throughout the market highs of 2000 and the lows of 2010, ignoring clear valuation signals that could have prompted adjustments.
Again, such blind spots lead to lost opportunity.
A similar pattern exists for commodities, where assumptions of ~5% returns persist despite a decade of woeful performance.
For example, why a static 5% return expectation when the real-time data is telling you otherwise?
This is exceptionally lazy thinking….
All it does it reiterate (to me) how poor these long-range projections tend to be.
What’s more, due to their rigidity, they build in a lack of responsiveness to changing economic realities.
Instead, if their systems were equipped with cybernetics (i.e., a feedback loop providing the system with signals) – they would be far better positioned to deal with current conditions.
⌛ S&P 500 Weekly Update
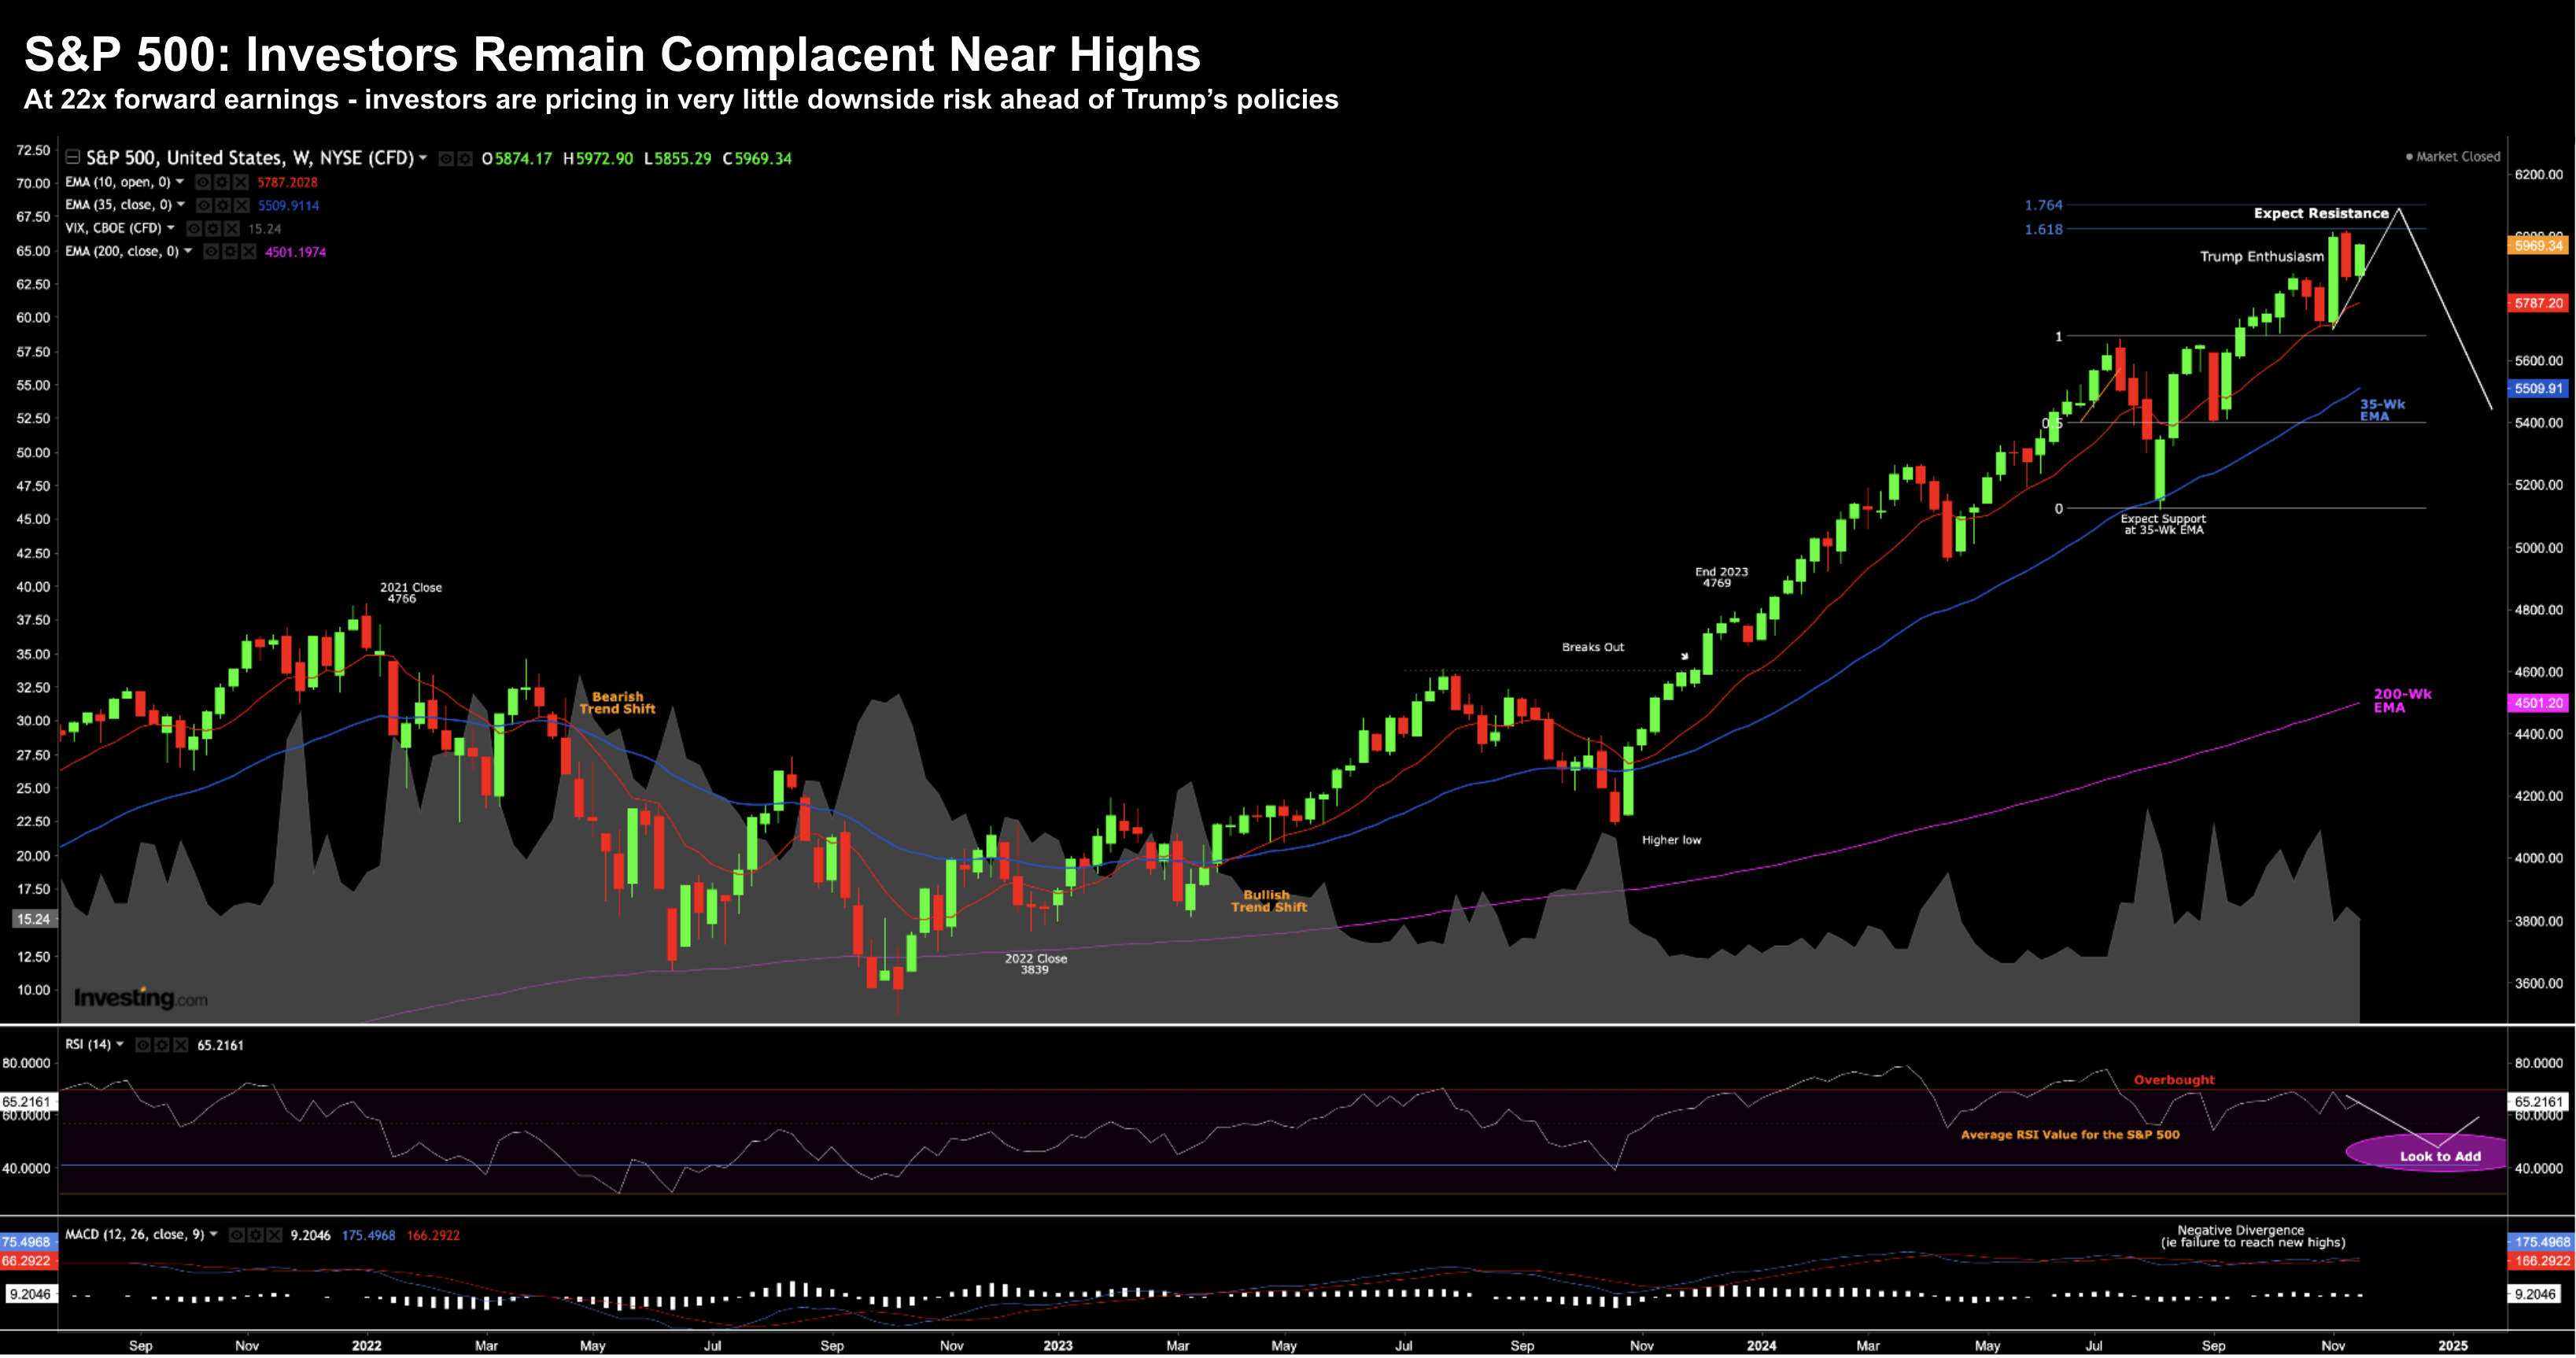
There was very little movement for major indices this week – as investors push prices towards strong overhead resistance.
Nov 23 2024
Nothing much has changed with this chart for the better part of 6 or more weeks.
Markets have inched higher post Trump’s election win – moving towards what I think will be near-term overhead resistance.
However, technically I’m not enthusiastic for reasons I’ve previously discussed at length.
Repeating my sentiment of the past few weeks – I’m watching the strong negative divergence with momentum indicators such as the weekly MACD and RSI.
And whilst markets could easily push a little higher (e.g., 6200) – I think it’s getting closer to exhaustion.
But what matters far more is its valuation at 22x forward earnings.
With the 10-year yielding almost 4.40% (and likely headed higher) – investors are taking unnecessary risks at these levels.
Again, it’s lazy thinking.
Remember:
In the short-term, the stock market is a voting machine. It’s a popularity contest – where “hot stocks” are bid at very high multiples.
Analysts (by default) are encouraged to only say “buy” (irrespective of the valuations). If they dare say “sell” – well they can say goodbye to further business from that company.
What’s more – investment houses make money from investors buy stocks. They don’t make money from you selling or staying out of the market.
Now what they won’t tell you is over the long-run – the stock market reflects fundamentals and valuations.
Price is what you pay. Value is what you get.
For what it’s worth, the rolling 10-year average PE is 18x (approx 4 turns lower than today)
4 x $275 = 1,100 S&P 500 points (or ~18%)
Excluding a few small pockets (energy is one) – I don’t see a lot of value.
💥 What Matters for Investors
The practice of forecasting, whether short-term or long-term, often falls prey to rigidity, groupthink, and misplaced optimism.
What you also get is Wall Street default bias to the upside.
What’s lacking (for me) is cybernetics, intertemporal thinking and the removal of obvious conflicts on interest.
In other words, investment houses want you in the market, not out.
For those less familiar, intertemporal means relating to decisions that have consequences over time.
In behavioral economics, intertemporal choice is the study of how people value payoffs at different points in time.
It’s a process of weighing and choosing outcomes that occur at different points in time, such as a short-term versus a long-term benefit.
For institutions tasked with stewarding assets over decades, these shortcomings are especially consequential.
To truly embrace long-termism, investment strategies must go beyond perfunctory assumptions, incorporating more nuanced and adaptive approaches that reflect changing market realities (cybernetics)
Cybernetics examines how systems process information, respond to feedback, and adapt to changing conditions.
The term comes from the Greek word kybernētēs, meaning “steersman” or “governor,” highlighting its focus on regulation and control.
Without this shift, projections risk being not just unhelpful, but actively harmful to long-term financial stability.


