Words: 1,617 Time: 6 Minutes
- Fed’s cautious monetary approach to 2025
- Mixed economic indicators
- Market valuations are not without risks
It’s Christmas Eve in the U.S… where markets were only open for half the day.
For now, stocks are shaking off Powell’s hawkish pivot last week.
More on the S&P 500 chart further on…
Beforehand, the Fed’s 0.25% Dec rate cut brought its target rate to 4.50%.
This move was highly anticipated – where futures had priced it a 96% probability.
There were no surprise – as we know Powell hates to surprise markets.
The decision was officially communicated via a press release that restated the technical aspects of the cut without adding significant new commentary.
I felt that Powell did a better job of making the case for rate hikes (vs cuts).
And bond markets acted accordingly.
Key among the communications at this meeting was the inclusion of the so-called “dot plot” or Summary of Economic Projections (SEP).
What each of these dots show are individual Fed member forecasts for variables like unemployment, inflation, and growth.
But don’t pay too much attention to this data… I think it’s a waste of your time.
The “dots” have constantly proven to be poor predictors…. with the Fed boasting a woeful forecasting record.
Neither Bernanke or Greenspan saw the collapses of 2008 and 2000 respectively.
Both forecast a strong economy a year before markets collapsed.
Therefore, we should question the weight (and merit) of ‘forward guidance’.
Things change. And quickly.
If I were the Fed Chair – I’d offer a lecture on the folly of forecasting.
All we have are probabilities – nothing more.
That said, Powell could not help signal further normalization with inflation – emphasizing strength in the labor market and overall economy.
Mixed Signals
From mine, I think the economy (and market) will be stress tested next year.
For example, this week New York Fed President John Williams acknowledged significant uncertainty heading into 2025, citing changes to monetary policy, immigration, and fiscal changes.
“We need to be data dependent and we have time to really assess the data, assess what’s happening, and come to the best judgments based on the data, the outlook and the risks to achieve our goals. I think we’re in a great place, well positioned, for what lies ahead”.
Time will tell.
That said, I think economic data continues to send conflicting messages about the U.S. economy’s health.
Let’s start with jobs…
The November payroll report highlighted 227,000 new jobs, exceeding expectations.
Markets celebrated the news in their usual style…
However, a deeper look at the Bureau of Labor Statistics’ (BLS) household survey tells a different story.
It revealed a 355,000 job loss in the labor force for November, contrasting sharply with the establishment survey’s headline figure.
If you want to dive into the details – Mike Shedlock’s blog is as good as it gets.
That’s my go-to for the job report.
From mine – the divergence between the two surveys — 582,000 jobs — is stunning.
Historically, such broad disparities tend to reconcile over time, often aligning more closely with the household survey’s outcomes.
However, as Mish explains, this discrepancy suggests the economy is not firing on all cylinders.
Now on this Powell told us the economy is “very, very strong”…
Again, he sounds very much like Bernanke in 2007 and Greenspan in 1999; i.e., nothing to see here.
However, the labor force participation rate is slipping (LFPR) – falling from 62.7% in September to 62.5% in November 2024 (not mentioned by Powell)
Persistently low LFPR rates signal increasing discouragement among job seekers and shrinking workforce engagement… something to watch.
Moving to inflationary trends – they also show a mixed picture.
The Consumer Price Index (CPI) had shown encouraging signs earlier in 2024, declining steadily from 3.5% in March to 2.4% in September.
However, inflation reversed course in the following months, with the CPI climbing back to 2.7% by November.
Simultaneously, the Producer Price Index (PPI), often a leading indicator for consumer inflation, rose by 3.0% year-over-year in November, further heightening inflationary concerns.
Typically higher PPI flows through to finished goods over time…. again something to watch.
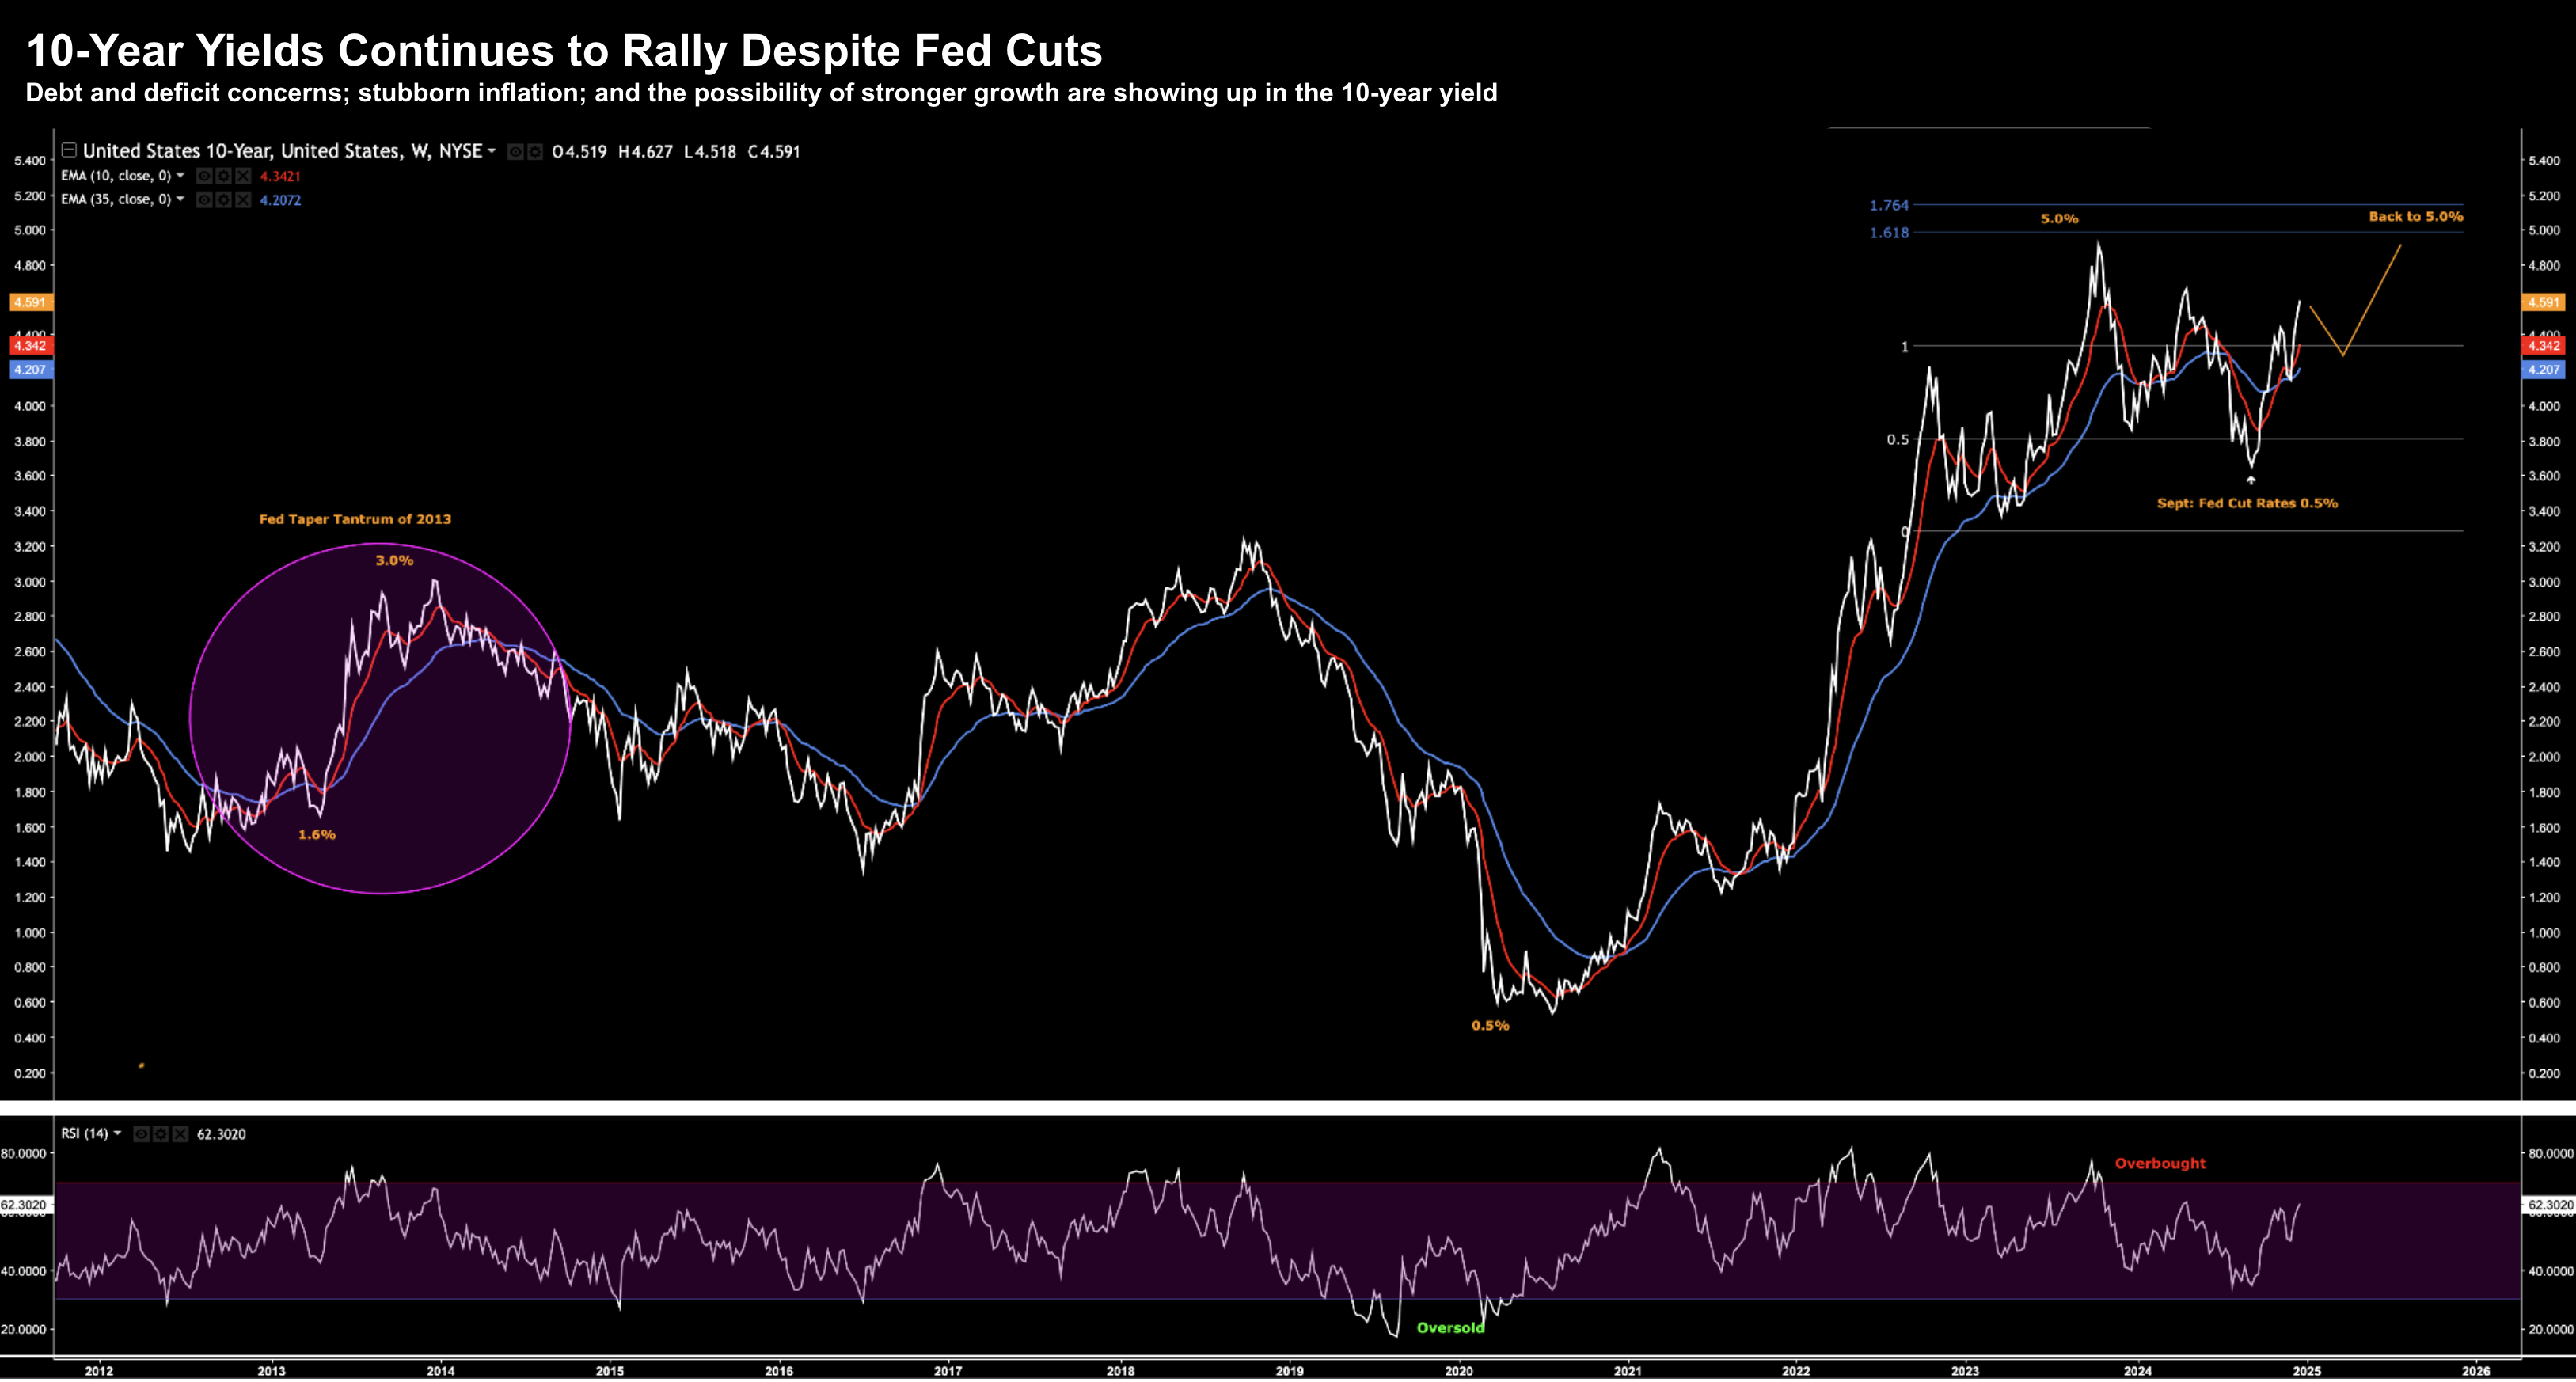
The move did not go unnoticed by the bond market (the smart money) – as yields continued their move higher.
Policy Implications
Despite the mixed signals – the Fed see further rate cuts ahead (albeit fewer than the market desires)
However, balancing its dual mandate of price stability (inflation to 2.0%) and full employment will remain a difficult challenge for the Fed in 2025.
From mine, the lack of a strong correlation between interest rates and employment complicates this task (you only need to look at history)
For example:
- The late 1970s saw both high inflation and unemployment; however
- In 2012, near-zero interest rates coincided with elevated unemployment of 7.9%.
These examples illustrate the difficulty of achieving both mandates simultaneously.
The Fed’s January 2025 meeting looms as another pivotal moment – especially given the December “pivot”.
I see two scenarios:
- Another 0.25% rate cut to support concerns with softening employment (see Mish’s report); or
- Holding rates steady amid stubborn inflationary trends (especially with services inflation)
Naturally their decision will hinge on critical data (as Williams stressed), including December’s CPI (to be released January 15, 2025) and the December employment report (January 3, 2025).
Current evidence suggests the Fed may be reacting more to economic trends than proactively shaping them.
For example, Powell’s (and Williams) referral to a “data-dependent” approach underscores that the central bank is often following market indicators instead of leading them.
This lag risks exacerbating economic downturns, as timely, decisive actions to avert recessions may be delayed.
Put it this way, if you are driving a car, where do you spend most of your time looking?
Forward or back?

If you are forever looking in the rear-view mirror – your odds of crashing or running off the road increase.
Investors and policymakers must watch these developments closely.
While the Fed is cutting rates in response to employment challenges, the persistence of inflation could soon compel a dramatic policy shift, potentially leaving markets vulnerable to further turbulence.
Bond Markets Look Through the Windshield
Whilst the windshield will be foggy at times – this is where bond markets focus their gaze (unlike equities).
Bond markets are spiking in response to the risks… despite the Fed lowering short-term rates.
December 24 2024
This is crucial – as this reflects the price of borrowing money in the real world.
Rising yields are bad news for existing bondholders because they signal that investors in the market are selling, which causes the value of their bonds to drop.
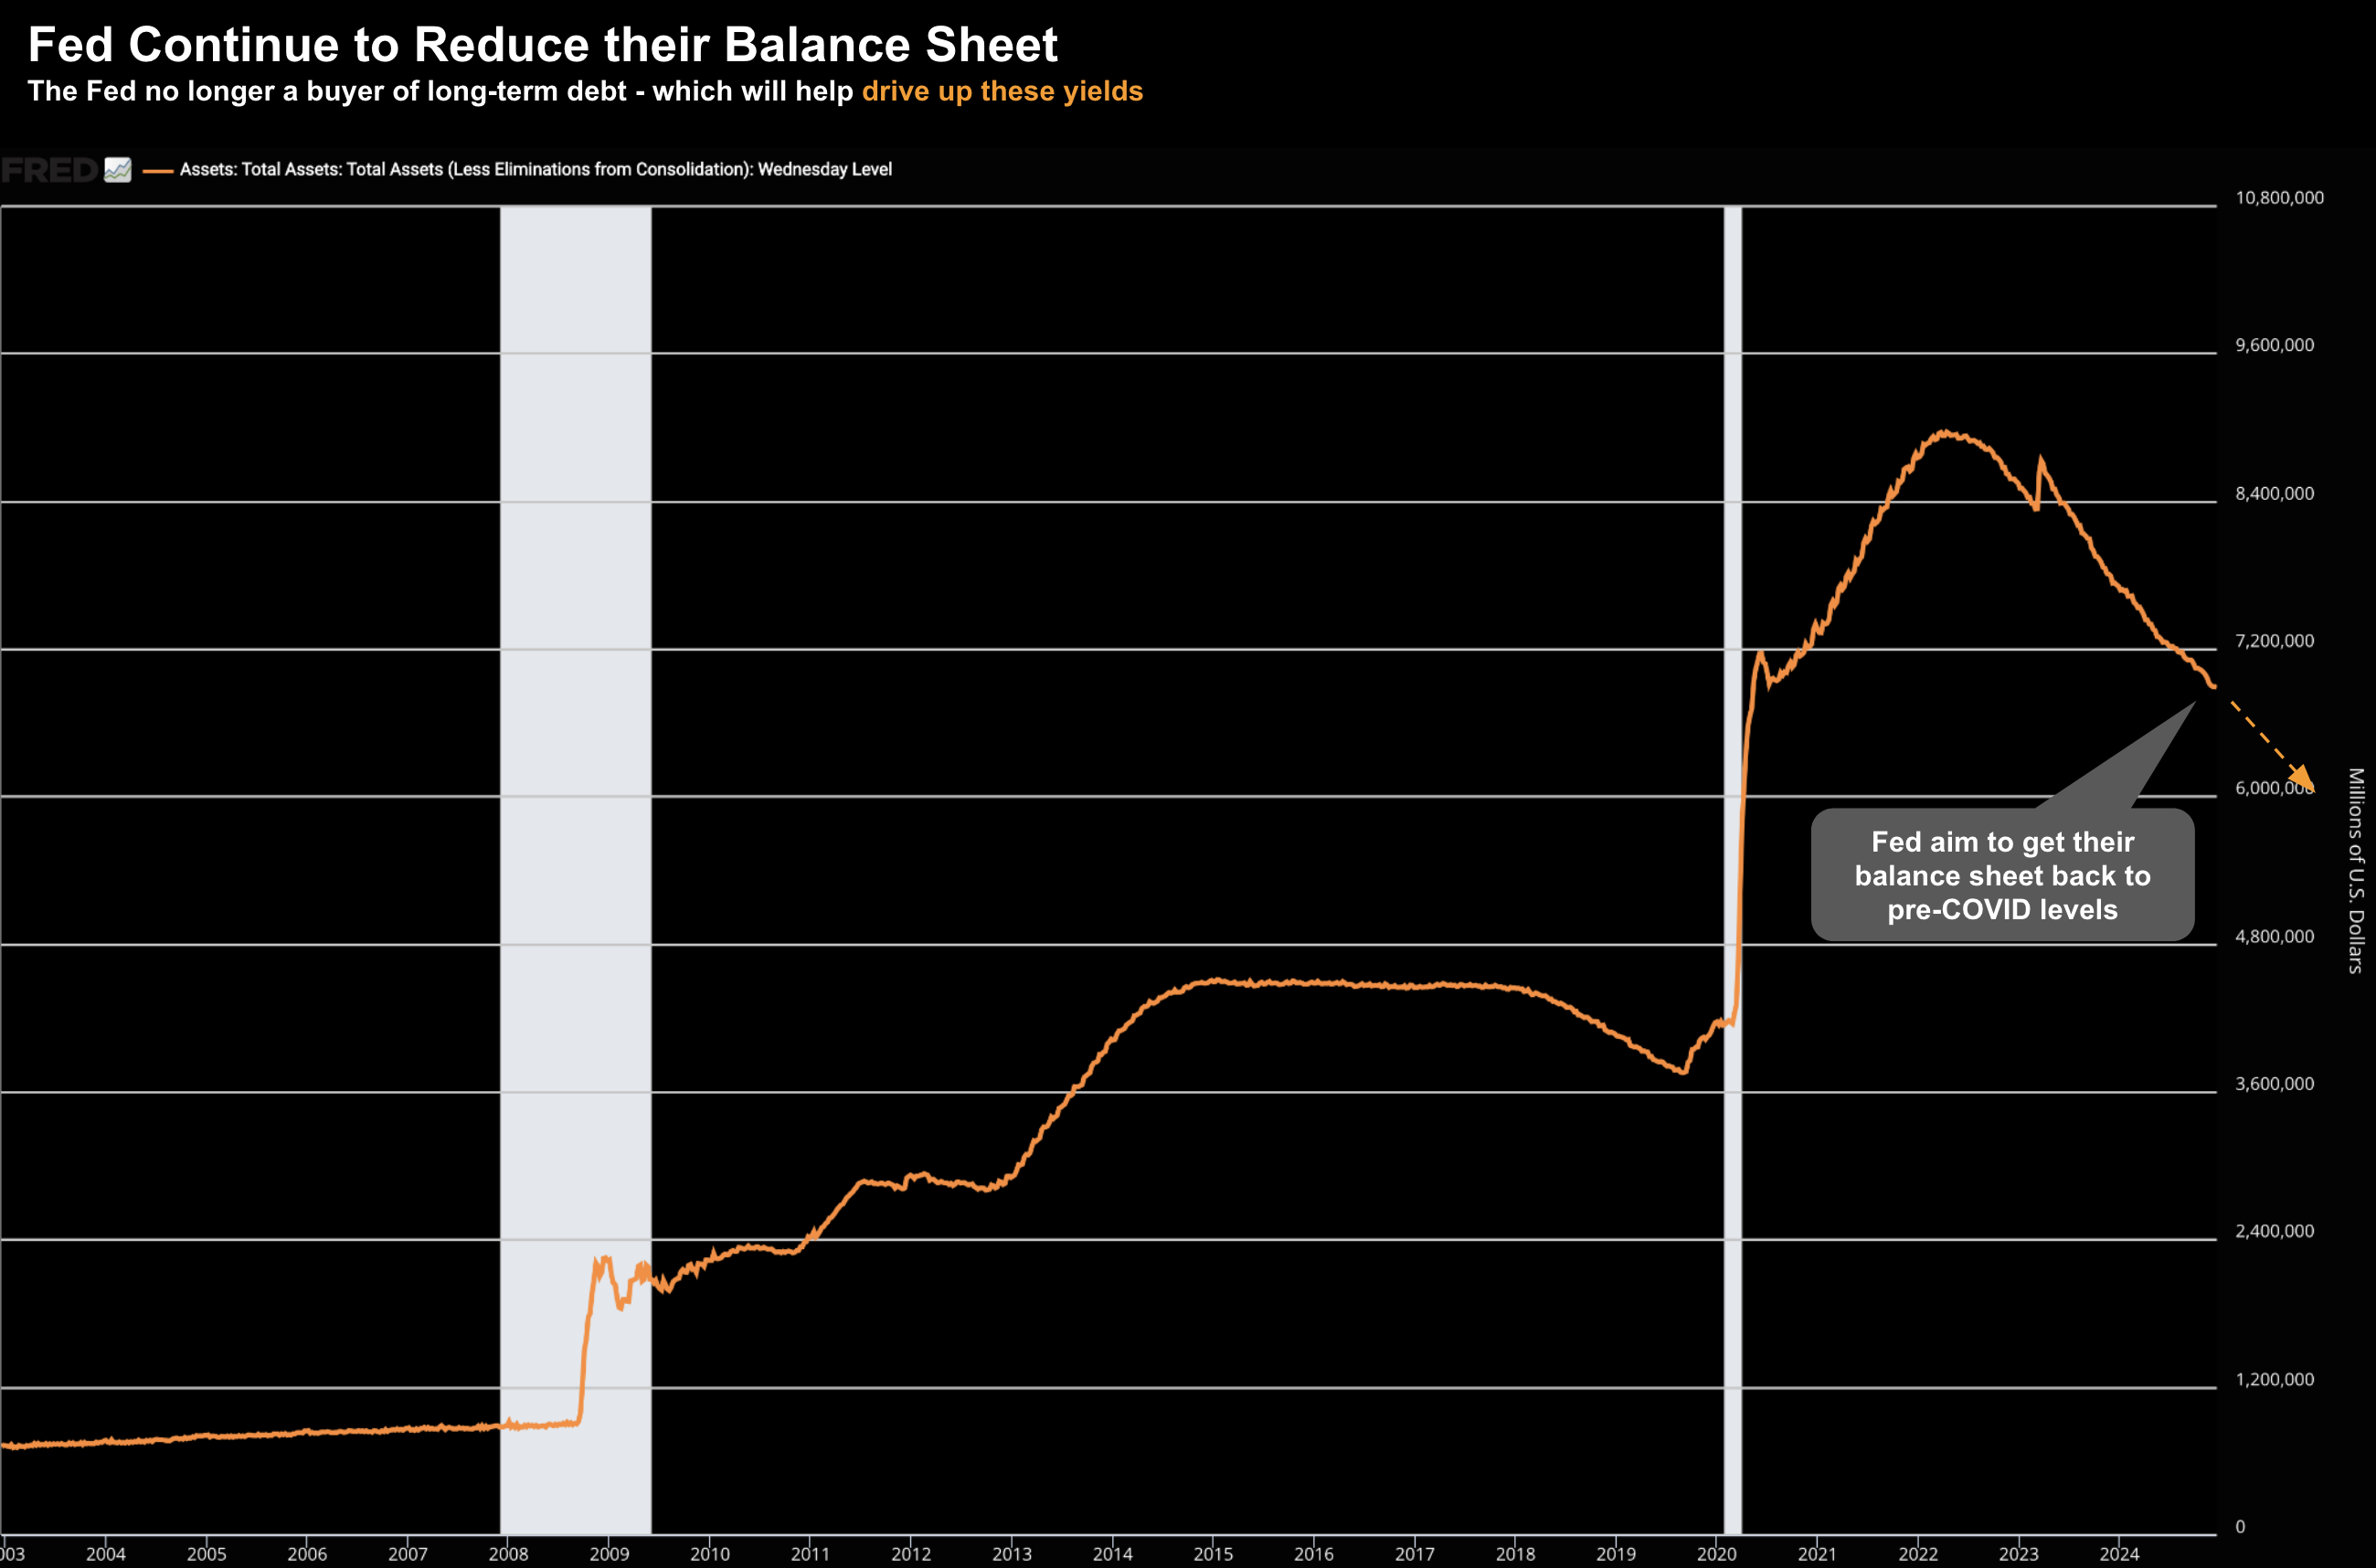
For example, Powell has emphasized that it is still the Fed’s goal to lower the overall amount of Treasury debt and mortgage-backed securities it holds (i.e. reducing their balance sheet)
They want to get their portfolio back to an historically more normal level.
This gradual reduction in the Fed’s balance sheet could also push yields on longer-term Treasury bonds higher since the market will have to soak up more of Washington’s debt, and investors may demand a higher yield to do so (as we are seeing)
December 24 2024
But I think the real pressure in yields isn’t coming from (severe) inflation risks….
It’s what we see with fiscal deficits and debts.
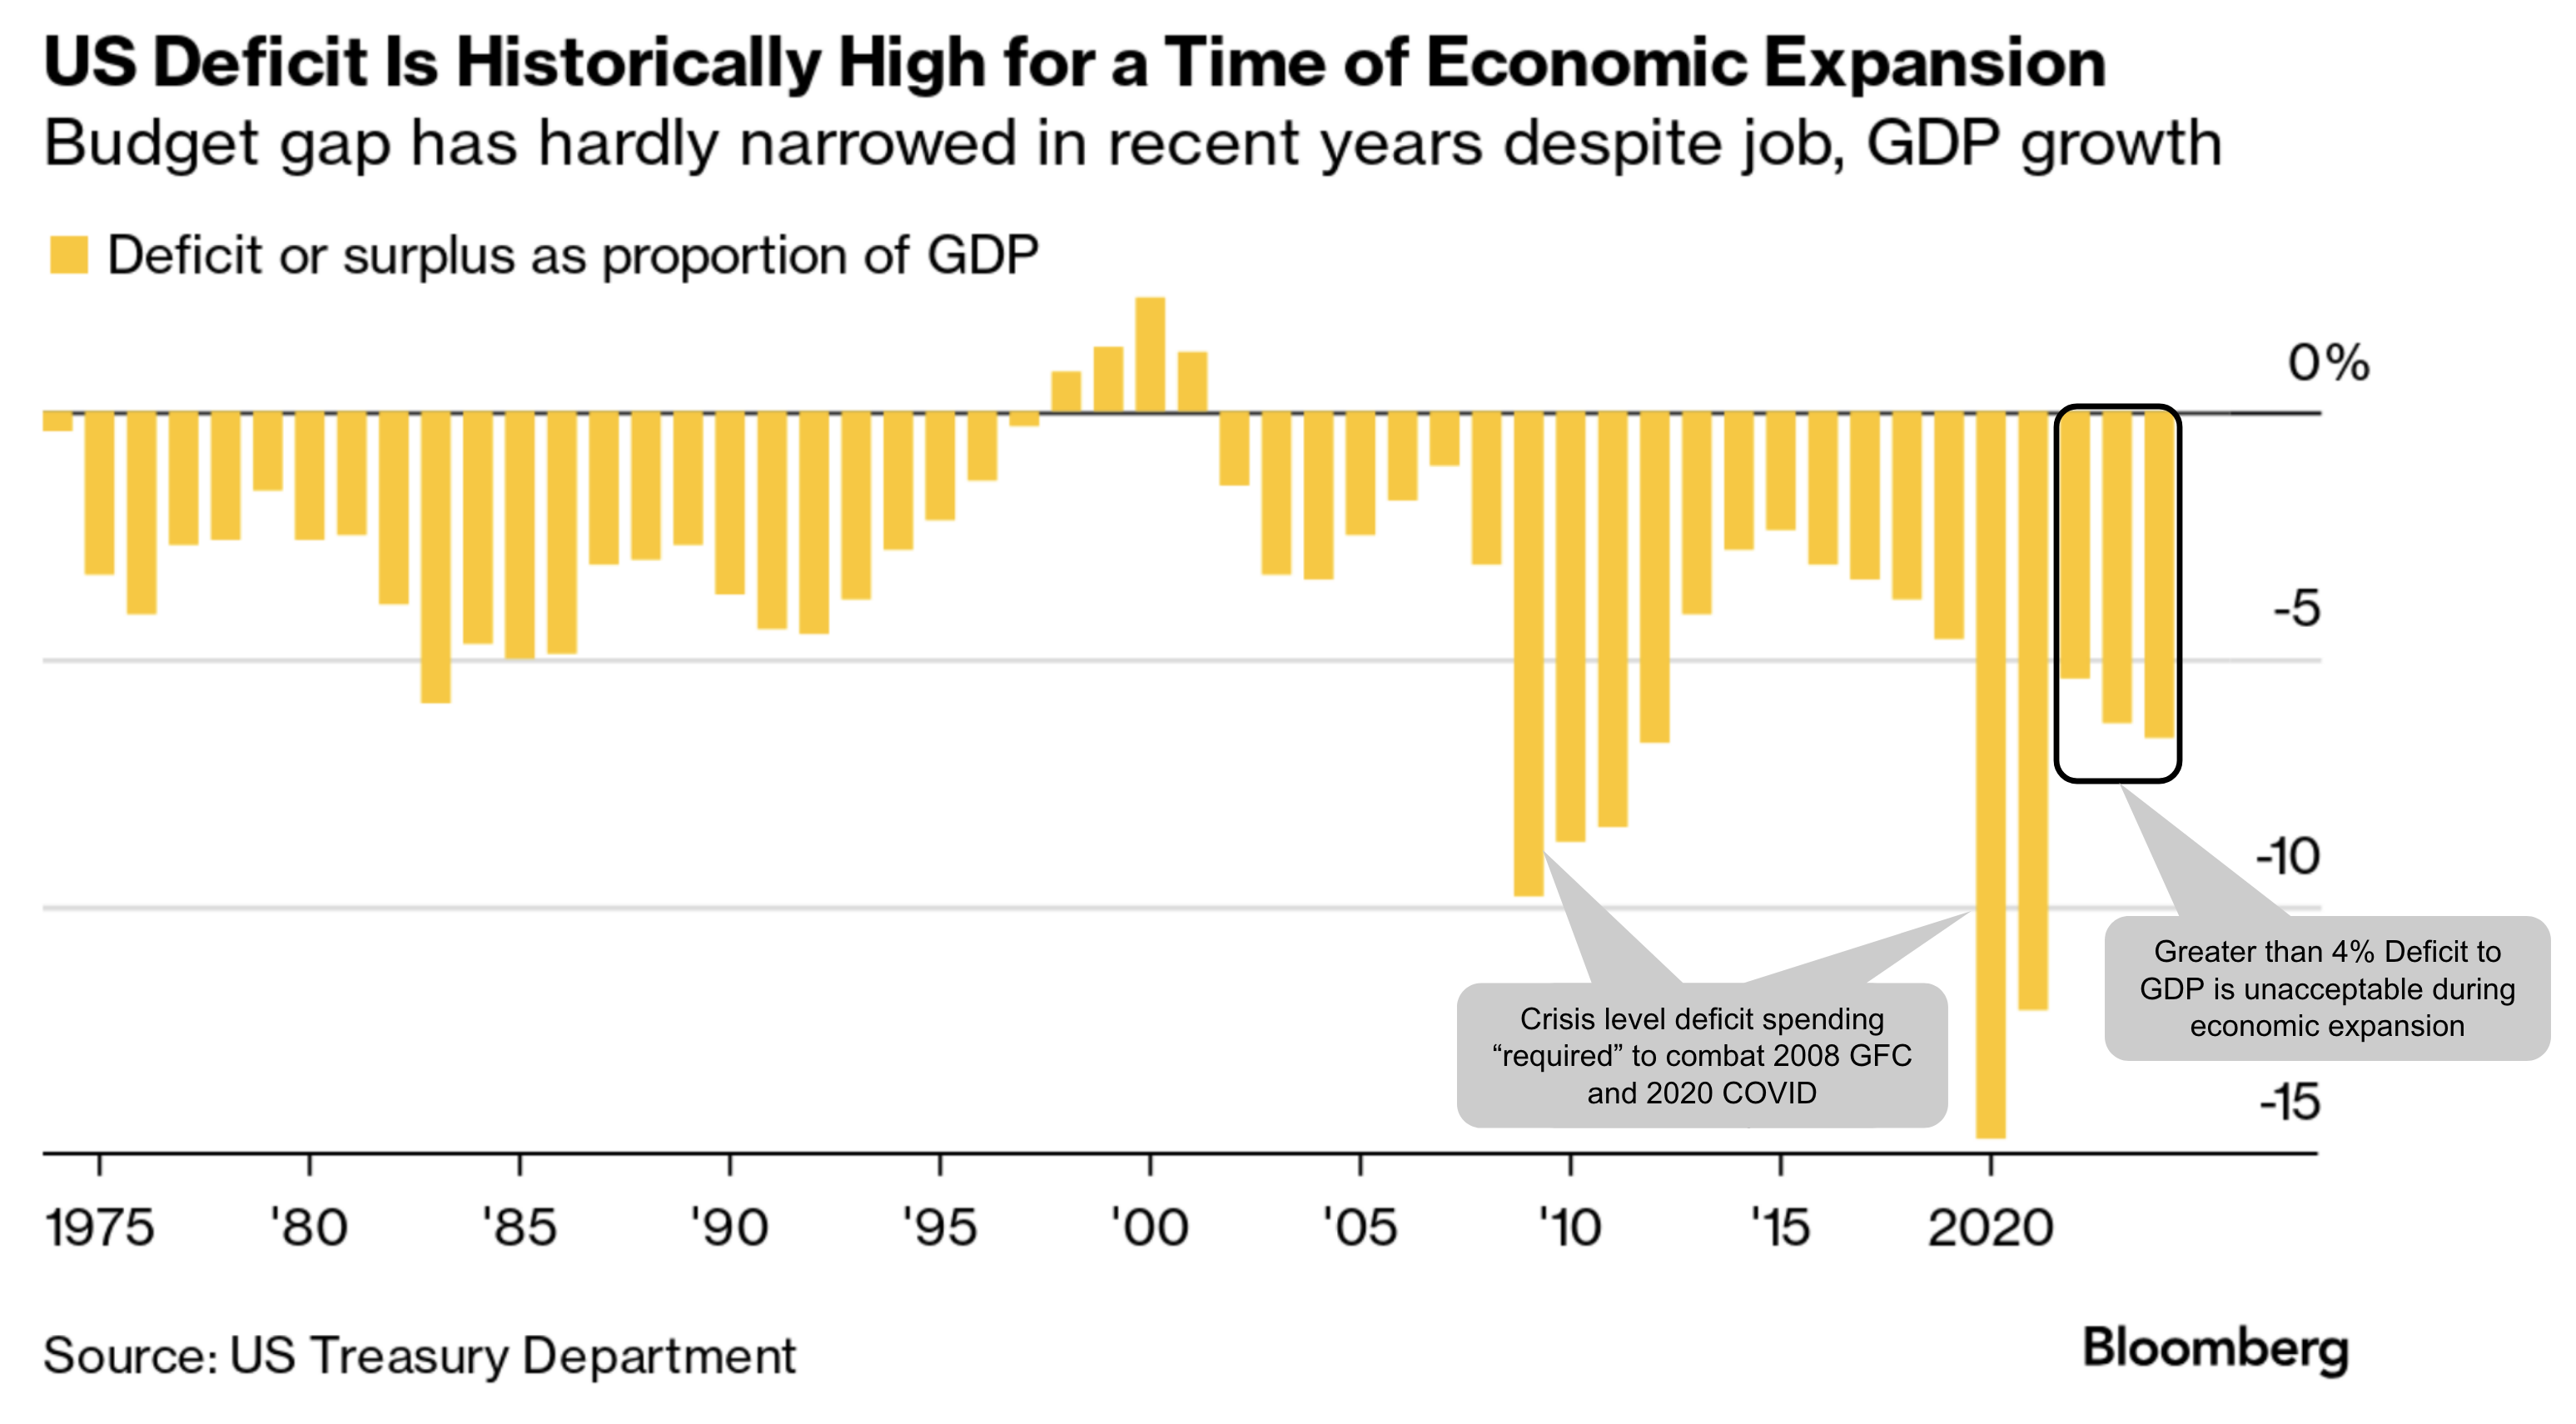
For example, the Congressional Budget Office has estimated federal deficits will average 6% of GDP over the next 10 years under existing tax and spending laws (which are likely to change)
Further to a chart I shared a couple of months ago – this is troubling.
A 6% deficit to GDP is more akin to a war-time or financial crisis scenario – not when an economy is growing.
However, if we do see an extension of the 2017 Tax Cuts and Jobs Act, this could exasperate these risks (especially inflation).
Note: let’s make a point to revisit this chart in ~2 years…
From mine, this is why we should expect long-term interest rates to stay elevated for an extended period of time.
As I wrote the other day – say farewell to the 20-year cheap money era – it’s done.
Equities Not Bothered…
Whilst bond markets are showing signs of caution – it’s another story for equities.
Fear of missing out is the theme of the day – as investors are willing to pay almost any multiple.
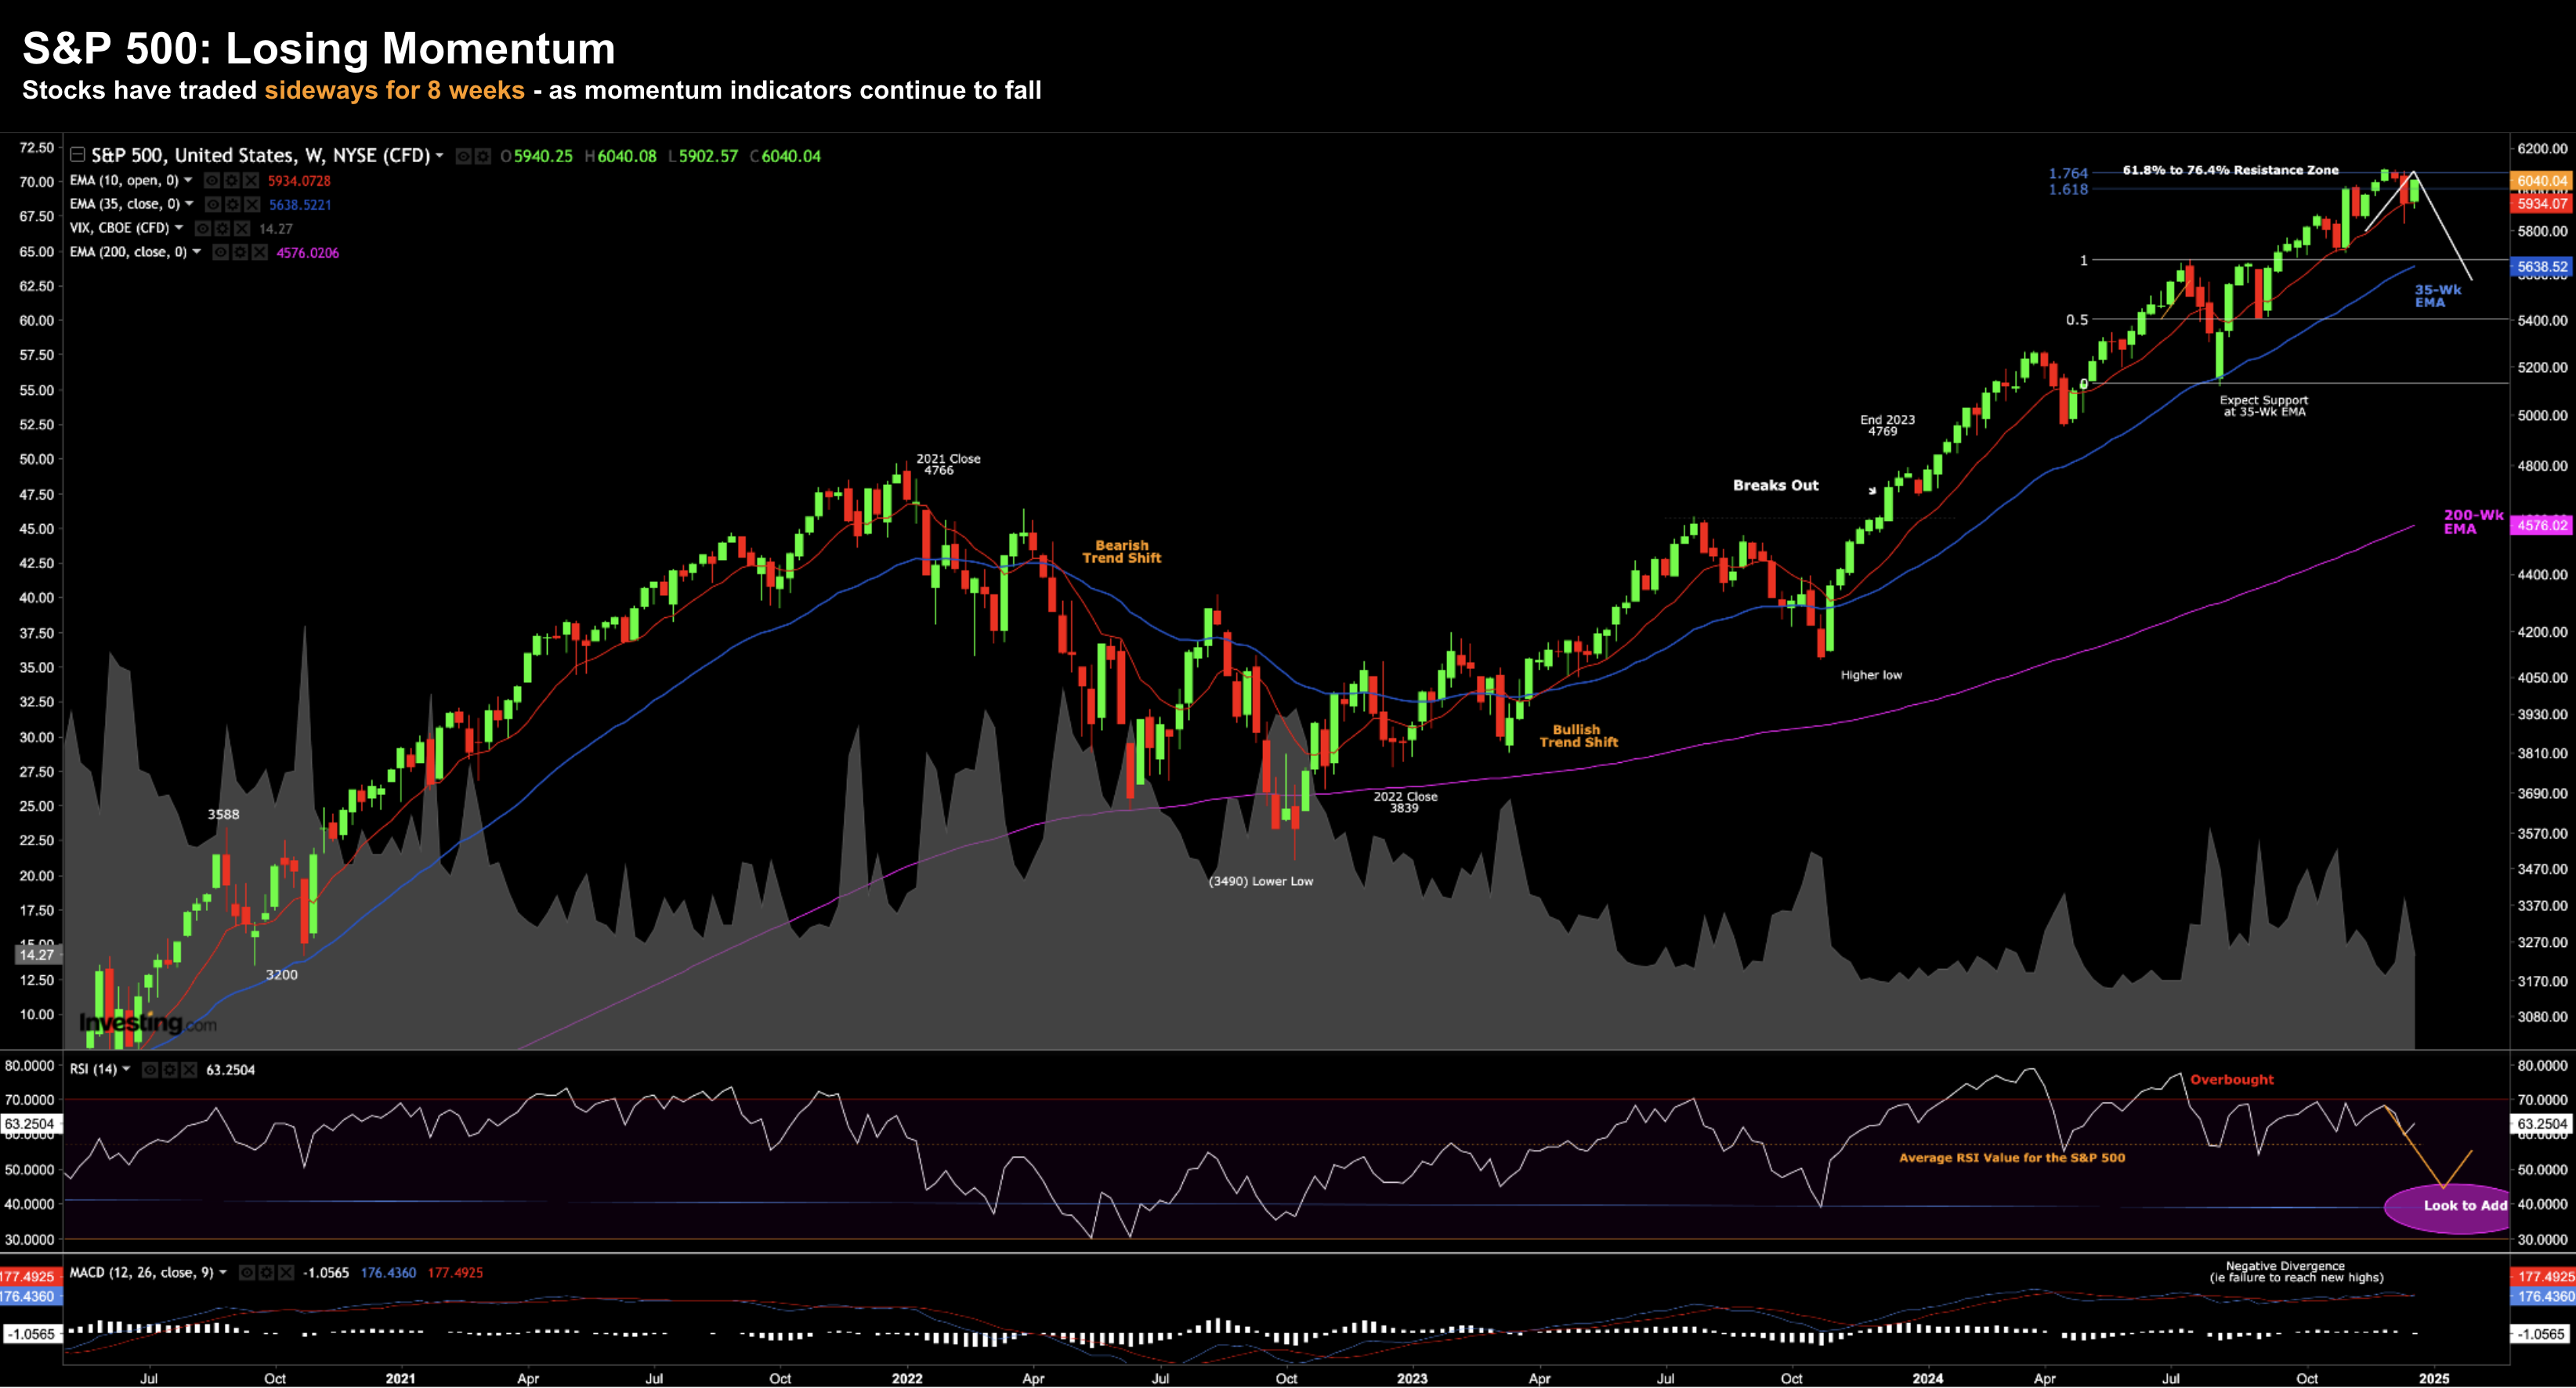
On this shortened trading day before Christmas – stocks caught another bid – however have traded sideways for ~8 weeks:
December 24 2024
The resistance area I flagged after the August pullback remains intact.
Stocks are struggling to push through this zone – trading at a forward multiple of ~22x.
Now, in the face of rising 10-year yields (which could challenge 5.0% next year) – it gets harder to justify the lack of equity risk premium.
Before I close, something else I’m watching…
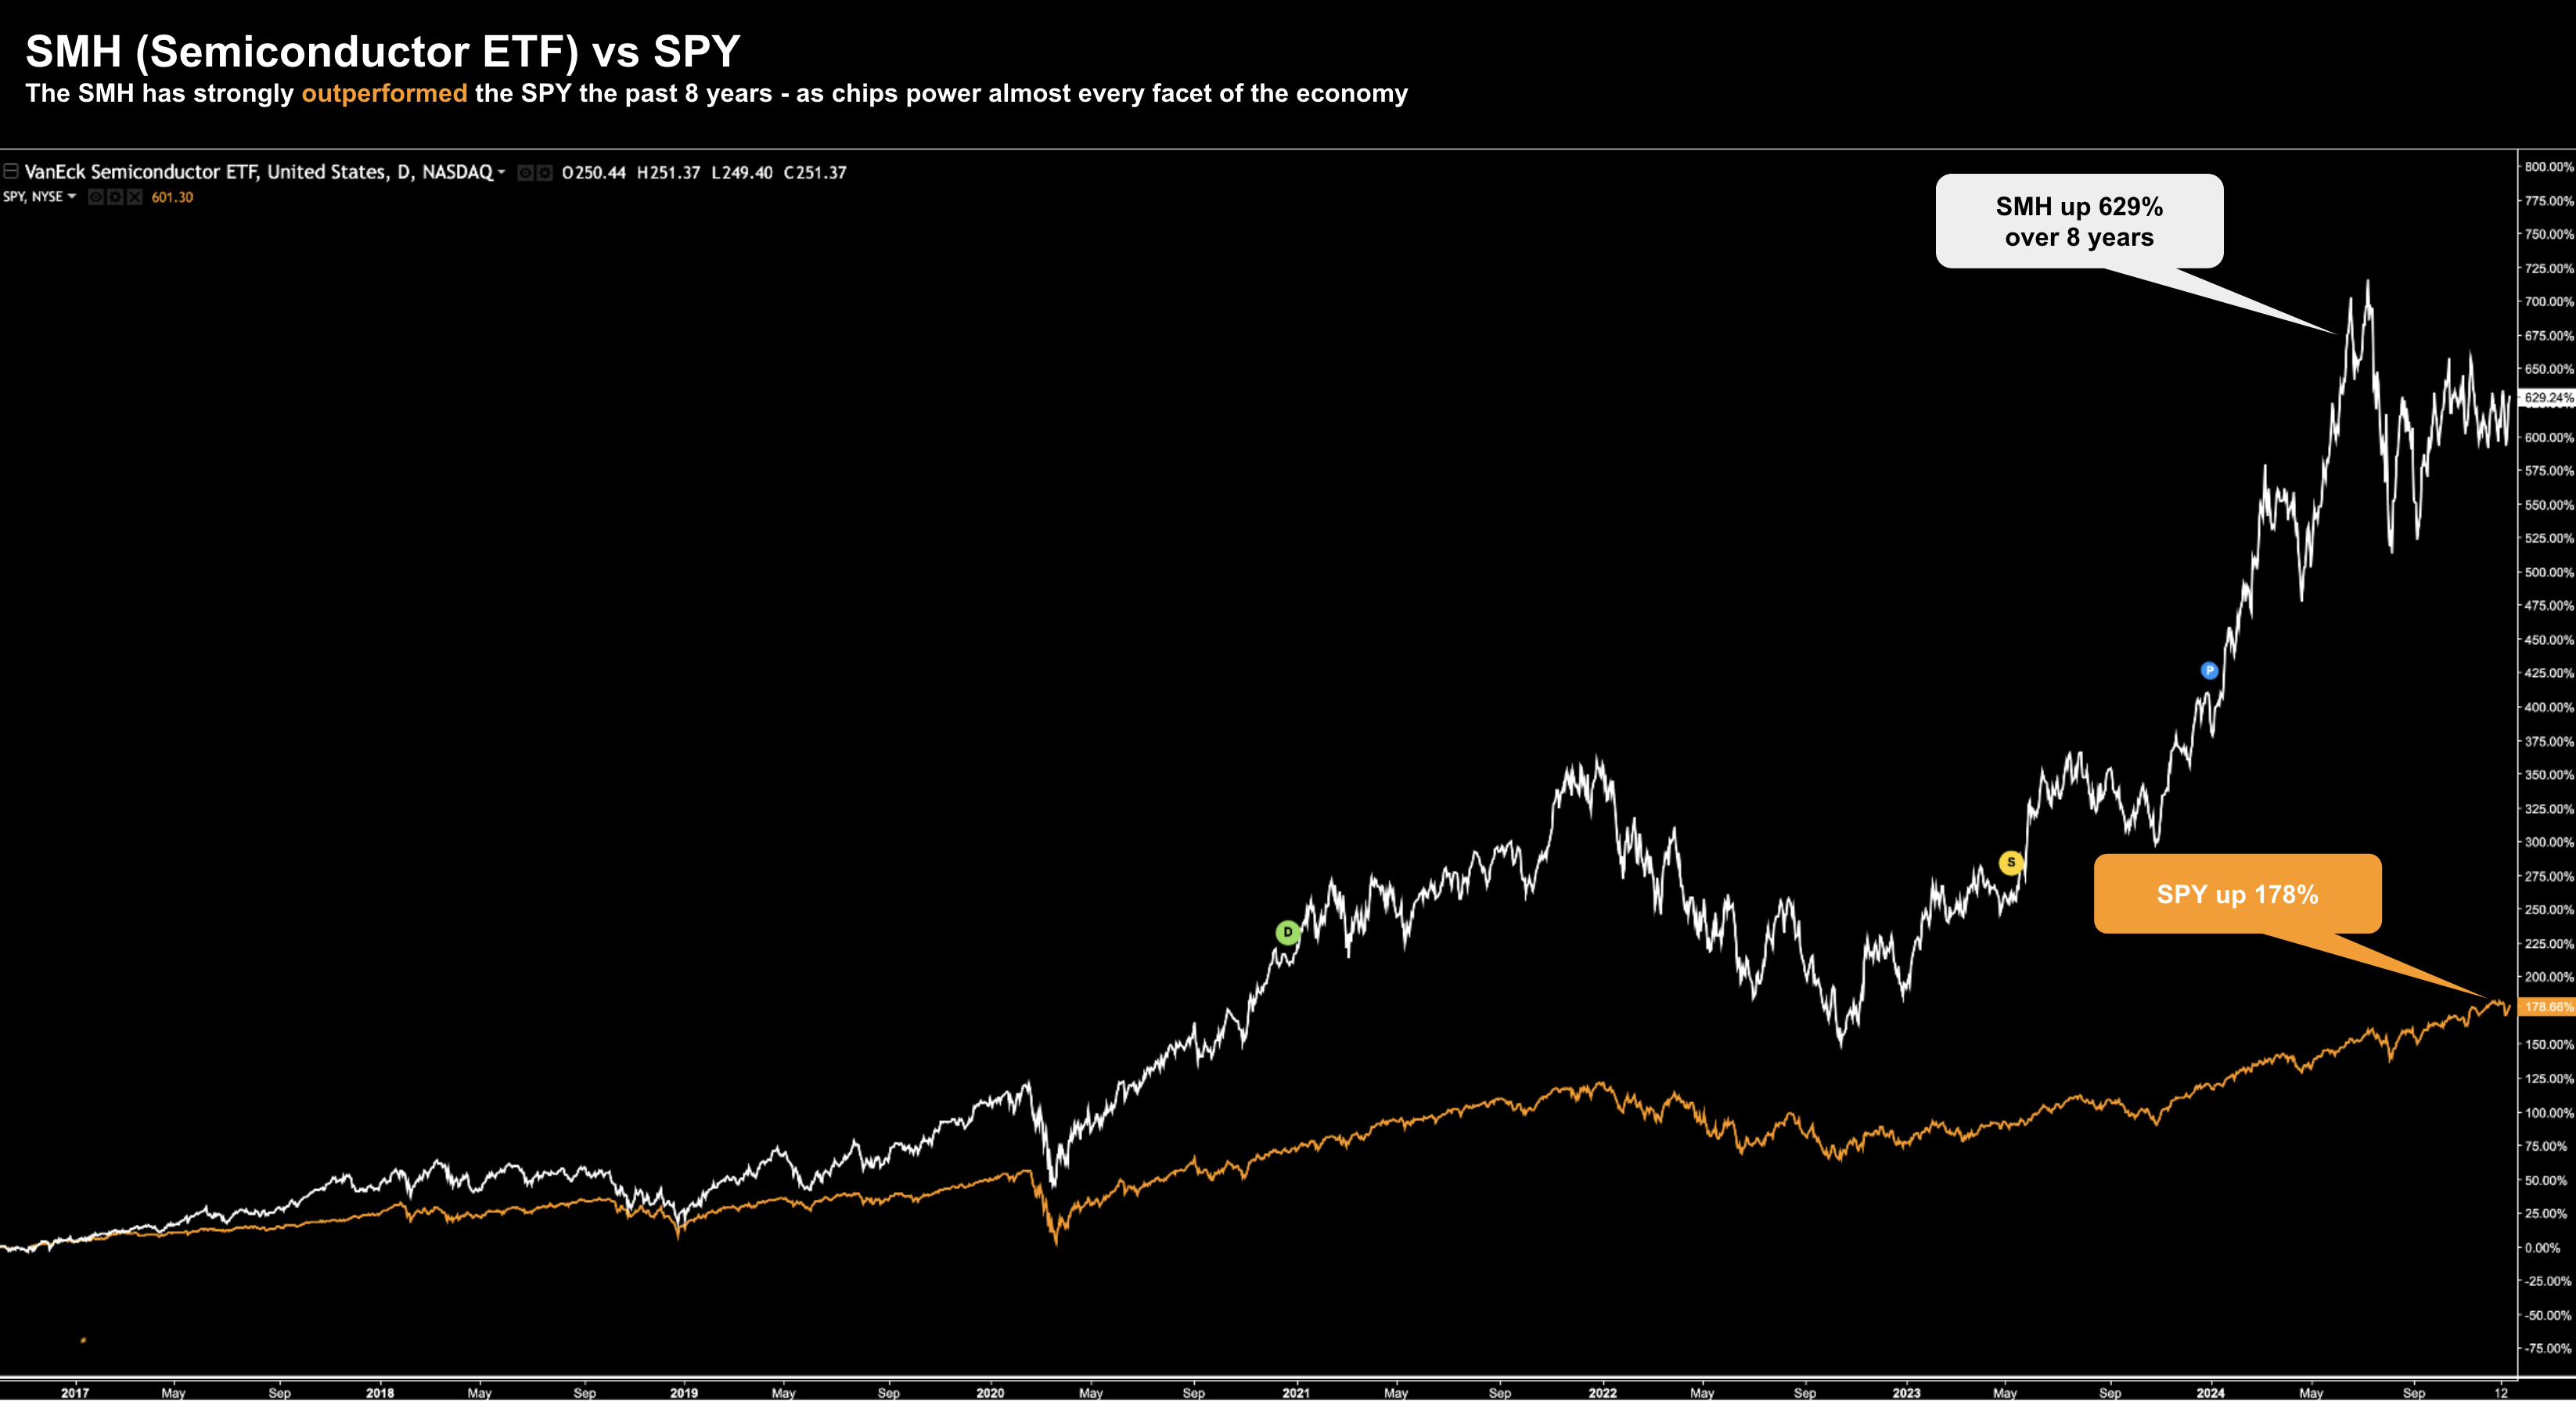
Take a look at the 8-year performance of the SMH (Semiconductor ETF) vs the SPY:
This chart should not be surprising – as semiconductors are part of almost everything we do.
Your house, your car, your electronic devices etc are all enabled by chips.
From mine, chips are a great proxy in terms of what we see with economic growth (not unlike oil).
Therefore, if semis are bullish – it’s generally a sign the economy is in good shape.
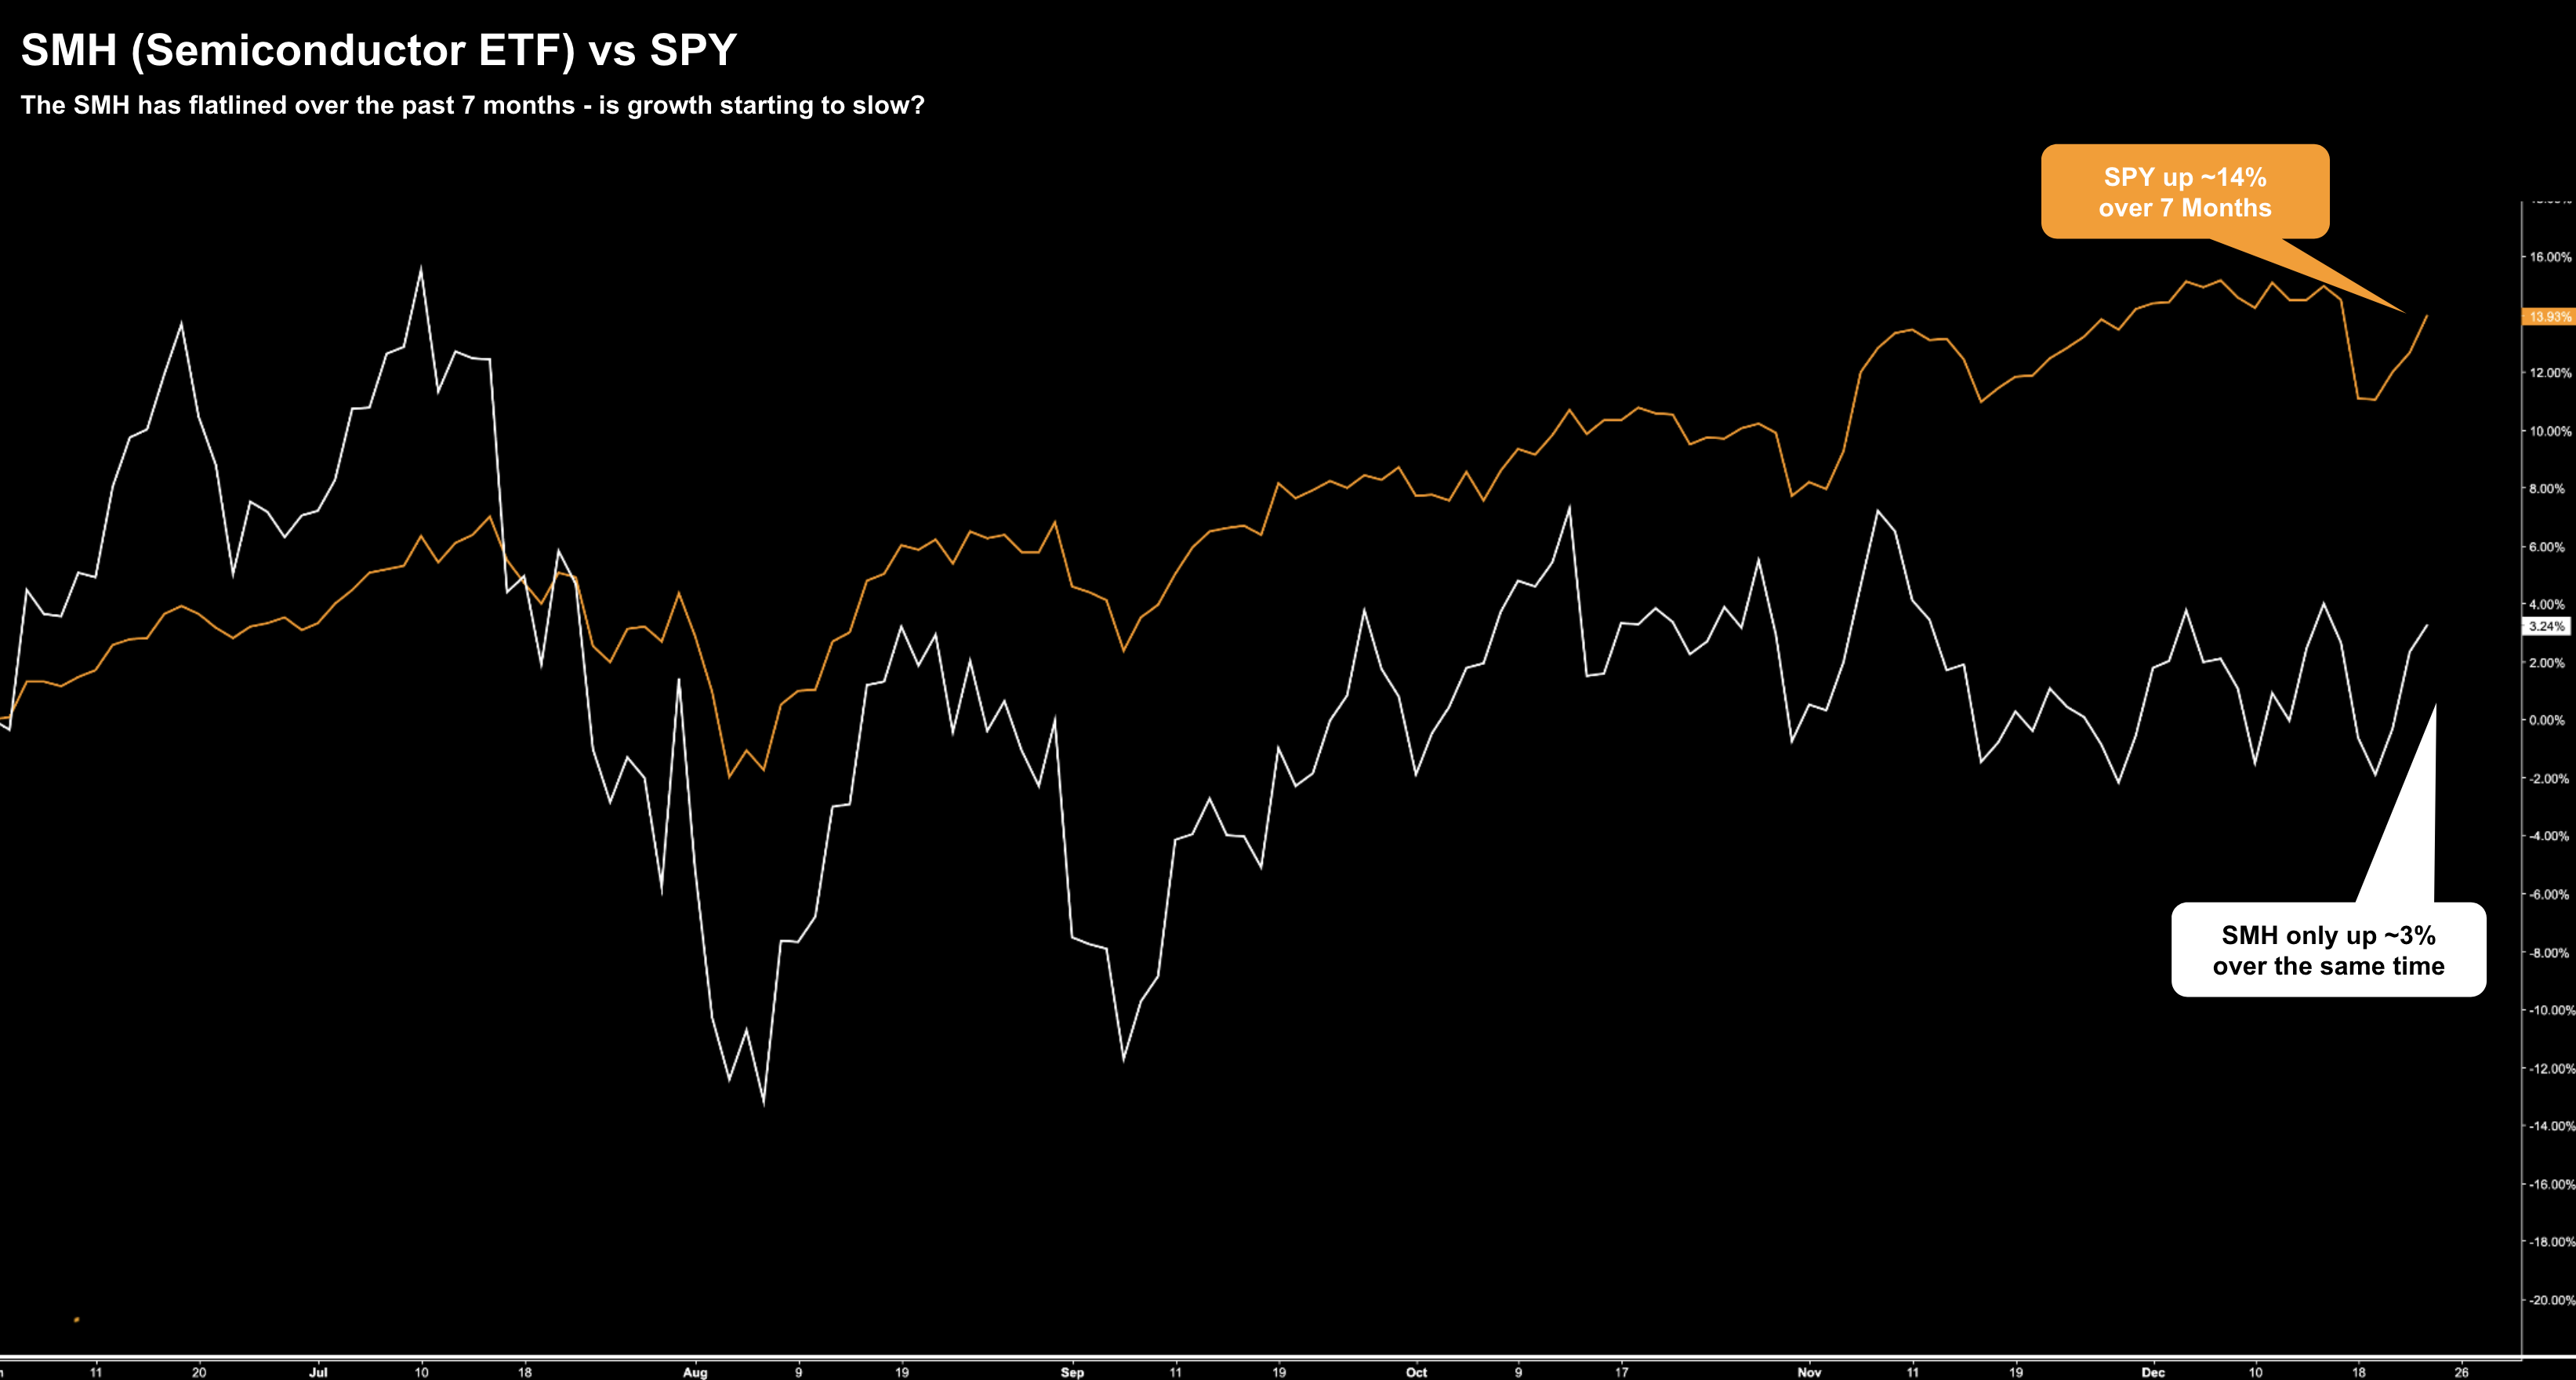
But now we shift our gaze to the past ~7 months – where semiconductor stocks have lost all momentum:
For now, this is simply something I am keeping an eye on.
For example, it doesn’t mean that markets cannot rally without the participation of semiconductor stocks.
They can…
However, their lack of momentum is telling us something.
For example, could it be we have seen a lot of “pull forward” demand this year? I don’t know…
Putting it All Together
For example, if we consider:
- Monetary and fiscal policy risks
- Introduction of tariffs and price increases
- Geopolitical risks as global central banks navigate U.S. policy
- A stronger US dollar with a rising 10-year treasury yield
- Ongoing debt and deficits concerns
- The risk of stubborn inflation (as PPI increase); and
- A weakening employment picture
… all of these present a complex web of related variables.
And yet despite the Fed providing its “dot plot” of economic projections — their historical inaccuracy diminishes their value.
In any case, the Federal Reserve’s recent 0.25% rate cut to 4.50% reflects its cautious approach, avoiding market surprises.
Powell boxed himself into a corner in this instance. He emphasized normalization in inflation, nearing the 2.0% target, and labor markets, with modest unemployment increases.
However, economic indicators send mixed signals.
For example, inflation rebounded after earlier declines – with CPI rising to 2.7% and PPI signaling future (possible) increases.
And with respect to the Fed’s other mandate – November’s payroll data showed 227,000 new jobs — while the household survey revealed a 355,000 job loss.
Regardless, private sector employment remains subdued – where the government remains the largest sector to add jobs.
Will we see a “bigger government” in 2025?
Let’s hope not…. that will add to the deficit.
Ongoing 6-7% deficits-to-GDP is not something we can afford.
However, bring this back to ~4% of GDP (i.e., what we had in 2019) and 10-year yields will respond in kind.
Borrowing rates will come down.
Don’t be too complacent with equities near all-time highs.


