- An Index trade capitalizing on a very high VIX
- Unpacking the 10% Index correction – more to go or time to buy?
- Japanese Yen: Carry in and carry out (on a stretcher)
Wall Street is driven by just two emotions: fear and greed.
Pending on the degree to which you succumb to these emotions – it will have a profound impact on your bottom line.
For example, all too often investors do two things:
- buy when there is market greed; and
- sell when there is fear
It’s the opposite of what you should do (I will include an example of this in my conclusion – where I capitalized on fear)
This is something you need to master if you are to be successful in the game of asset speculation.
Consider this year:
With the market up ~35% since October 2023 – the S&P 500 traded a forward PE of 22x.
Greed was rife.
Fundamentals gave way to momentum trading as the market notched new record highs on a daily basis.
But within the space of a couple of weeks – greed turned to fear.
The S&P 500 corrected almost 10%; the Nasdaq 100 shed 16% in the space of ~4 weeks – with large cap tech falling hard (more on maybe why shortly)
Former market darling – Nvidia – which boasted a forward PE close to 50x – fell from $140.76 to trade as low as $92.08 today.
The Mag 7 shed ~$700B in market cap today – and over $3 Trillion since July 10.
The VIX hit an intra-day level of 60 – a level we have not seen since the pandemic (note: see my post from March 2022 where I make the case for buying peak fear)
Tonight’s missive will try and unpack some of what is going on.
For example, there is both a technical and fundamental elements at play. And if I was to lean one way, I would suggest it’s more technical.
Let’s start with the ~10% correction — followed by thoughts on possible catalysts (and what I’m watching for signs of further deterioration)
Unpacking the ~10% Correction
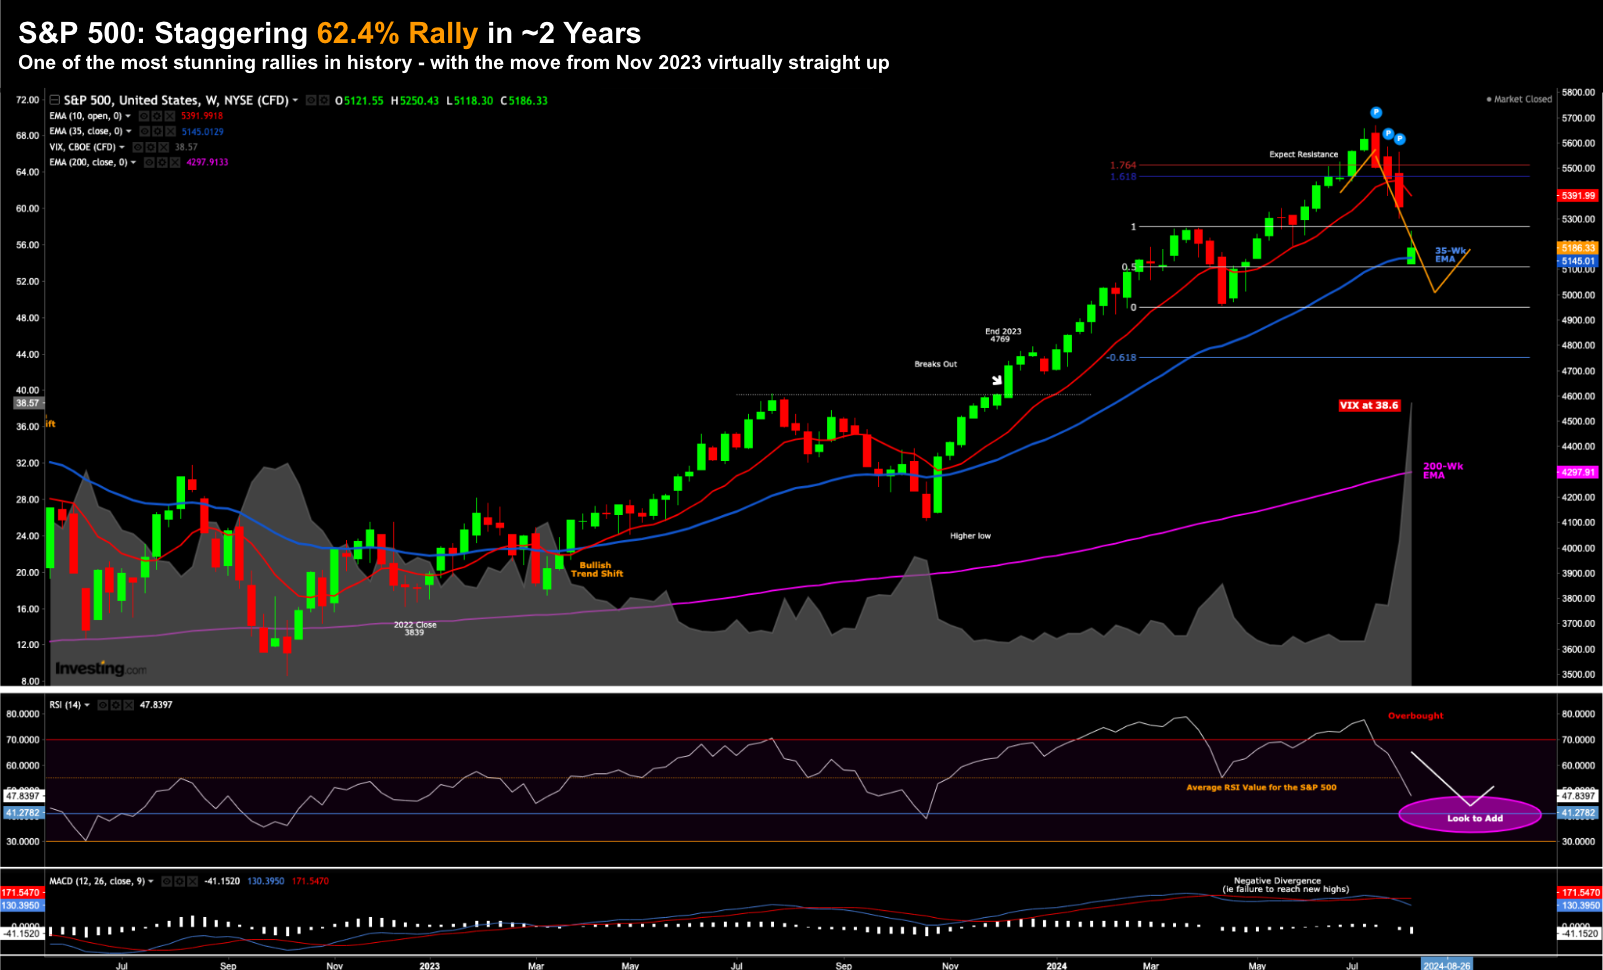
The very first thing we should do is recognize just how far (and how fast) we have come in less than two years.
This is why I say this is more technical than anything else.
For example, people will reach out to me and say “wow Adrian – what do you think about the shear chaos in markets!”
And I say to them “yeah – crazy the market is also up 62% in less than 2 years. So is 10% really a big deal?”
Perspective helps
But that part is conveniently forgotten… but it helps explain most (not all) of what is going on.
It’s a useful trading concept known as mean reversion…
Aug 4 2024
From the October 2022 lows – the S&P 500 rallied 62.4% to its peak.
The rally from October 2023 was ~35%
As I’ve warned often the past few months – moves like this are not sustainable.
It’s a momentum trade – carried by a few stocks.
Now students of history will know the average annual return for the S&P 500 (inclusive of dividends) is ~10.5% per year.
Therefore, applying the theory of mean reversion tells you the rubber band was stretched a long way.
At some point – it’s going to snap.
My forecast was the S&P 500 could easily pullback to the 35-week EMA zone (blue line) – a gravitational pull.
As luck would have it (not skill) – we opened just below the 35-week EMA today – before closing slightly above it.
But technically this is a very healthy development.
It’s not a crisis. It’s not a bear market.
For now, it’s nothing more than a standard market correction which was overdue.
Could it go further?
Absolutely it could!
And I think it does but it won’t happen in a straight line.
We will most likely rally for a few days from there before gearing up for another leg lower.
That’s possible.
But I will outline the Index trade I placed today (at the open) in my conclusion (taking advantage of the VIX)
So that’s “Part 1” of what’s happening – nothing more than mean reversion – technical in nature.
But there are some important catalysts at play… call them “forces” below the surface.
And they’re making some large waves….
I think one of these is the unwinding of the so-called “carry trade”
Carry In and Carry Out
US equities are very much part of global interconnected financial system.
What happens in Europe or Japan can often have a material impact on what happens with US stocks.
For example, we saw this in 2011 with the European Sovereign Debt Crisis.
Markets were in free fall as worries persisted about European debt and the threat of default.
This brings us to events in Japan… and specifically the strength in the Yen.
For those less familiar, the BoJ raised interest rates to levels unseen in 15 years and unveiled a detailed plan to slow its massive bond buying, taking another step towards phasing out a decade of huge stimulus.
The rate hike was the largest since 2007 and came just months after the BoJ ended eight years of negative interest rates as the bank’s chief seeks to dismantle his predecessor’s unorthodox policies.
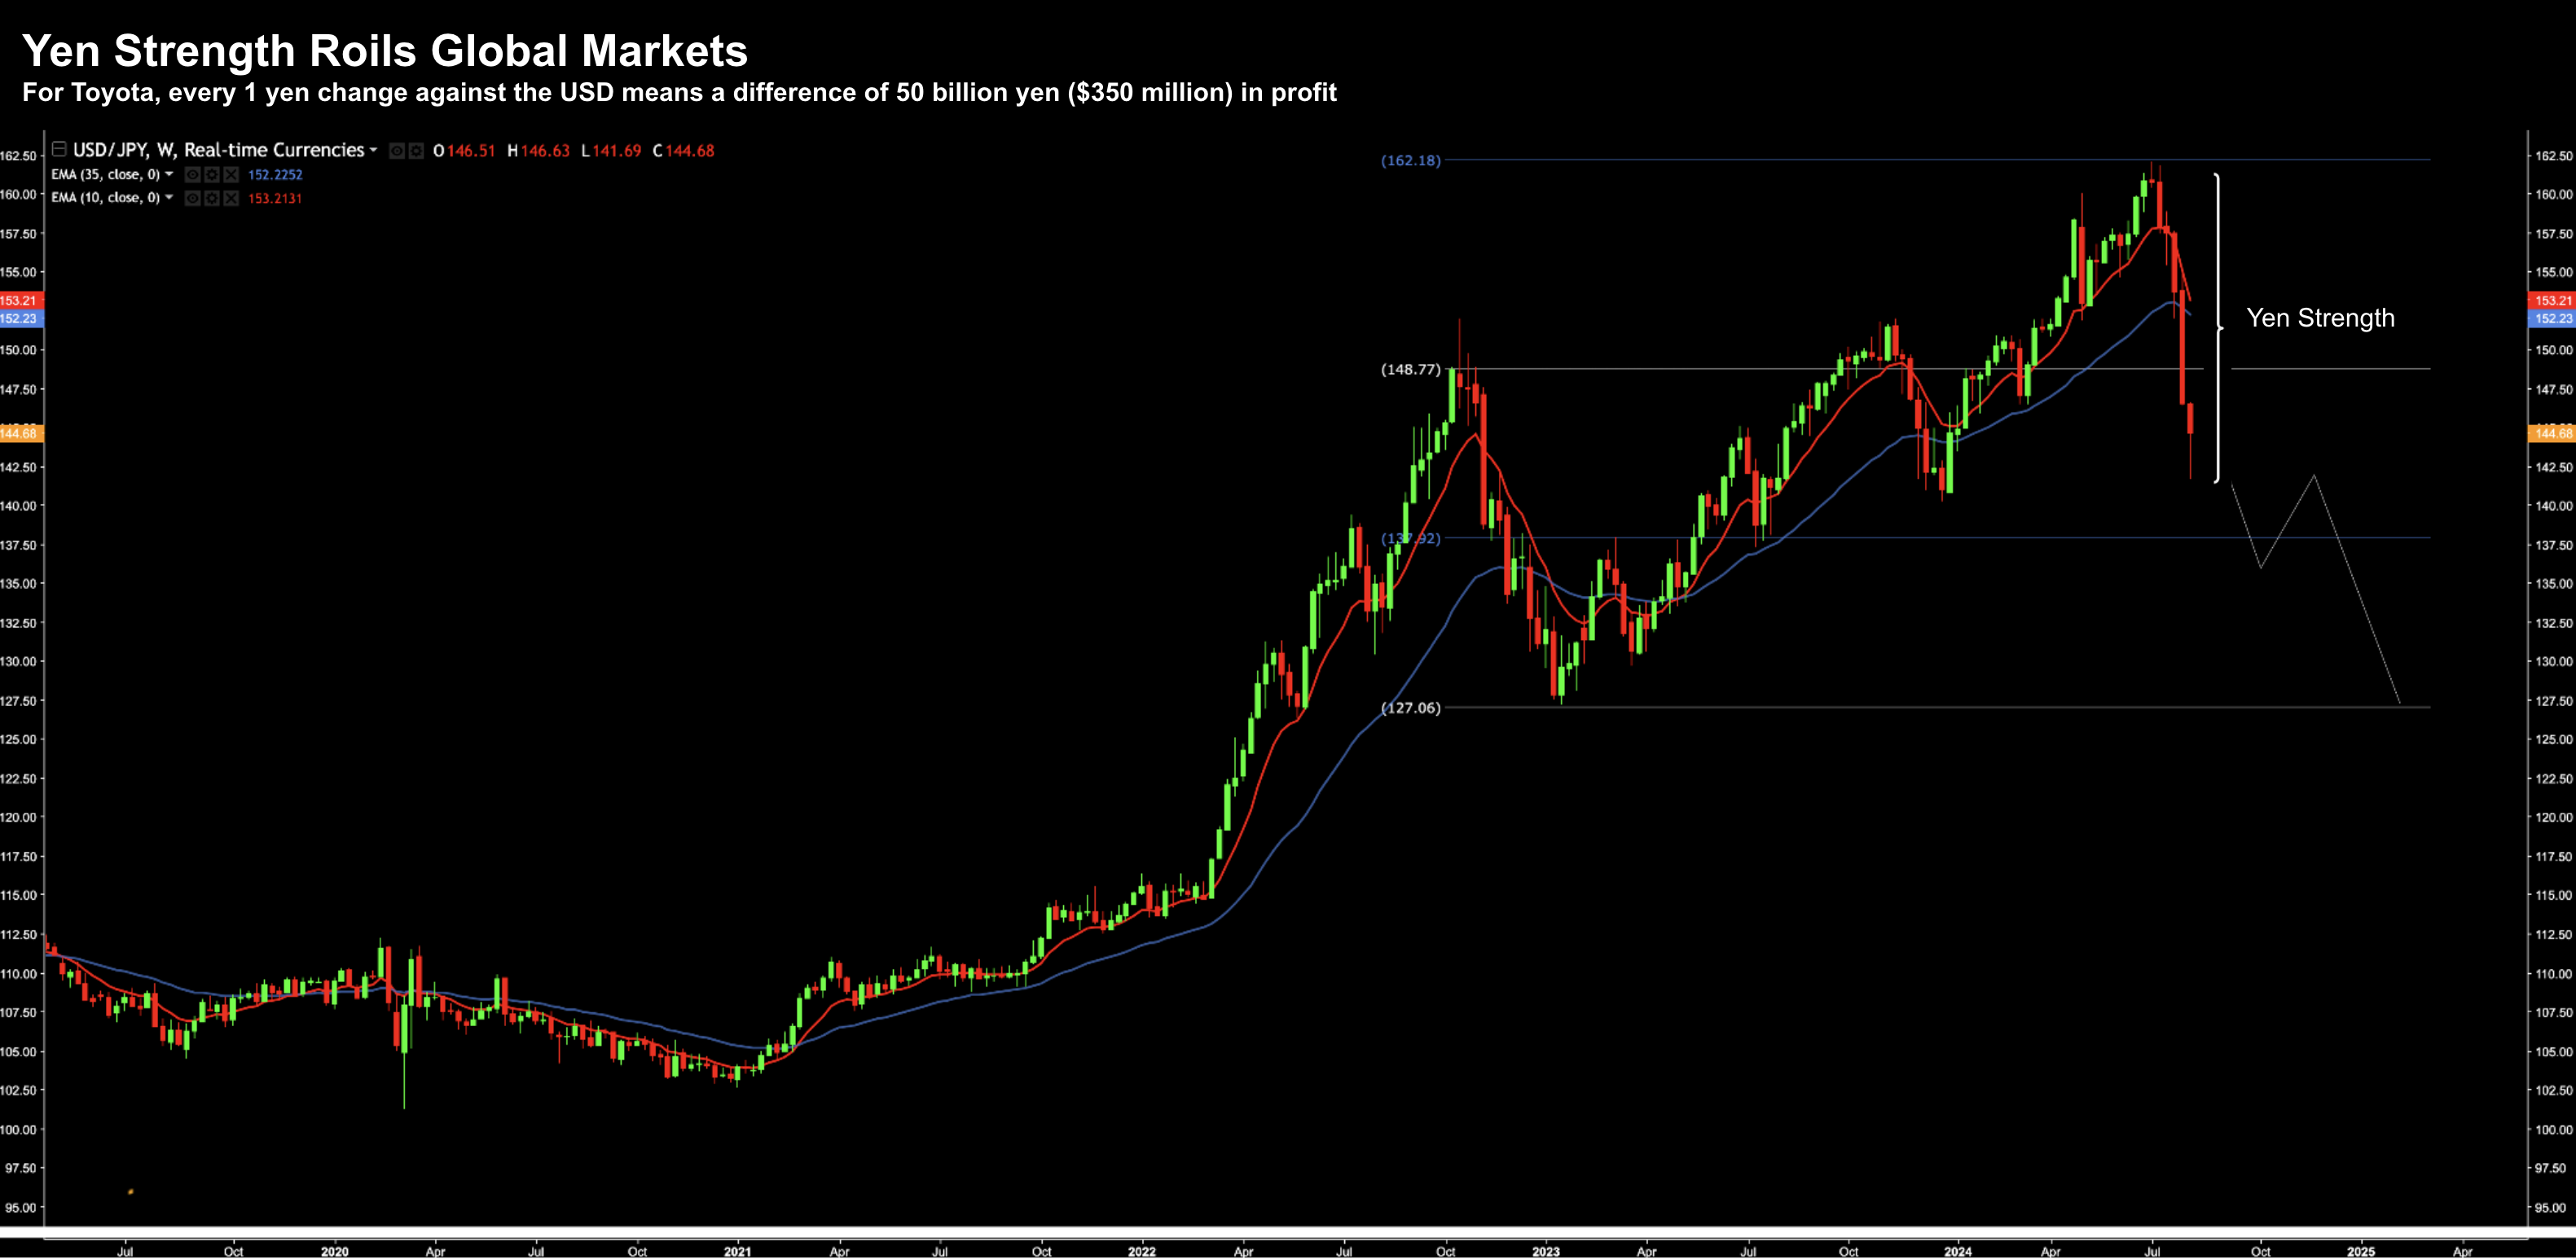
The chart below shows the rapid strengthening in the Yen the past few weeks.
It has plunged from 162 down to just 144 in three weeks – as the BoJ allows its currency to rise
(Note: the lower this goes – the stronger the yen; i.e. quoted as how many Yen to buy $1USD)
And as the chart shows – technically it looks as though it can fall further.
For example at the end of 2022 – it was as strong as 122.
So why does this matter?
Previously, with money extremely cheap from Japan, borrowed money would find a home elsewhere (e.g., higher yielding US Treasuries or US large-cap tech stocks).
It’s known as the “carry trade” – but it could be coming to an end should the Yen continue to strengthen (as the BoJ intend)

A rapid unloading of “carry trades” extended on Monday, with market participants seeking to roll back on the popular strategy amid a dramatic global sell-off in risk assets.
Carry trades refer to operations wherein an investor borrows in a currency with low interest rates, such as the Japanese yen, and reinvests the proceeds in higher-yielding assets elsewhere.
The trading strategy has been hugely popular in recent years.
Traditional safe-haven assets, such as the yen and the Swiss franc, surged on Monday, fueling speculation that some investors were seeking to quickly unload profitable carry trades to cover their losses elsewhere.
“You can’t unwind the biggest carry trade the world has ever seen without breaking a few heads. That is the impression markets give us this morning,” Kit Juckes, chief foreign exchange strategist at Societe Generale, said in a research note published Monday.
I will add to Kit’s comment – you can’t unwind the largest carry trade which has been in play for over a decade in the space of one trading session.
This will take time.
It’s my assumption that many hedge funds piled into the short yen trade – only to then use the proceeds of the short sale to fund leveraged bets on the long side – such as the Magnificent 7.
That trade is now in a world of pain.
Here’s how it works…
When one part of the trade turns against you (e.g., Yen strength) – the pressure builds to bail out of the other side of the trade (e.g., long large-cap tech)
And if one large hedge fund closes out their short yen/long tech trade – it will spark another.
And before long – you get a snowball effect.
And whilst I can’t tell you how many trillions are still attempting to unwind this trade – I have little doubt it’s playing some part in the US market rout.
As the Yen chart shows – there’s nothing which tells me their currency could not continue to strengthen.
This will be something to watch…
Bond Markets Price in a Recession
Whilst equities panicked – the flight to safety continued at scale
The flood into US bonds picked up again today – as traders bid up bond prices.
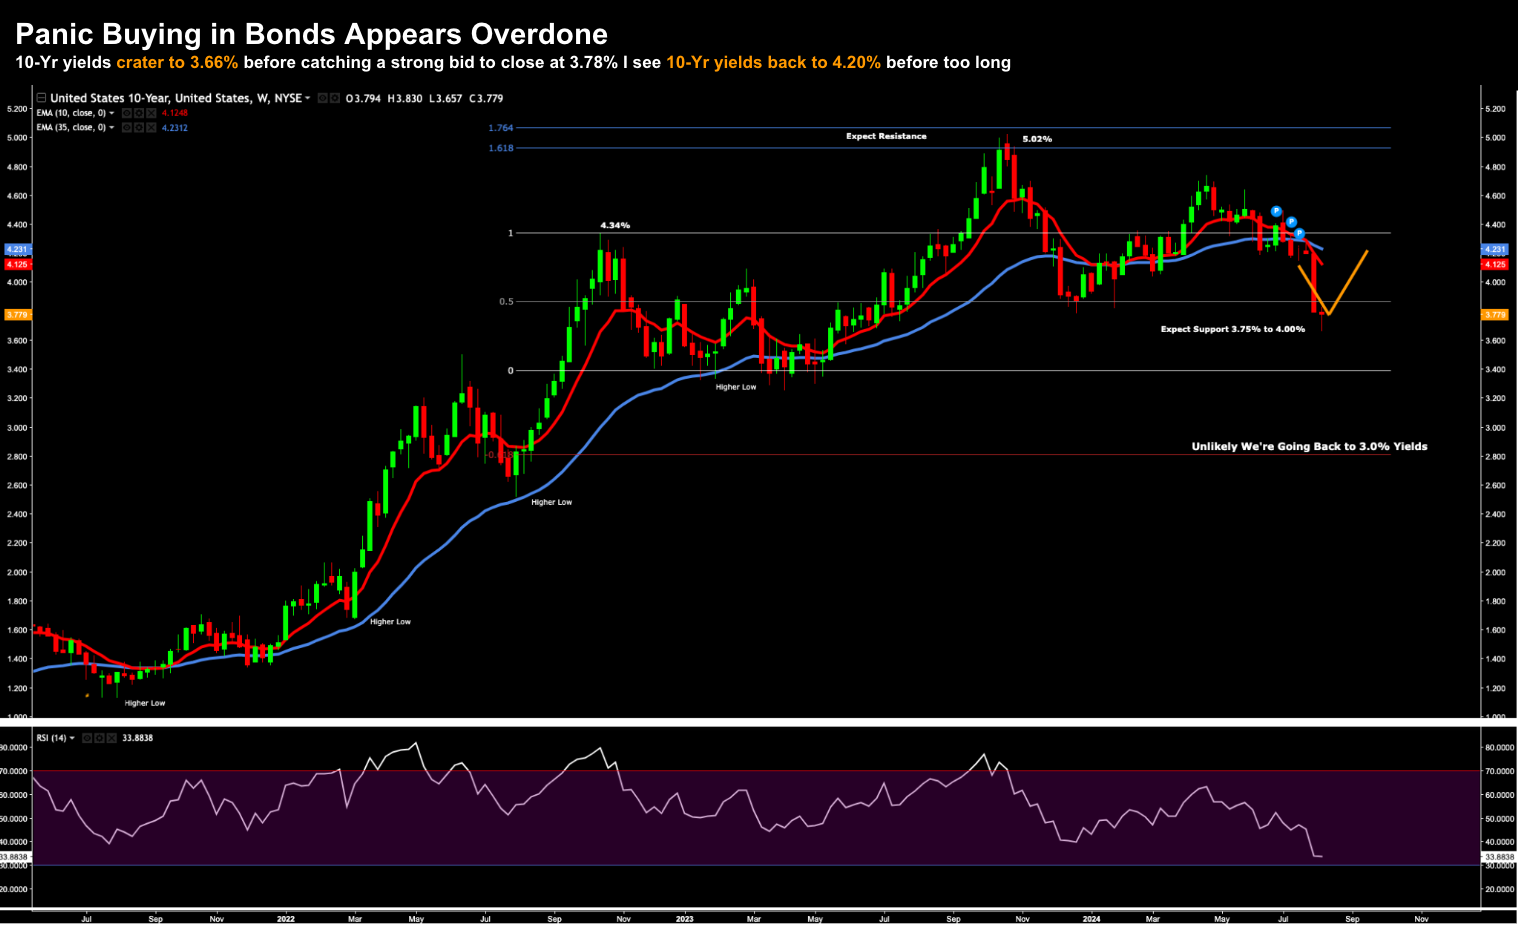
The 10-year yield (below) touched a low of 3.66% – before cooler heads prevailed.
Aug 4 2024
As I explained over the weekend – I think this is an over-reaction.
Given I was long EDV (long bond ETF) – I used the strength to sell half my position and lock in profits.
This trade does well when yields fall (and loses money if yields rise)
I think this is traders pricing in a recession.
And whilst we cannot rule that out (see Sahm’s Rule post) – we’re not there yet.
Looking at the short-term 2-year – a proxy for the Fed funds rate – it traded ~3.89% today.
That’s in the realm of 160 basis points below where the Fed are today (525 to 550 bps).
I could be wrong – but I think the bond market is getting ahead of themselves.
And it’s not unlike what we saw in January.
At the time the market was pricing in 6 rate cuts.
I was not on the same page… they were too aggressive given what we saw with inflation and employment.
Well they are back at it… and I suspect will be wrong again.
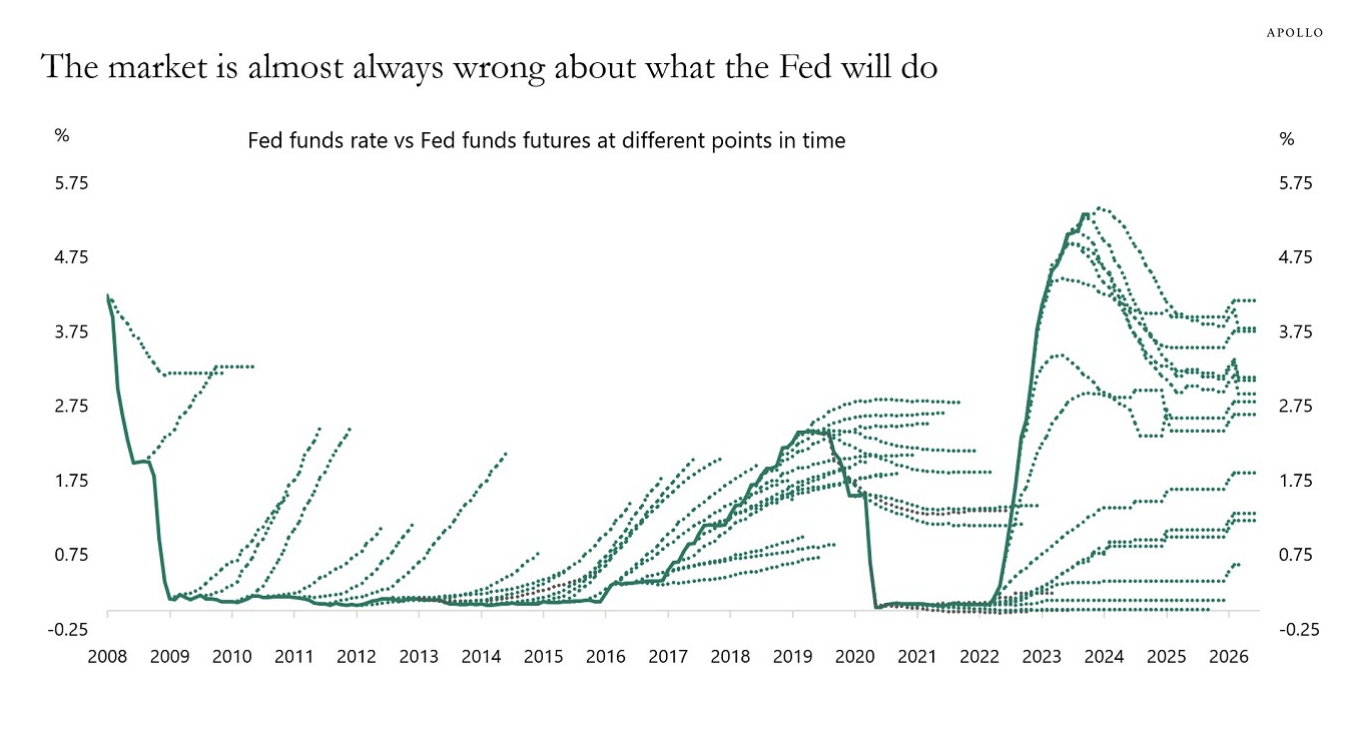
Now take a look at this great chart from Torsten Slok at Apollo when it comes to forecasting what the Fed will do.
Slok’s chart shows how the market is almost always wrong when attempting to forecast Fed policy.
And whilst a 25 bps cut in September looks likely – the market is pricing in a lot more than that.
I doubt the Fed will be overly aggressive… it could actually send the market the wrong signal.
Let me close with two indicators I am watching for further signs of deterioration.
First I will start with spending (using Real PCE); and then I will follow with credit spreads.
Neither are worrying at the time of writing.
Real PCE Looks Fine (For Now)
Real PCE has been a reliable and consistent predictor of stock market prices over several decades.
If consumer spending is slowly (sharply) – it follows we will see a material slowdown in growth (where consumption is 70% of GDP).
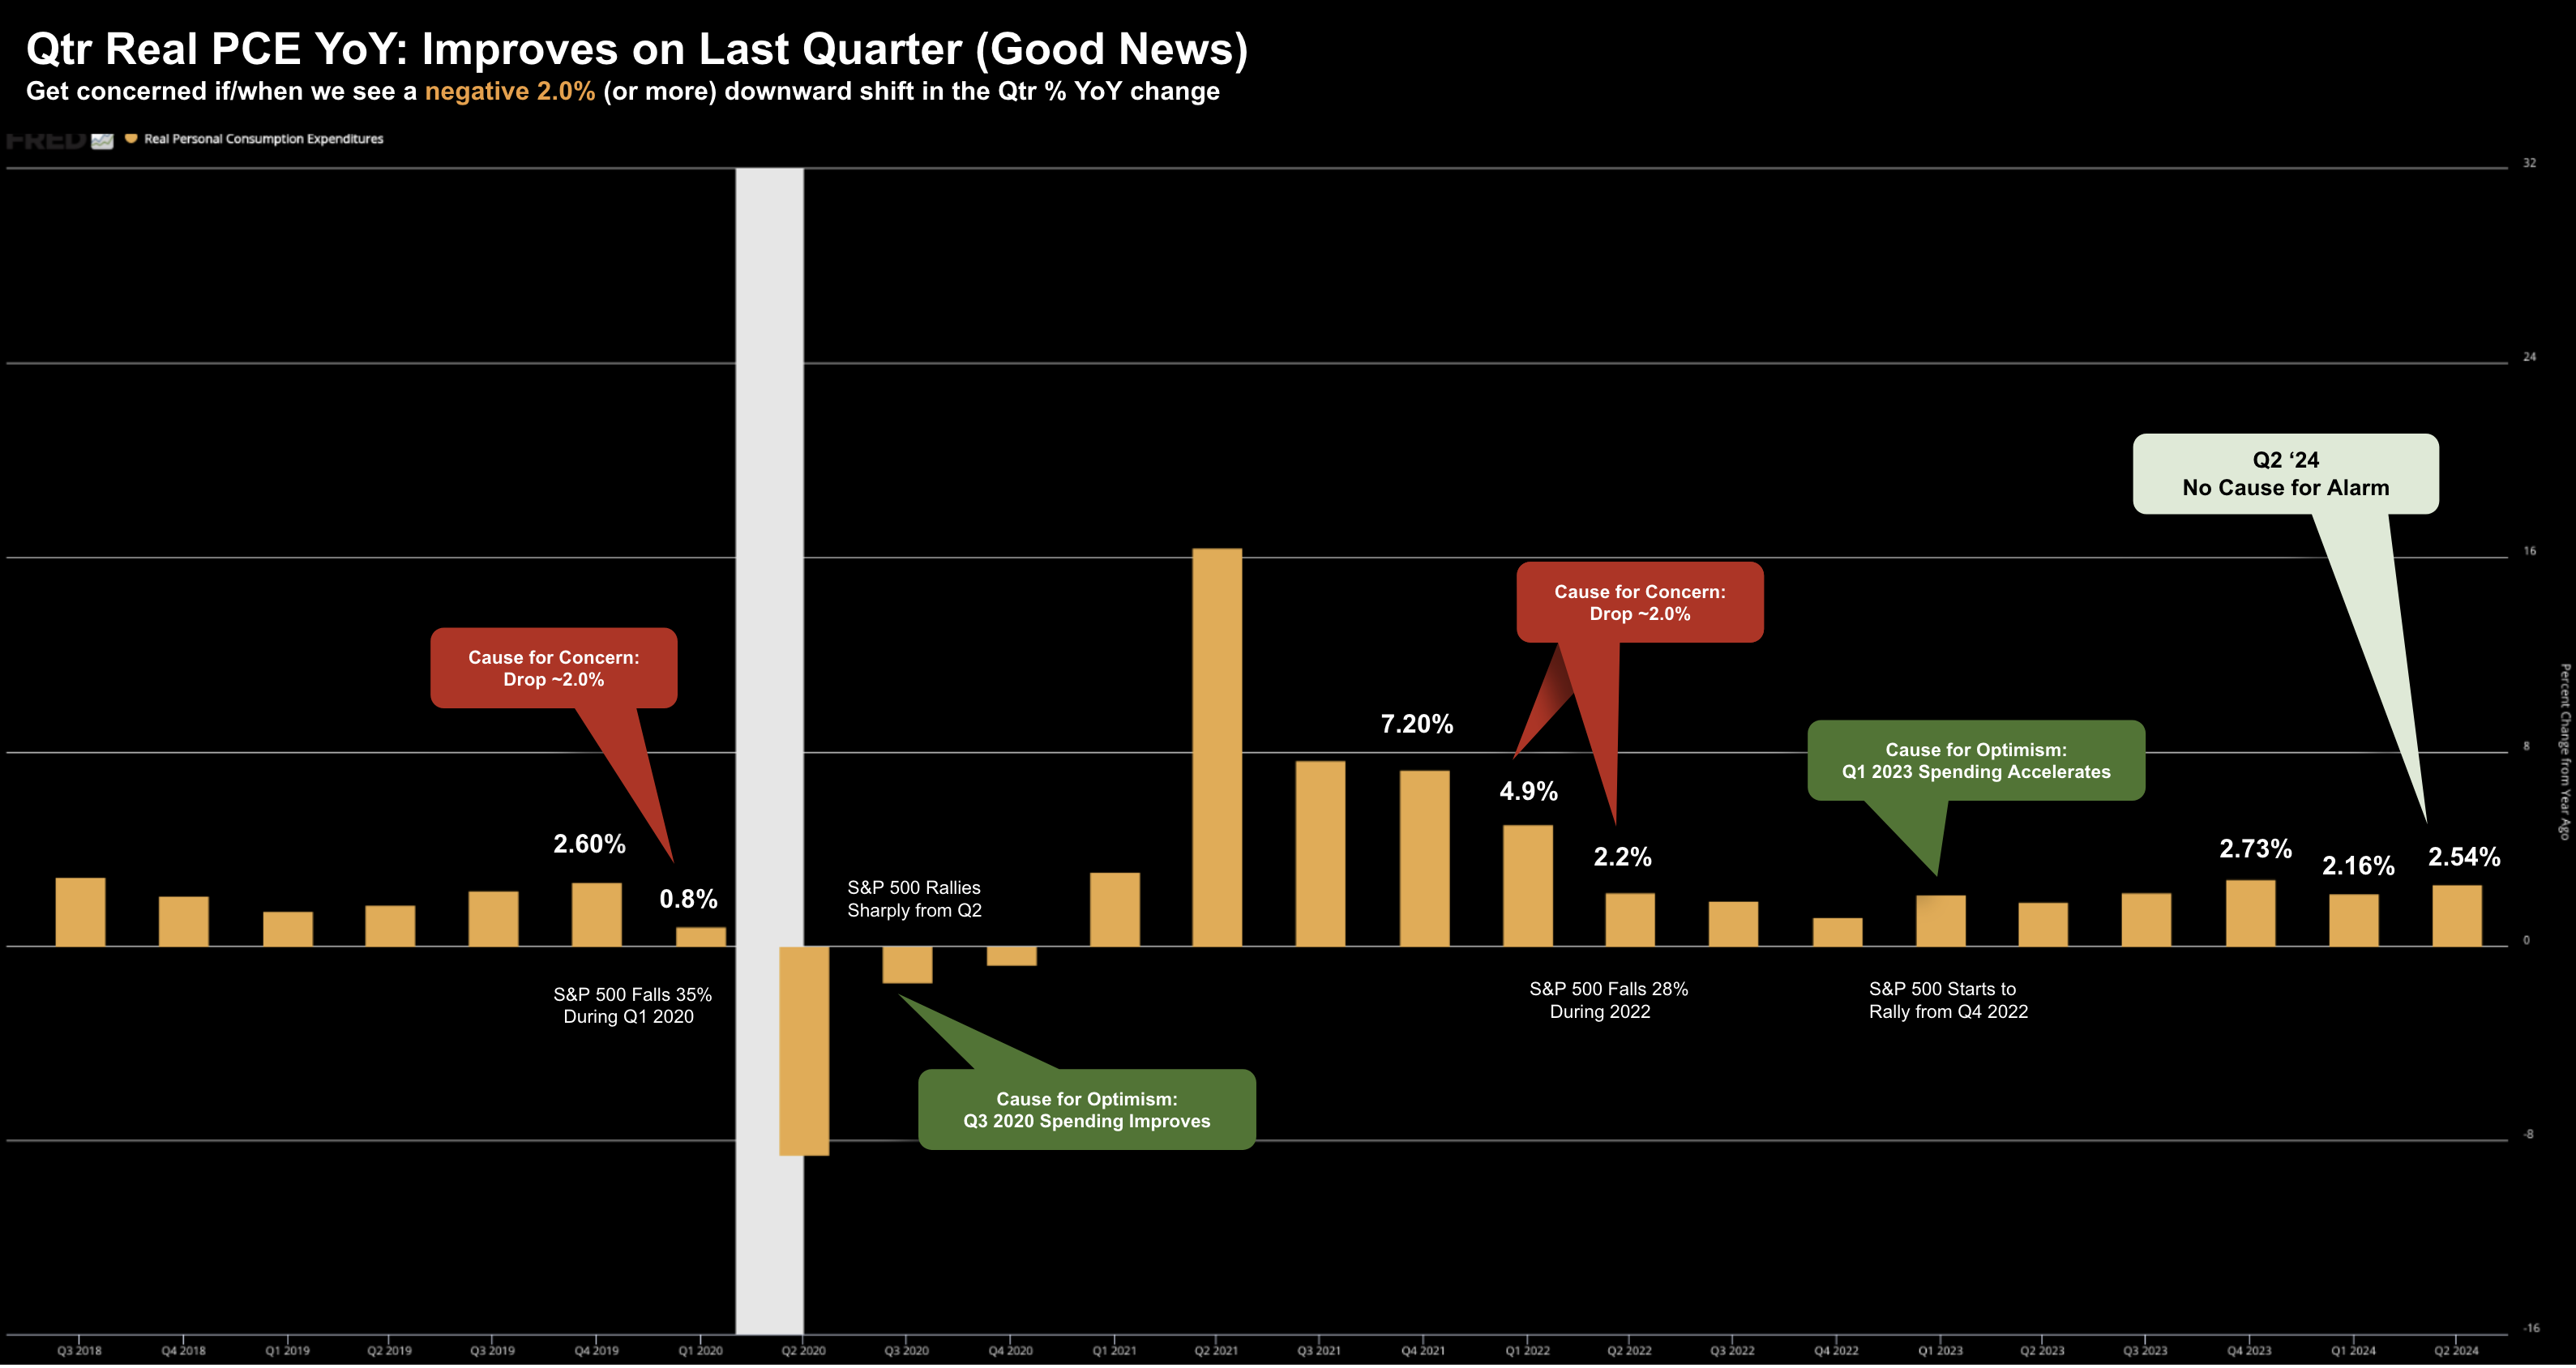
For now, Real PCE is not declining on a quarterly basis.
Consumers are still spending – however they are using credit to do it (given they have exhausted all their savings).
Should we see a change of more than 2% from one quarter to the next (on a year-over-year basis) – it would raise a red flag.
On the other side of the coin – investors might also be concerned with the employment picture (a lagging indicator)
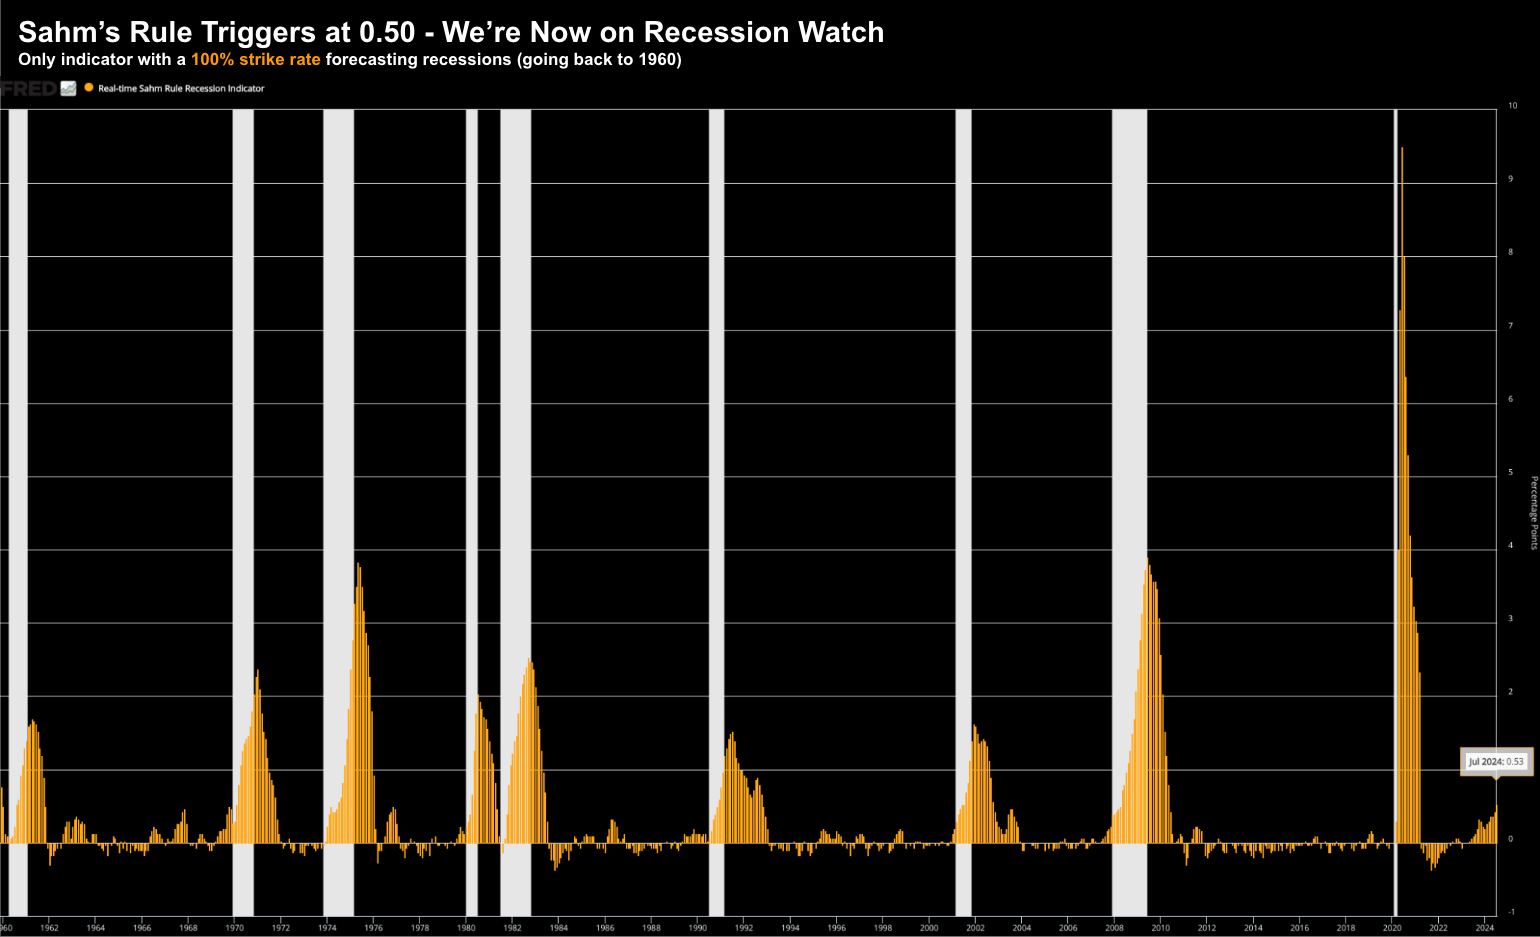
With Sahm’s Rule triggering after the weaker-than-expected July jobs report – some are questioning the overly complacent soft-landing narrative?
However, within the employment report, what I am most interested in here is what we see with real wage growth.
If this is declining (which it is) – then it follows that spending will decline
Are Credit Spreads Widening?
The last metric I am watching for clues of material risk is what we see with credit spreads.
If they are widening – then it’s a sign of some stress in the (financial) system.
For example, as lending conditions tighten -> credit spreads widen -> capex starts to slow -> which leads to bankruptcies.
When there are risks of recession – these spreads really start to blow out.
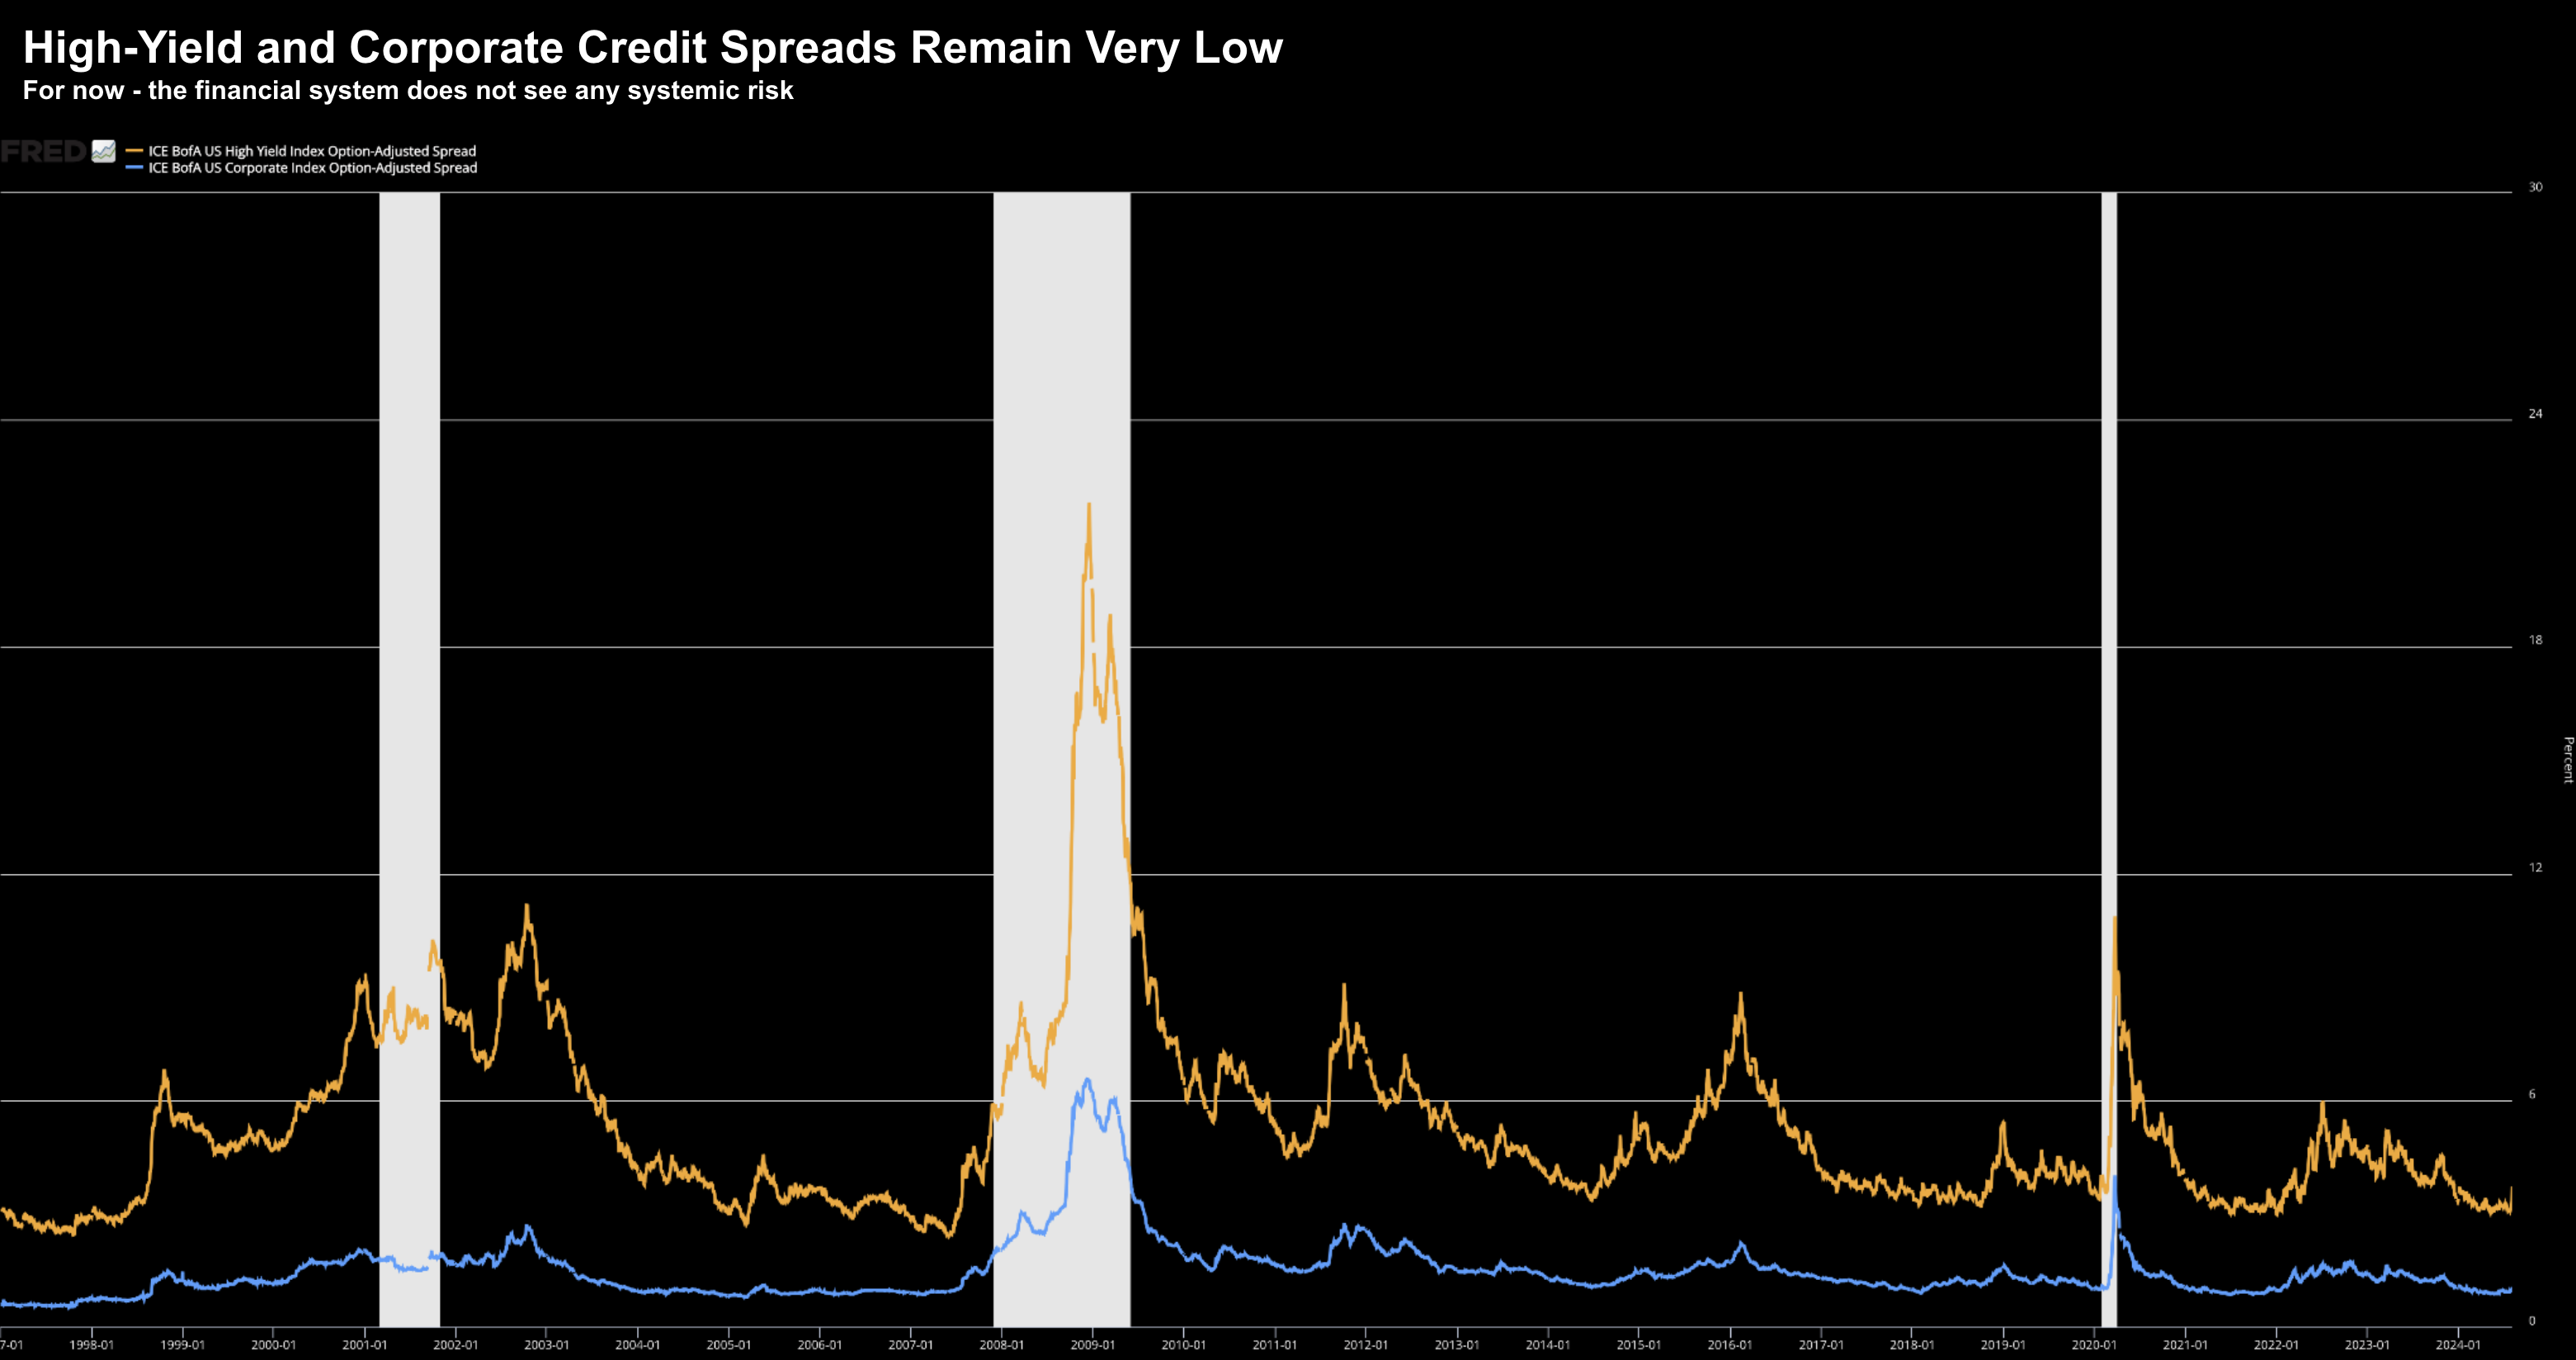
But that’s not what we see today:
The yellow line shows what we see with lower quality (high yield) debt; and the blue line is higher quality (corporate) spreads.
Both are historically very low (or “tight” as they say)
And whilst there was a small tick higher on high-yield debt over the past week or so – there are no real signs of obvious stress.
Putting it All Together
From mine, things are trading per the script.
We have worked our way back to the 35-week EMA zone on the S&P 500 — where we could see things catch a bid.
Most of this appears to be a normal technical correction – perhaps helped by the unwinding of the (Yen) carry trade.
However I don’t think the reaction in equities will change what we hear from the Fed…
Again, we are only 10% off the highs.
That’s nothing given we were up ~62% in less than two years.
It might feel like a lot because investors became overly complacent.
From here, I will be keeping an eye on the trends in (a) Real PCE; (b) Real Wages; and (c) Credit Spreads
That will give me a better sense of whether I see “cracks” in consumers and the economy.
Last but not least… to the trade I put on today.
With the VIX trading close to 50 near the open (something we’ve not seen since the pandemic) – I took advantage of an Index trade via the SPY.
In short, I sold Oct 31 SPY 450 Puts for $15.00
So how did I think through this trade?
Let’s apply the same framework I shared for Nvidia and Amazon the other day.
First up, I expect the S&P 500 to earn ~$250 in earnings this year.
Factset sees the market earning $278 for CY 2025.
Obviously CY2025 could change dramatically should we see a recession (e.g., as much as 20% lower)
At a price of 4500 – that is a CY2024 PE of 18x; and 16.2x CY2025
This is close to the longer-term average forward PE for the Index (i.e., the mean).
Now, the market was paying $15.00 at the open for these October (put) contracts – which equates to an annualized return of 14% (the contract hit $16.00 at one point in the morning)
Given the valuations and returns on offer – I sold these contracts.
What could happen from there?
Should the S&P 500 trade below 4500 at the time of expiry (Oct 31) – I will be exercised at a price of $450 (i.e., 4500 on the S&P 500).
That’s not a terrible place to be long the Index with a 3-year plus timeline.
However, should the SPY trade 1c above 4500 at the time of expiry (Oct 31) – then I will realize 14% annualized on my risk capital.
What’s my risk?
We could see the S&P 500 “fall off a cliff” (e.g. maybe down to 3500) and I am left holding the bag at 4500. That’s my risk. However, if I felt that was a material risk – I could always buy protection on the downside using any profits made – based on any expected near-term rally).
Let’s see how we go… I will let you know if it works out.

