- Market breadth narrows once again
- Reducing risk in your portfolio; and
- Gaining market exposure via an equal weighted ETF
The euphoria in markets continued last week – with the S&P 500 notching a new record high.
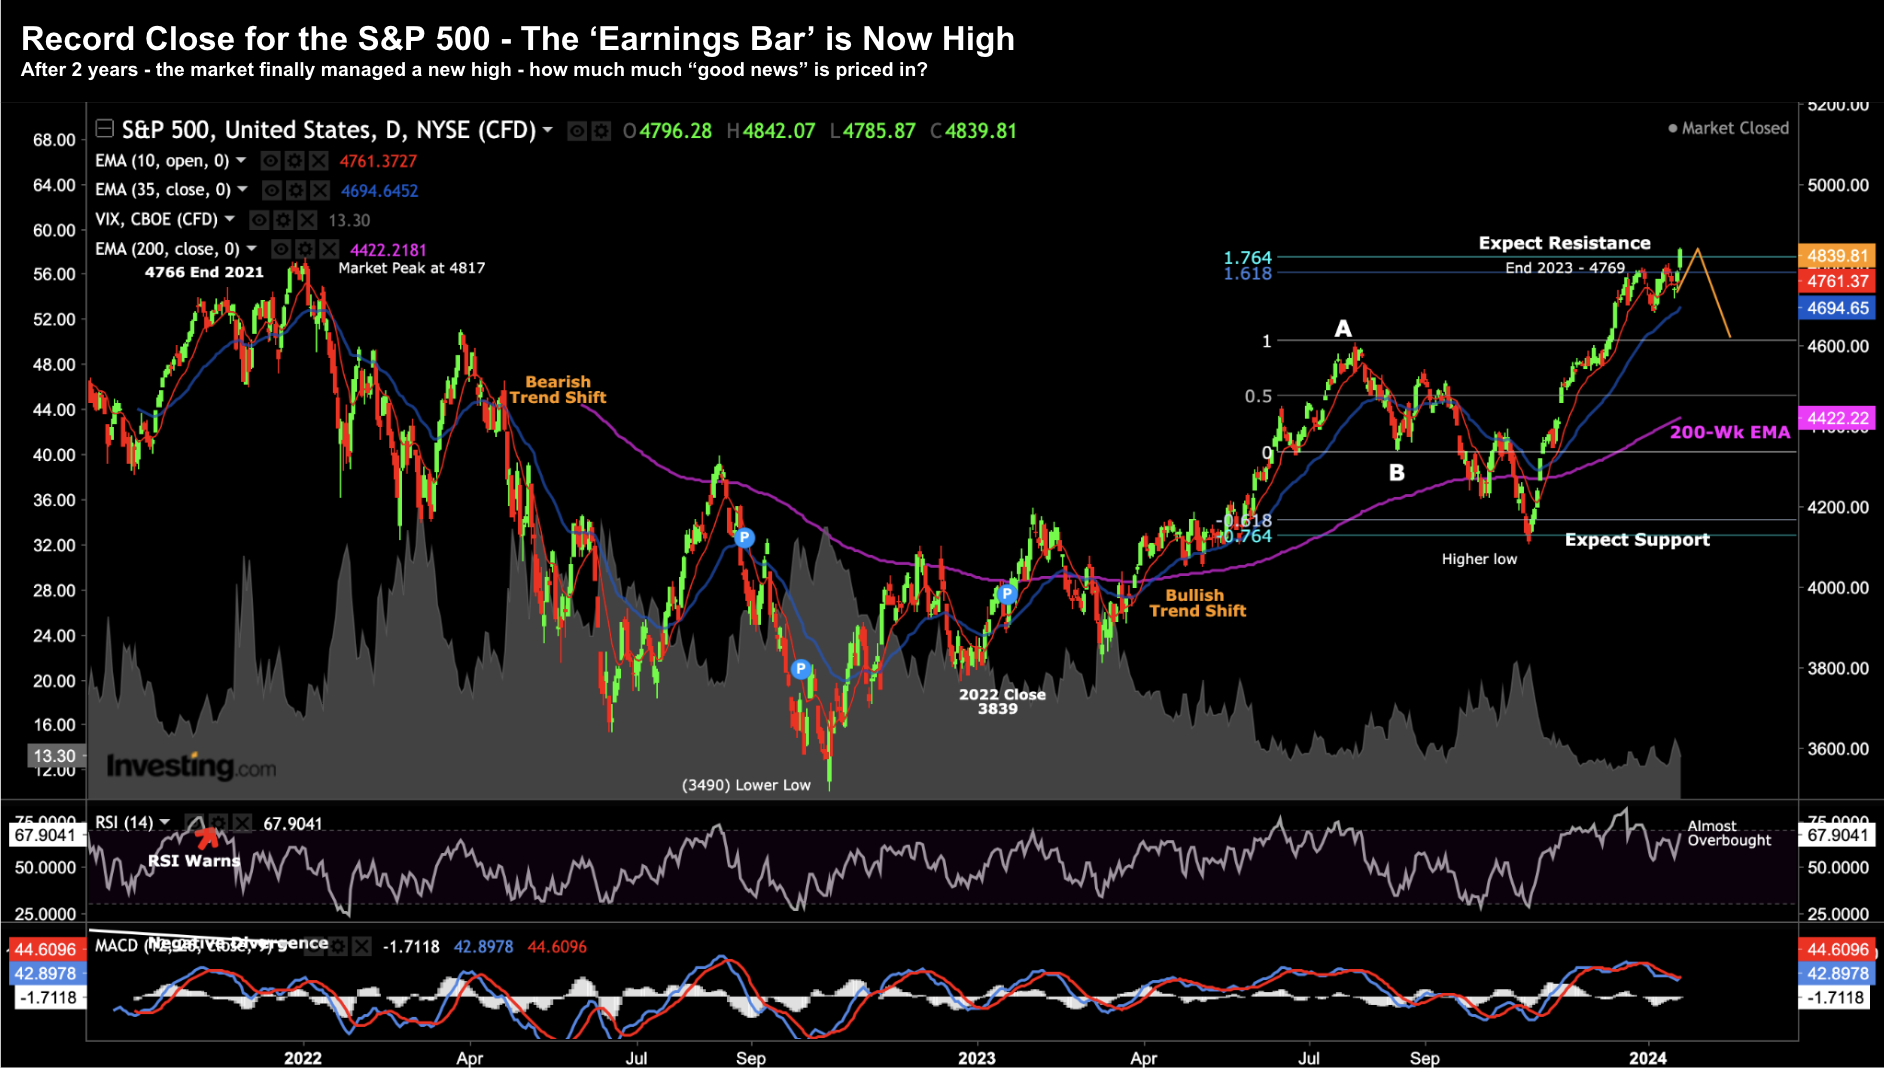
Below is the 2-year journey that took us back above 4800…
Jan 21 2024
We have now round-tripped the previous all-time high of 4817 from January 2022.
Thanks largely to the Fed signaling peak rates in combination with inflation trending lower – markets now believe a ‘soft landing’ is possible.
That is, inflation ultimately trends back to the Fed’s objective (2.0%) without any negative impact to the broader economy (e.g. widespread job losses)
We will see how that turns out – as the Fed is attempting to thread a narrow needle.
From mine, a soft landing remains a lower probability outcome.
But in this case, I will be very happy to be wrong.
For example, last week I asked how we can simultaneously experience six rate cuts with earnings per share (EPS) growth of 12%?
And whilst it feels like a contradiction… that is what the market is pricing in.
With that, let’s examine three things:
- Why we’re at all-time highs;
- Why I still think there are notable risks; and
- Why this could also represent opportunity.
‘Bad Breadth’ is Back
J.P. Morgan was once asked what the stock market would do next.
His response: “It will fluctuate.”
No one at the time thought this was a backhanded way of describing regression to the mean.
But this now-famous reply has become the ‘bible‘ for some investors.
They would tell you greed forces stock prices to move higher and higher from intrinsic value, just as fear forces prices lower and lower from intrinsic value, until regression to the mean takes over.
Eventually, a variance will be corrected in the system.
Now one of the major narratives over the last year was the outperformance of tech stocks and specifically the so-called “Magnificent Seven” (i.e., Amazon, Apple, Alphabet, Meta, Microsoft, Nvidia, and Tesla).
Some might call it greed… others hype.
Irrespective, combined these seven tech stocks represent nearly one-third of the index, and accounted for roughly two-thirds of the calendar year return for the benchmark.
That’s a very narrow market (i.e. bad breadth) and largely why we have record highs.
As a result, if you failed to have meaningful exposure to the ‘Mag 7’ – it’s unlikely you matched or exceeded the benchmark.
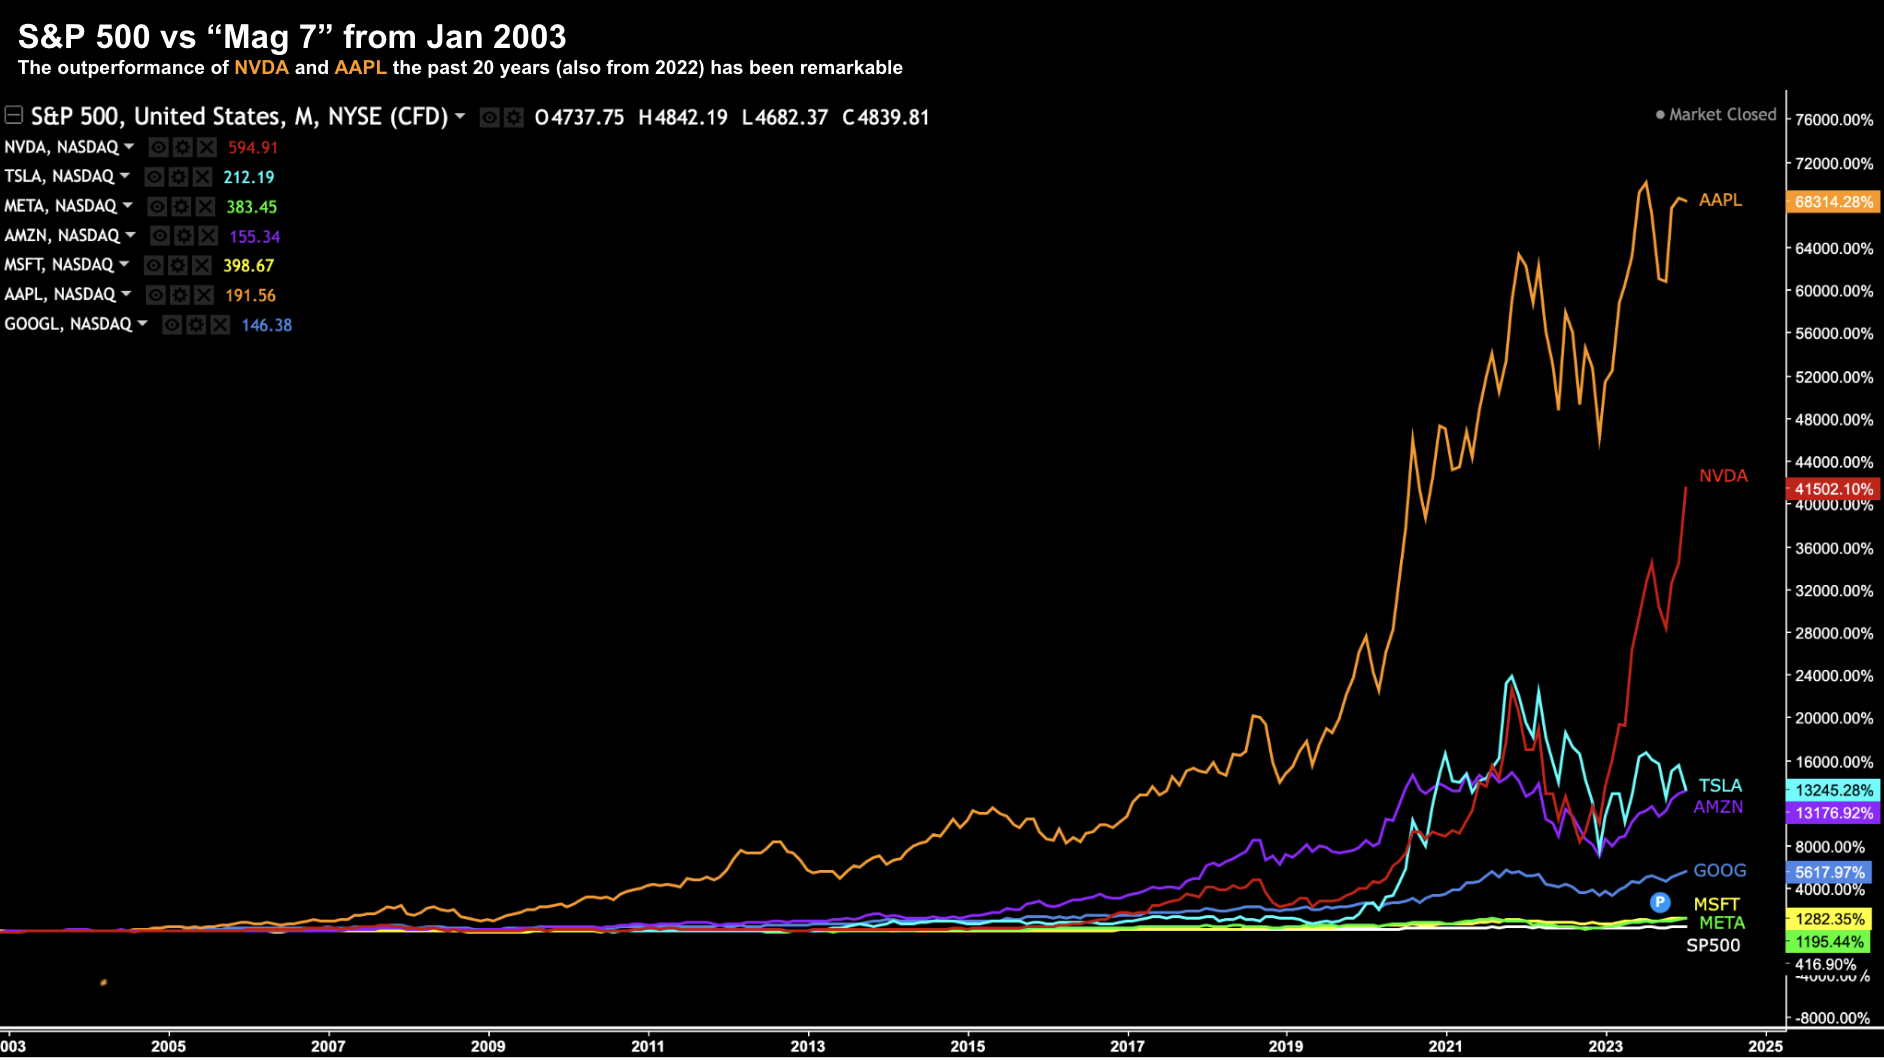
To better demonstrate the market’s lack of breadth – below is a 20-year chart for these seven stocks vs the benchmark:
Jan 21 2024
Whilst the broader index delivered 5x your original capital – it’s arguably modest when compared to these specific seven ‘magnificent’ tech stocks:
- Apple – 68,314% (founded 1976)
- Nvidia – 41,502% (founded 1993)
- Tesla – 13,452% (founded 2003)
- Amazon – 13,176% (founded 1994)
- Google – 5,617% (founded 1998)
- Microsoft – 1,282% (founded 1975)
- Meta – 1,195% (founded 2004)
- S&P 500 – 417%
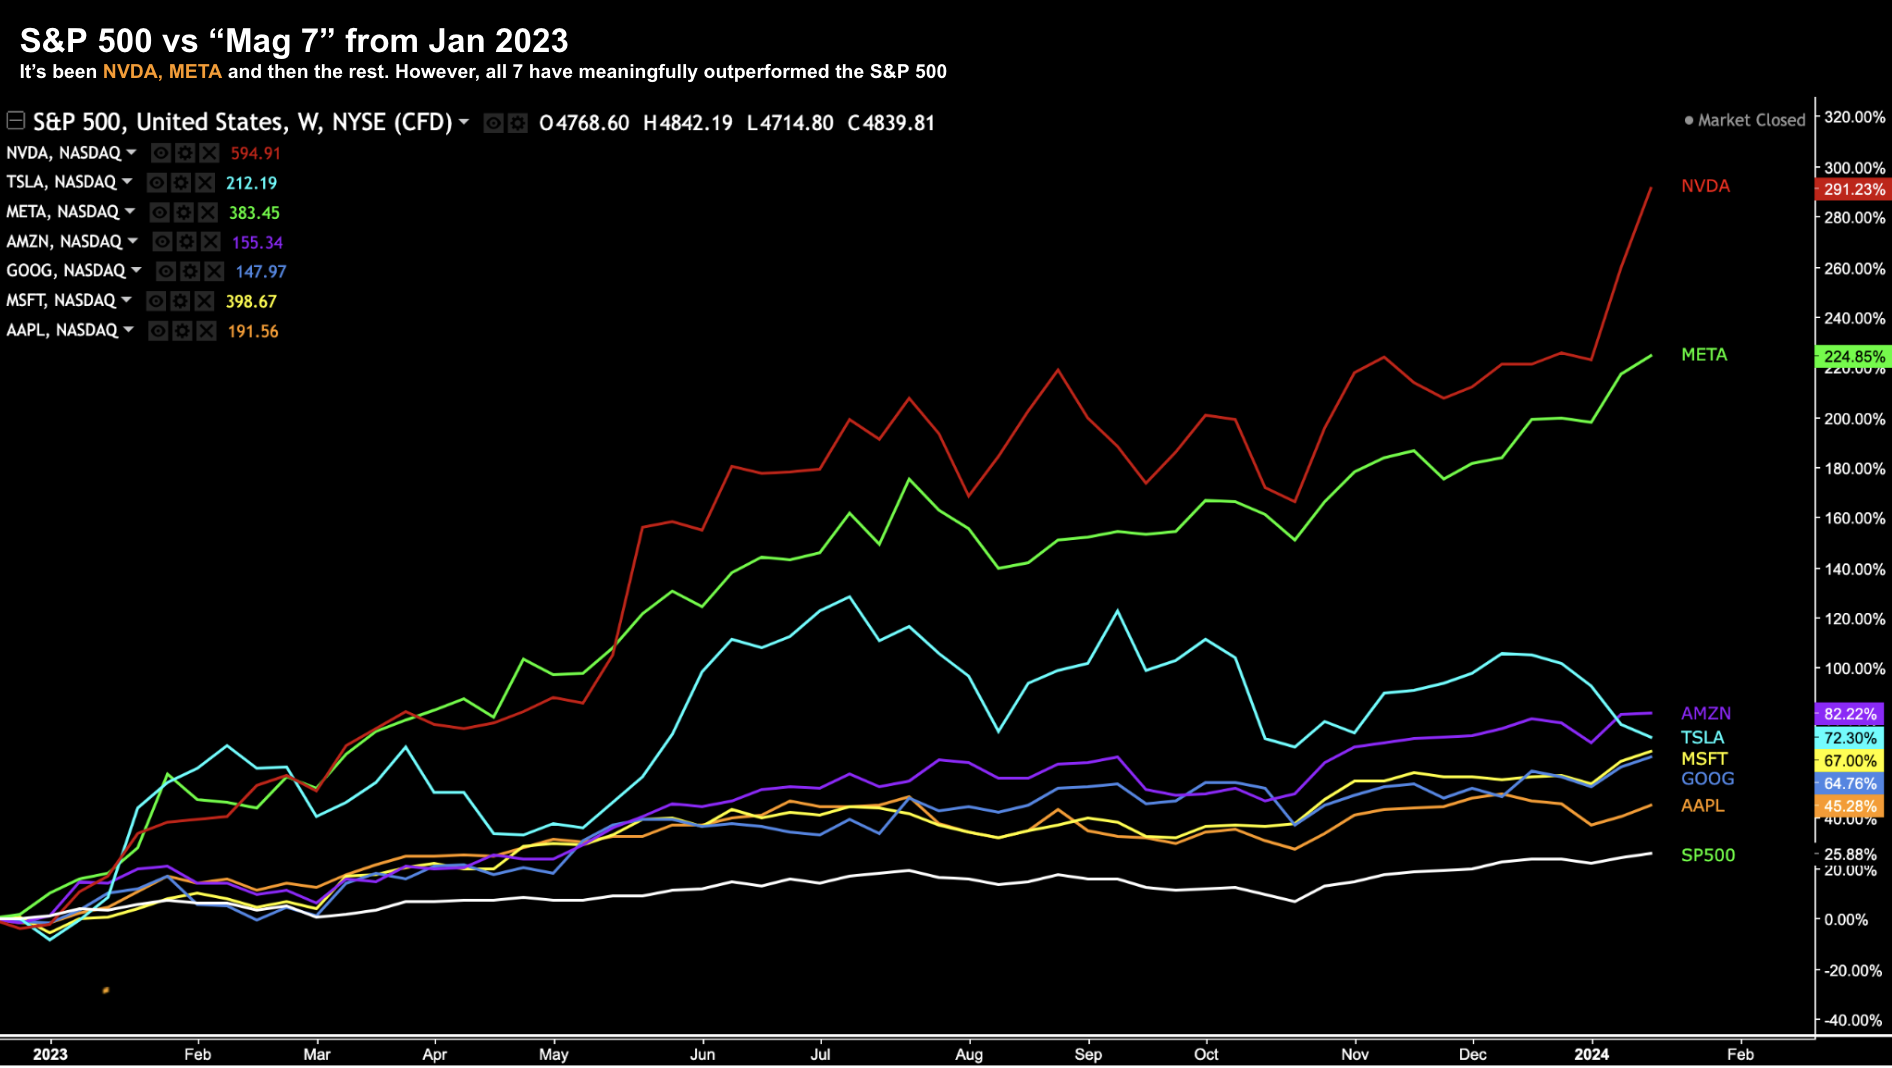
Let’s now shift our lens from 20-years to the past 12-months.
Jan 21 2024
Nvidia (NVDA) and Meta Platforms (META) have dwarfed all other tech stocks.
NVDA is up ~300% the past 12 months; and META has returned 225%.
And whilst the balance of the Mag 7 performed exceptionally well – their 12-month gains are ‘modest’ in comparison:
- AMZN is up 82%;
- TSLA up 72%;
- MSFT 67%;
- GOOG 64% and
- AAPL 45%
This is helpful context for a comparison for the following ‘benchmark’ index comparisons.
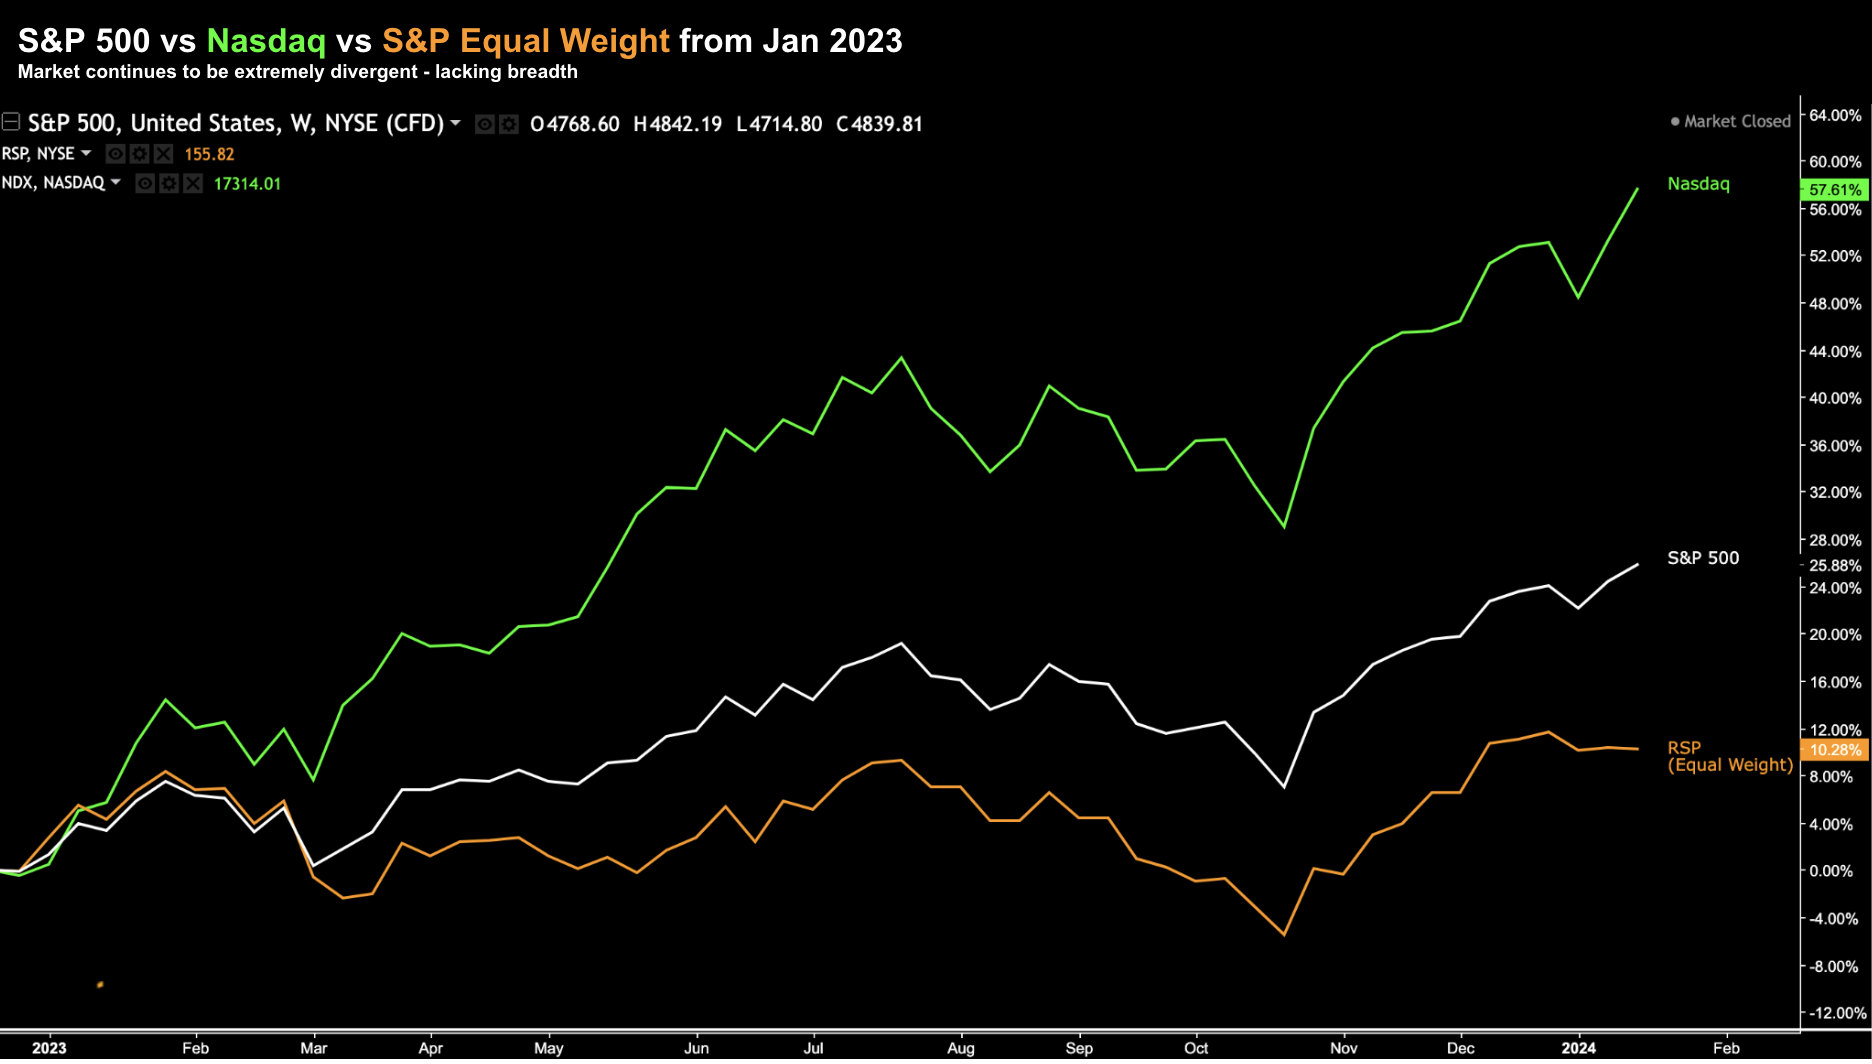
Below I compare the returns of the benchmark S&P 500, Nasdaq and Equal Weighted Index (represented using the ETF RSP) from Jan 2023:
Jan 21 2024
Given what we’ve seen from the likes of NVDA and META – it’s not surprising the Nasdaq is up ~60% over the past 12 months – more than 2x that of the S&P 500.
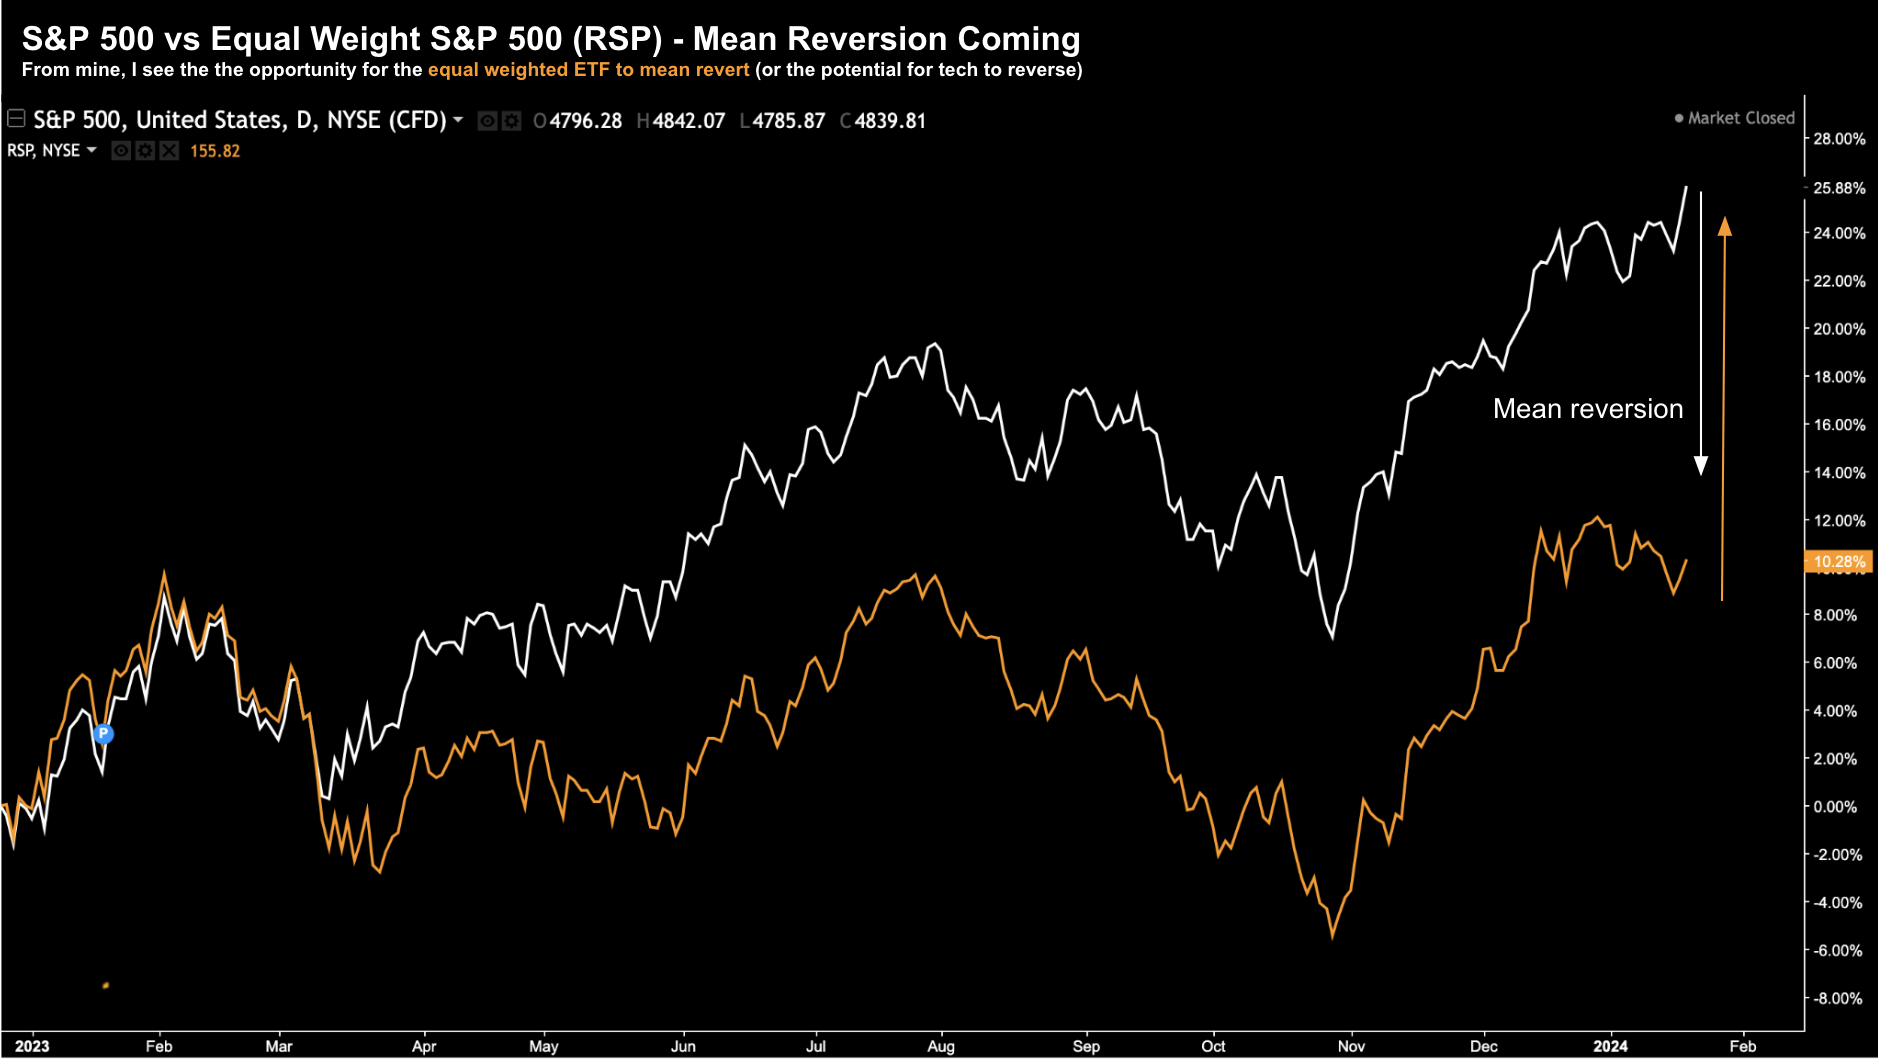
However, what’s more interesting is the Equal Weighted S&P 500 (RSP) is only up ~10%
And for me, this is where the opportunity could be over 2024/25 (which cames back to the famous quote from J.P. Morgan almost a century ago)
Opportunity in Equal Weighted ETF
From mine, the dense concentration in a handful of tech names adds to the risks heading into 2024.
That said, narrow market rallies can continue for sometime.
Put another way, they are not a sign the market is about to reverse course imminently.
All it simply suggests is the risks are higher.
From mine, when (not if) the euphoria over things like Artificial Intelligence (AI) subside – expect a pullback in these names.
For example, given the hype around AI, the S&P 500 technology sector trades at a forward PE of 34x.
That’s exceptionally high (and a long distance from the long-term mean).
It also tells us a lot of very good news (and strong growth) is priced in the market.
However, it’s unclear whether that potential will be realized.
It may not.
We will get a better pulse on how tech is travelling over the next couple of weeks when they report earnings (hint: count the number of times they mention “AI”).
However, where I see a better risk/reward is with the equal weighted S&P 500 (via the ETF RSP)
Let me offer two charts.
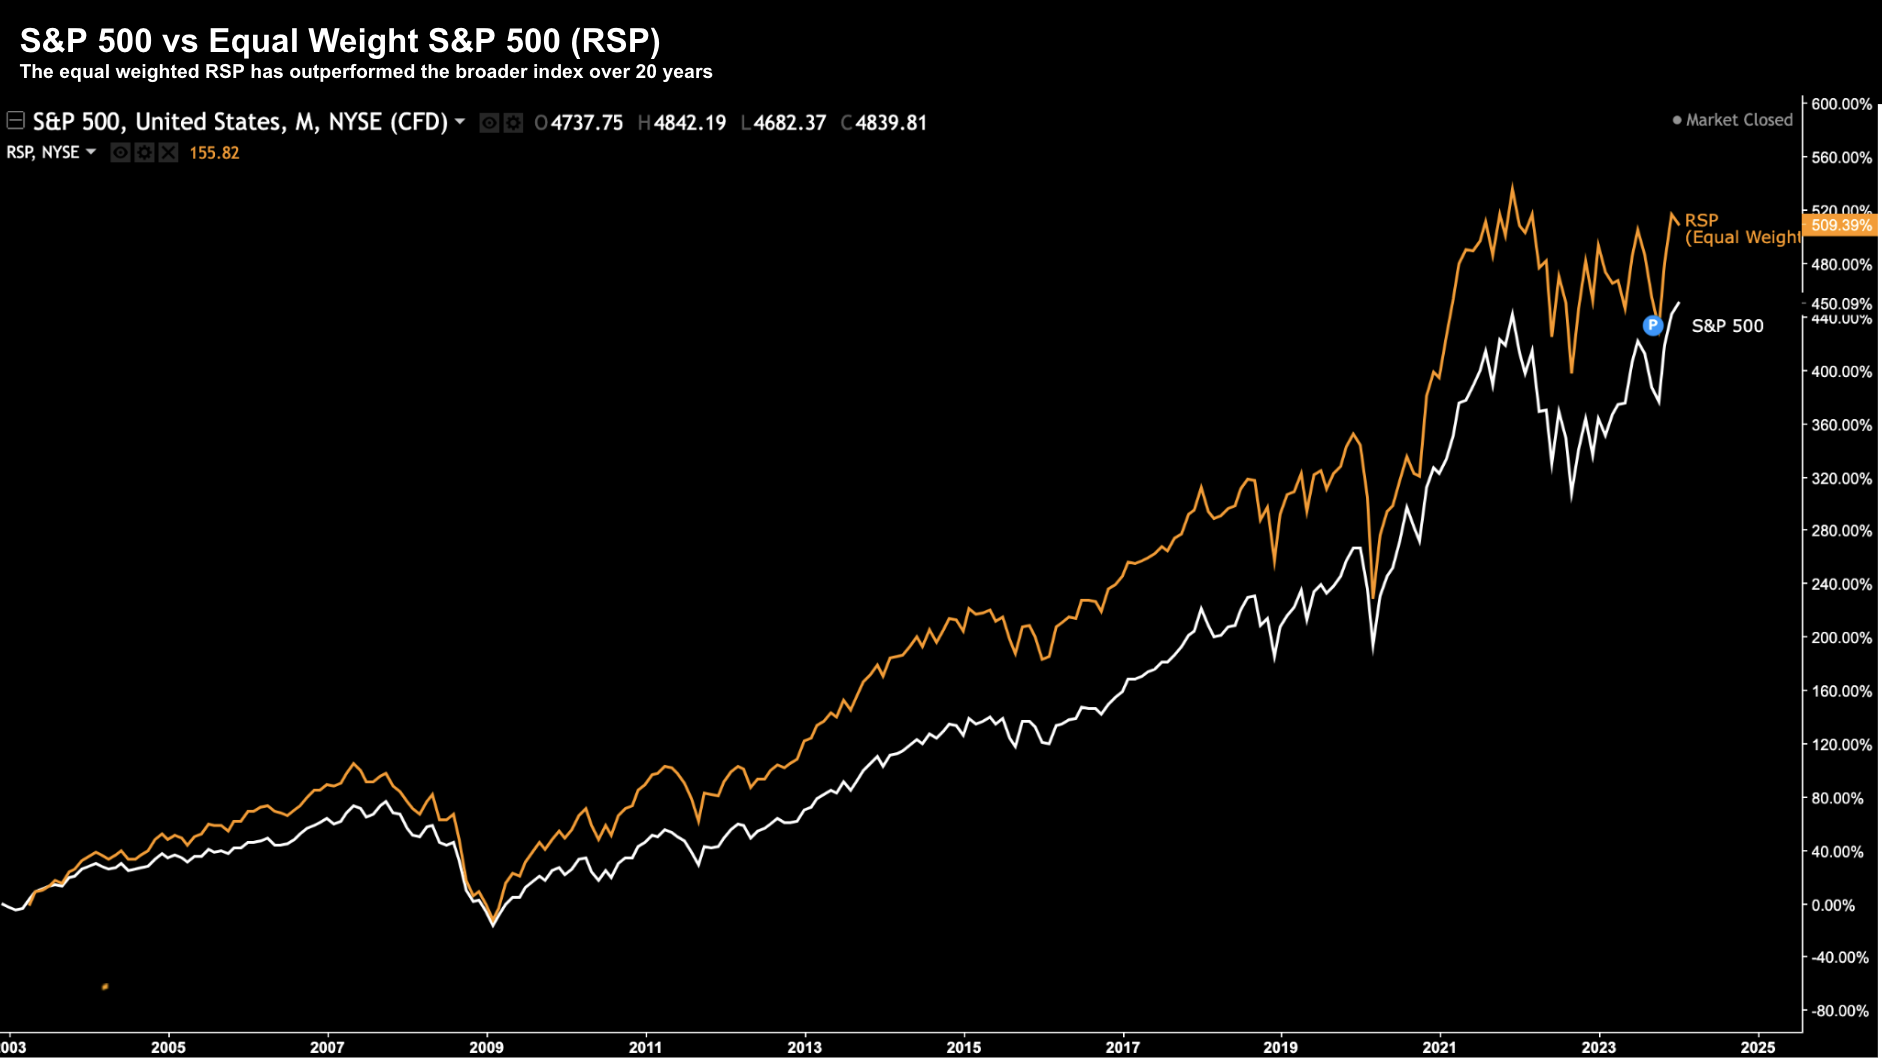
The first is the performance of RSP vs the S&P 500 over the past 20 years:
Jan 21 2024
This is useful for a couple of reasons:
First, we see how closely these two charts track each other.
However, sometimes we see periods of extended divergence (which I will talk to shortly in terms of reversion).
Second, the RSP has modestly outperformed the benchmark since its inception.
In addition, the S&P 500 Equal Weight Index has outperformed the S&P 500 Index in 6 of the last 12 calendar years.
But as we know, 2023 was not one of those years.
Last year there was notable divergence (i.e. where the equal weighted ETF underperformed) – demonstrated below:
Jan 21 2024
From mine, this is where I see both market opportunity and a potential hedge.
For example, my thinking is we’re likely to see mean reversion with the equal weighted index.
Put another way, I think these two indices will converge at some point later in 2024 (or possibly 2025)
The next question is where to target our entry…
Evaluating The Chart for ETF RSP
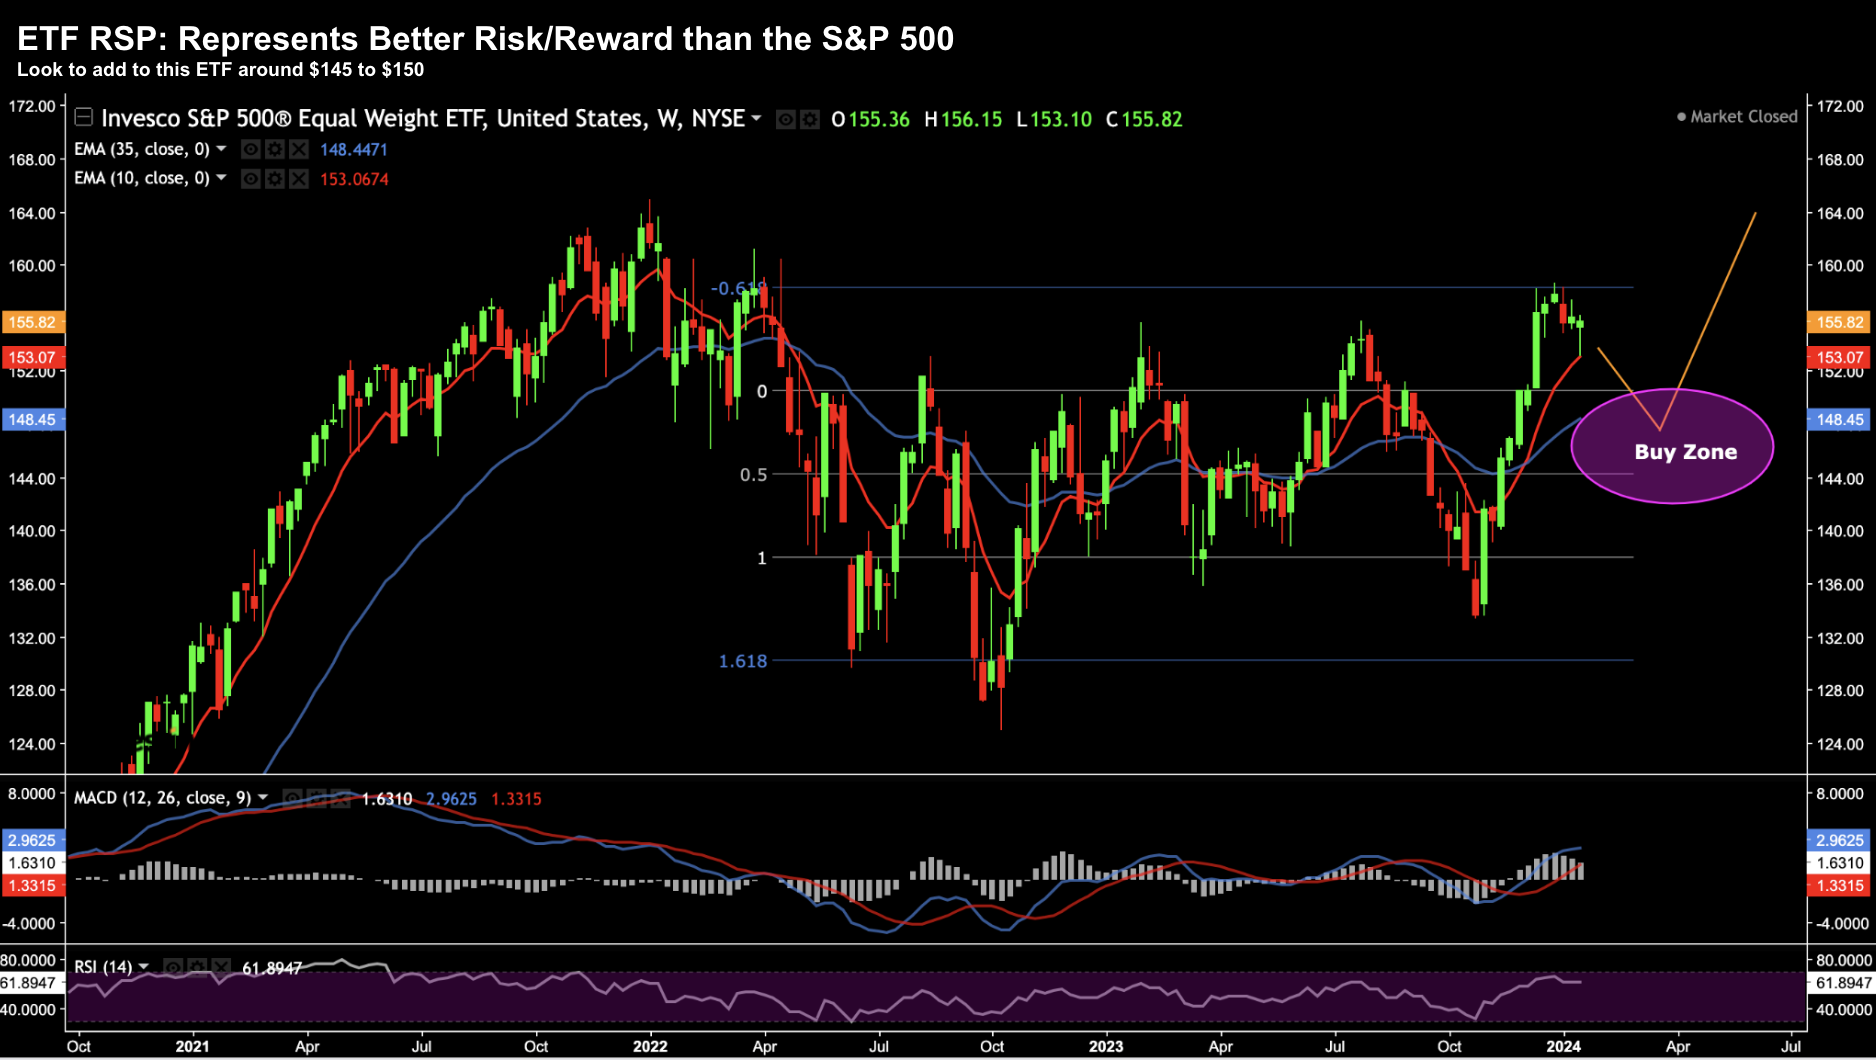
Below is the weekly chart for the Invesco S&P 500 Equal Weight ETF ‘RSP’
Jan 21 2024
It’s also had a strong run since the lows of October – however has underperformed the broader index and tech sector.
In addition, it’s yet to recapture the Jan 2022 high of almost $165
My thinking is to consider adding exposure between $145 and $150.
And whilst there is the potential for this ETF to trade back below $140 on any broader market sell off (where I would be a confident buyer) – I think the downside risk is lower vs its technology based peers.
In addition, should we see fund rotation out of (overpriced) tech, this fund will stand to benefit.
Putting it All Together
Over the holidays I re-read three books which talked a lot about mean reversion (both with investing and in life)
- Thinking in Bets: Making Smarter Decisions When You Don’t Have All the Facts – Annie Duke
- Thinking Fast and Slow – Daniel Kahneman; and
- The Art of Thinking Clearly – Rolf Dobelli
In the game of asset speculation – mean reversion suggests that over time an asset will eventually return to its average price if it drifts or spikes too far from that average level.
Kahneman and Tversky were “mean reversion masters” and made it a mainstream concept in financial markets.
They also apply it to other things in life.
For example, they tell a story about mean reversion and the Israeli Air Force.
When it came to influencing and improving a pilot’s ability to fly, reward and punishment were simply an illusion. Each time the Air Force rewarded a pilot for a great flight, that pilot tended to do worse on the next attempt. And when they punished a pilot for a poor flight, that pilot tended to do better on the next attempt.
That’s mean reversion.
It’s the same when we’re feeling under the weather. You might be feeling very ill and pay a visit to the Doctor. He says ‘just take it easy for a few days and rest’. Lo and behold a few days later you’re most likely feeling better. Things regressed to the mean.
Here’s Rolf Dobelli with three more examples from The Art of Thinking Clearly:
His back pain was sometimes better, sometimes worse. There were days when he felt like he could move mountains, and those when he could barely move. When that was the case fortunately it happened only rarely his wife would drive him to the chiropractor. The next day he would feel much more mobile and would recommend the therapist to everyone.
Another man, younger and with a respectable golf handicap of 12, gushed in a similar fashion about his golf instructor. Whenever he played miserably, he booked an hour with the pro, and lo and behold, in the next game he fared much better.
A third man, an investment adviser at a major bank, invented a sort of ‘rain dance’, which he performed in the restroom every time his stocks had performed extremely badly. As absurd as it seemed, he felt compelled to do it: and things always improved afterward
Mean reversion.
To that end, I think we would be wise to pay close attention to today’s exceptionally narrow market.
Tech stocks will likely revert to the mean catching a lot of investors off-side.
Probabilities also tell me that AI may not meet all the hype.
On the other hand, stocks which are unloved (which trade at much lower forward PE’s) will likely catch a bid.
Mean reversion.
To be clear, maintaining exposure to mega-cap tech should always be part of your core portfolio.
It’s a cornerstone of my own portfolio – however represents a weighting off ~20% weight (not the 33% with the Index)
My thinking (which could be wrong) is expecting these 7 stocks to repeat the gains of last year is unlikely.
Therefore I’m looking to increase my exposure elsewhere.
Diversifying through the ETF RSP feels like a viable longer-term risk reward option.

