- The thing about market adages
- Will Powell be cutting rates into rising unemployment?
- And why this matters a great deal for the S&P 500
“Don’t fight the Fed” is a popular Wall St. adage for investors.
The phrase was coined by well known investor Marty Zweig in 1970.
At the time, Zweig explained the Federal Reserve policy enjoys a strong correlation in determining the stock market’s direction.
Fast forward approx 50 years and his theory has proven mostly correct.
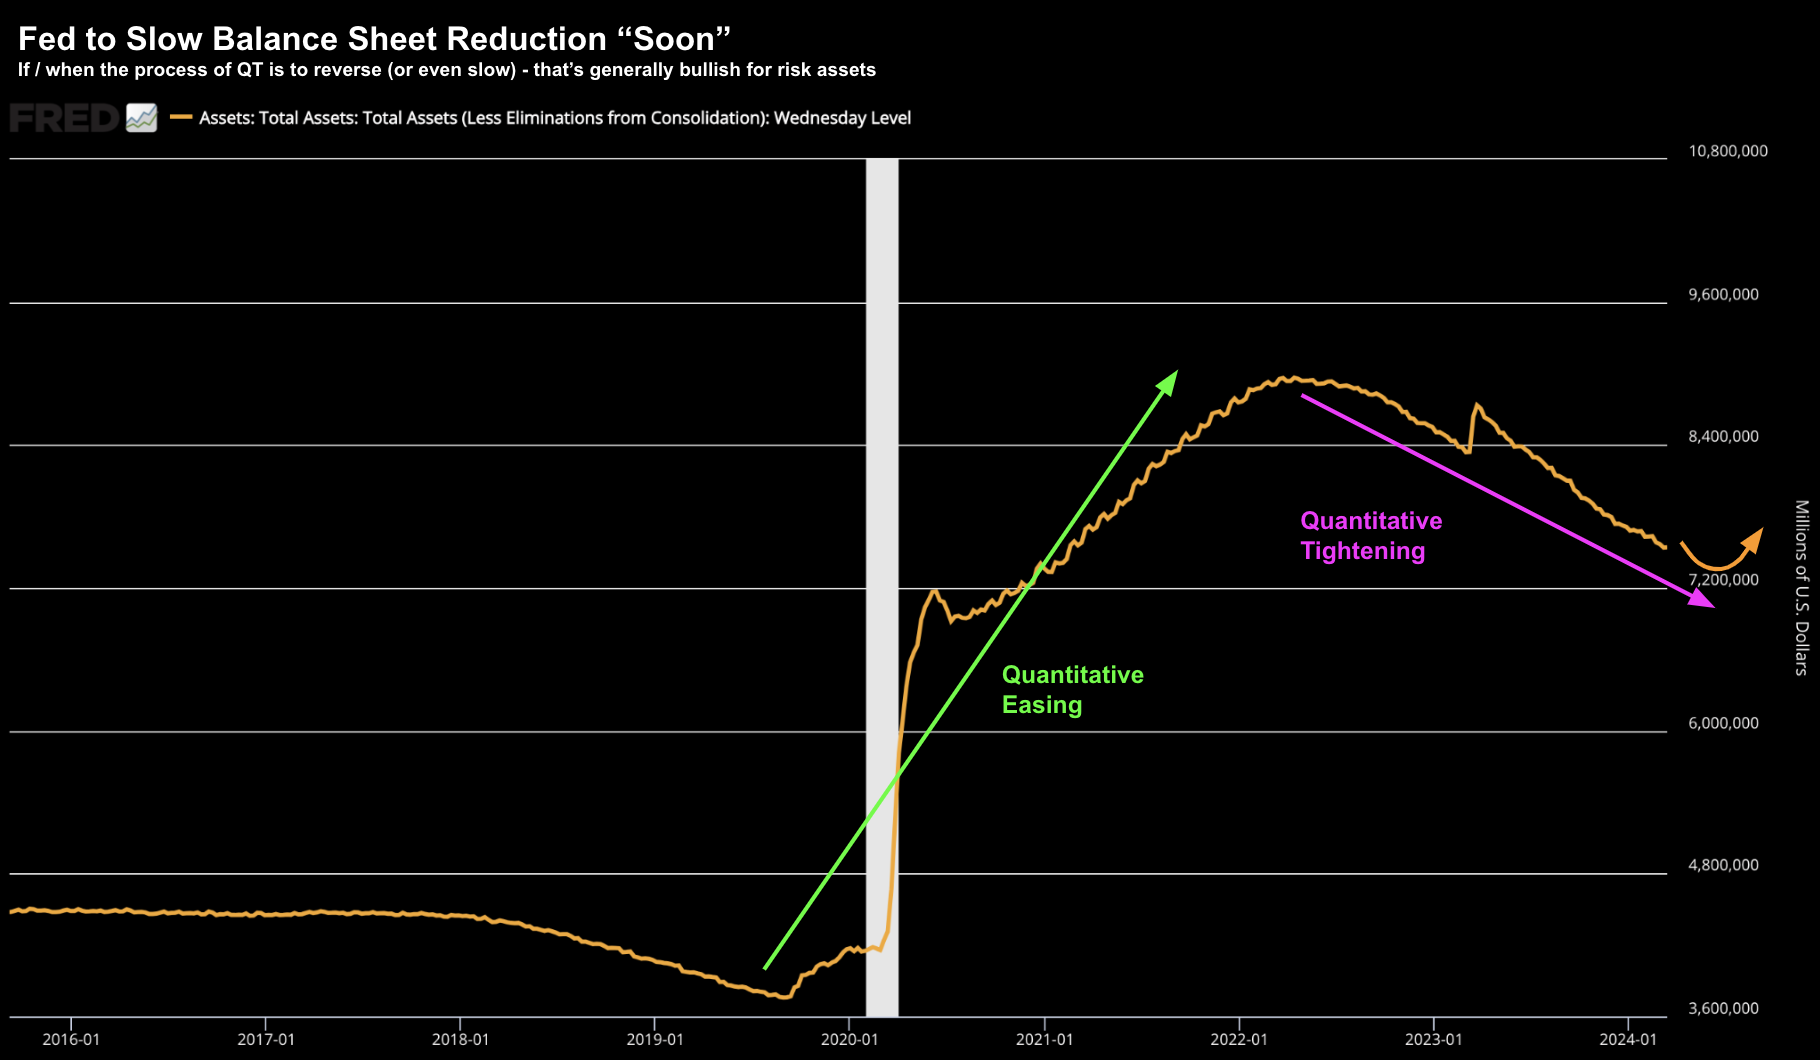
Consider the Fed’s Quantitative Easing (QE) program.
This is where the Fed intervenes in the open market to purchase assets like government debt or mortgage back securities to reduce interest rates and increase the money supply.
QE creates new bank reserves, providing banks with more liquidity and encouraging lending and investment (not to mention risk asset speculation)
I shared this chart yesterday – which highlights the velocity of QE we have seen since the pandemic.
March 21 2024
Now where it gets interesting is when we apply Zweig’s theory.
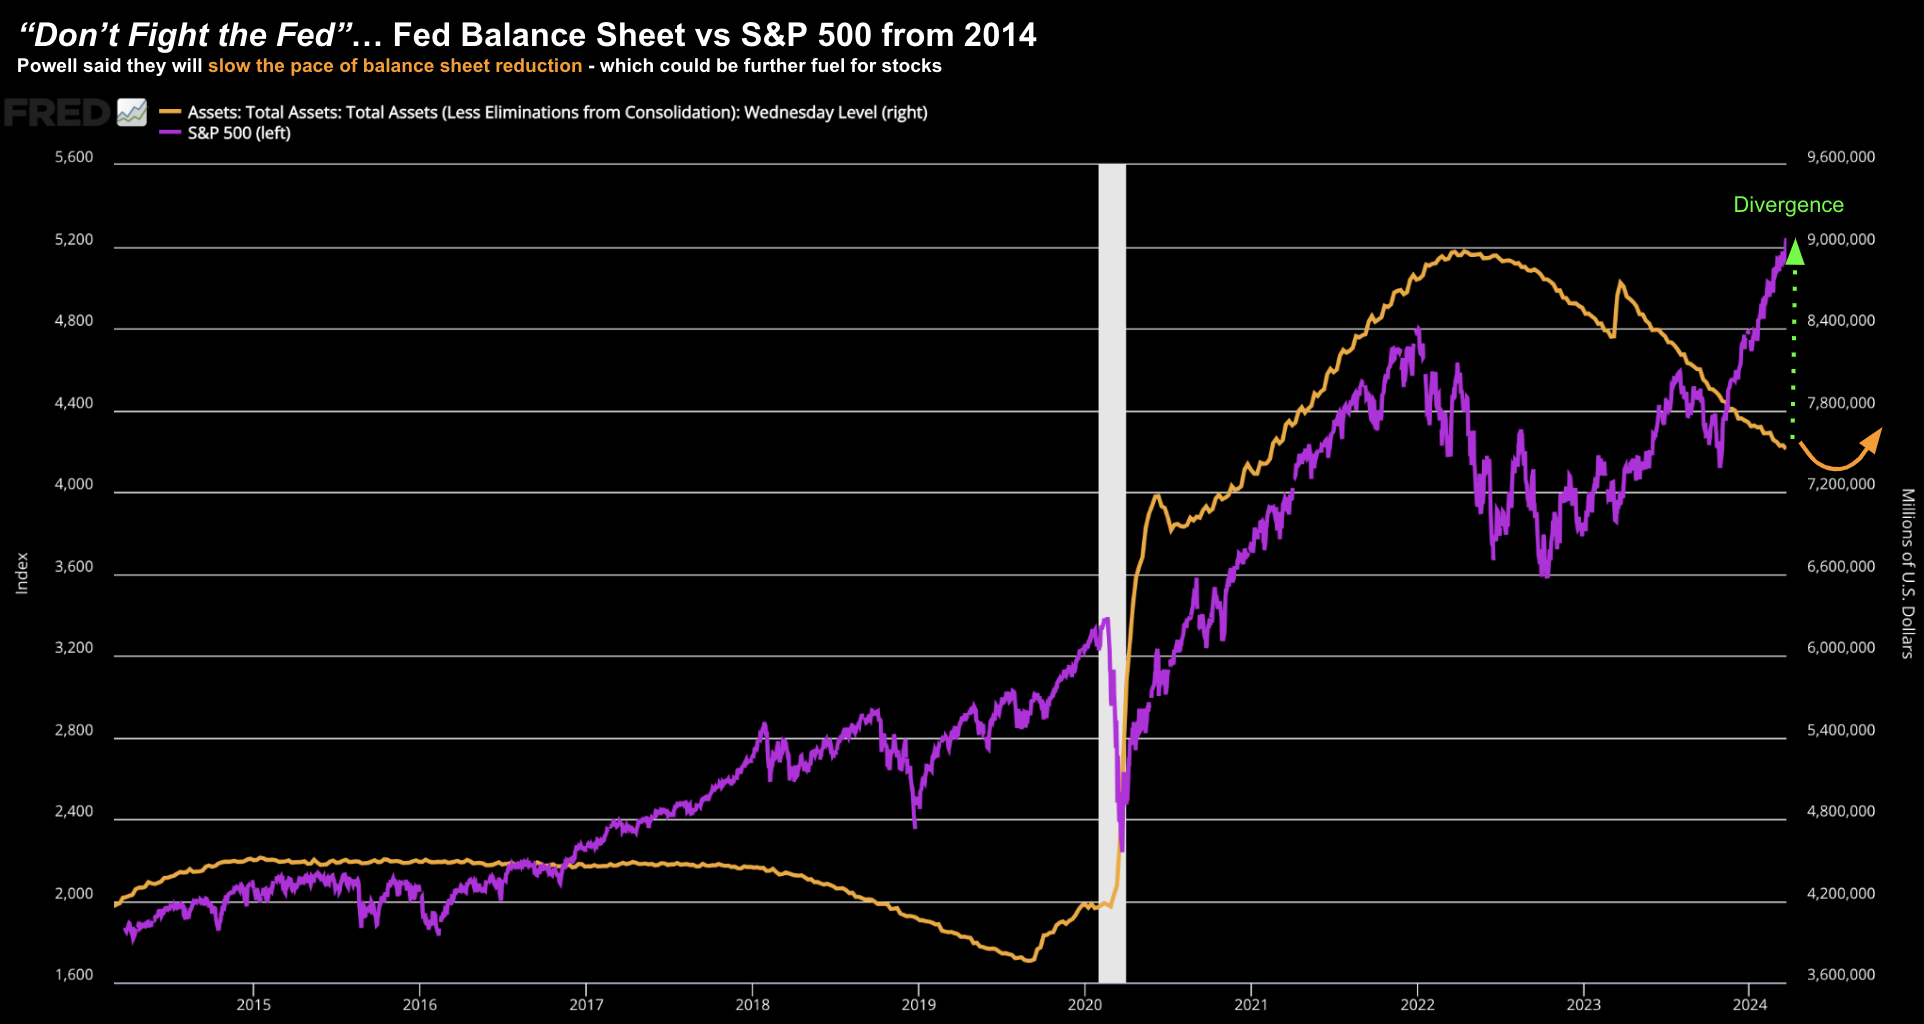
Below is the S&P 500 overlain with the Fed’s balance sheet from 2014:
And whilst the relationship isn’t perfect – it does show a correlation coefficient of 0.8093 (according to investopia.com)
They tell us:
“The correlation coefficient ranges from -1.00 to +1.00 and illustrates the dependence these two variables have on each other. Although correlation does not equal causation, the relationship between the S&P and the Fed’s balance sheet is compelling”
From that perspective, what’s interesting is the recent divergence from late last year (i.e., where stocks rallied despite the Fed continuing to reduce their balance sheet; i.e. QT)
Something to watch over the next 12-24 months…
A Fed Contradiction?
The mot meaningful callout from yesterday (from mine) was Powell plans on reducing QT “fairly soon” (currently $95B per month)
Combined with the (implied) commitment to rate cuts – it was “three cheers” from the market.
But here’s the (possible) contradiction which had me thinking…
Powell told us the FOMC has increased their forecasts for economic growth this year (and next) – telling us employment conditions remain strong.
The Fed expects the US economy to grow 2.1% this year (up from December’s 1.4% projection) — before ticking down slightly to 2.0% in 2025 and remaining at that level through 2026
Put another way – the Fed sees a soft landing.
So put together, we have:
The likelihood of increased economic growth with rate cuts.
It’s little wonder investors said “let’s party like it’s 1999” … cheap money with the expectations of solid growth.
What’s not to like?
But what I don’t get is why commit to rate cuts when you don’t have clear line of sight on inflation (they think they do); and an economy which is apparently doing just fine?
Put another way – why remove optionality when you may need rate cuts for when we do experience economic contraction?
Or does the Fed see something we don’t?
And are they trying to jawbone confidence (without sending any early signals of panic?)
We are all guessing… but there is one specific indicator I will be watching.
All Eyes Turn to Employment
Yesterday Powell told us the Fed sees unemployment rising to 4.0% in 2024, lower than the previous forecast of 4.1%.
That’s effectively a very healthy employment picture.
Now if Powell is likely to cut rates into an environment where unemployment is not moving higher – this potentially bodes very well for stocks (as I’ll demonstrate shortly).
On the other hand, if Powell is cutting rates in the event unemployment is getting worse, this is when the stock market typically does poorly.
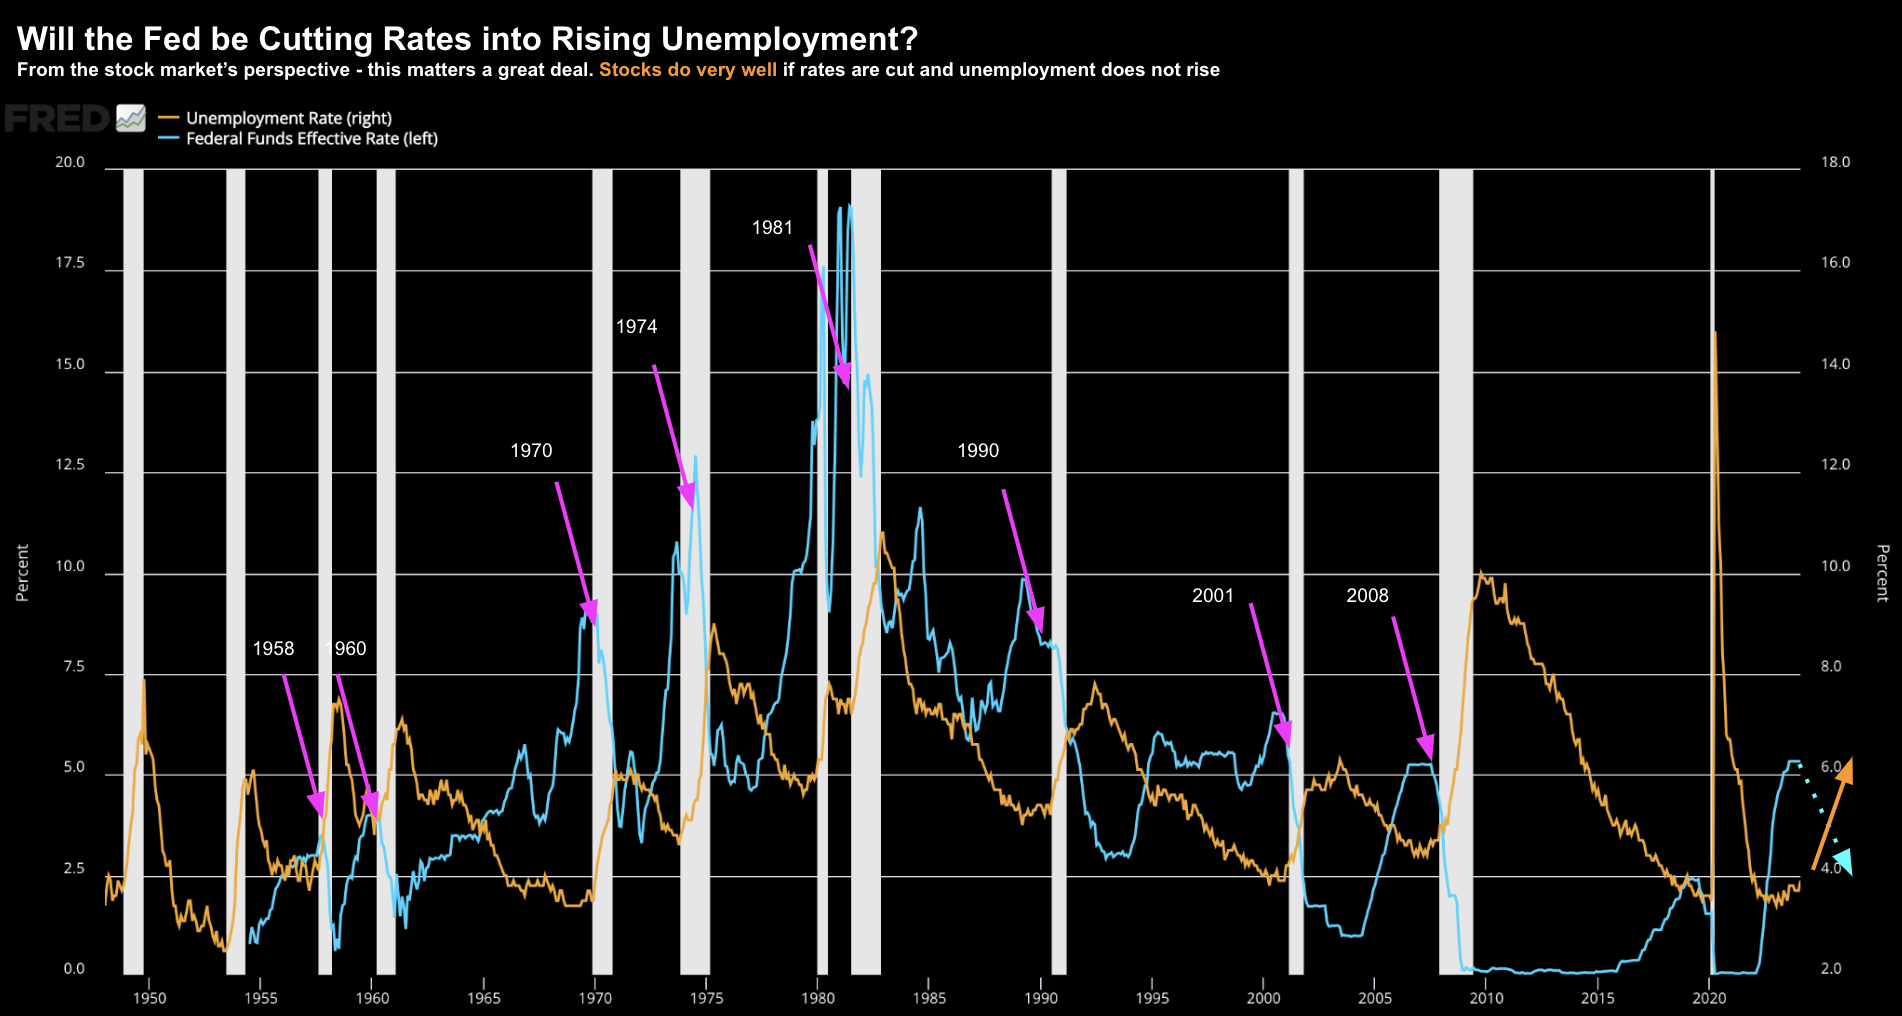
Take a look at this chart from 1954 – where I compare the unemployment rate with the effective Fed funds rate:
March 21 2024
Labelled are the 8 times since 1954 where the Fed has cut rates (blue line) into rising unemployment (orange line)
Here’s the rub over the past 70+ years:
- During the months when the Fed cut rates while the unemployment rate stayed flat or declined, the S&P 500 Index enjoyed a 17.4% average annualized percent price gain;
- However, when rate cuts were associated with a rise in the unemployment rate, the S&P 500 monthly average annualized price gain was a very disappointing 4.7%.
- In addition, if unemployment rose during a monthly rate cut, the S&P suffered a loss nearly 40% of the time.
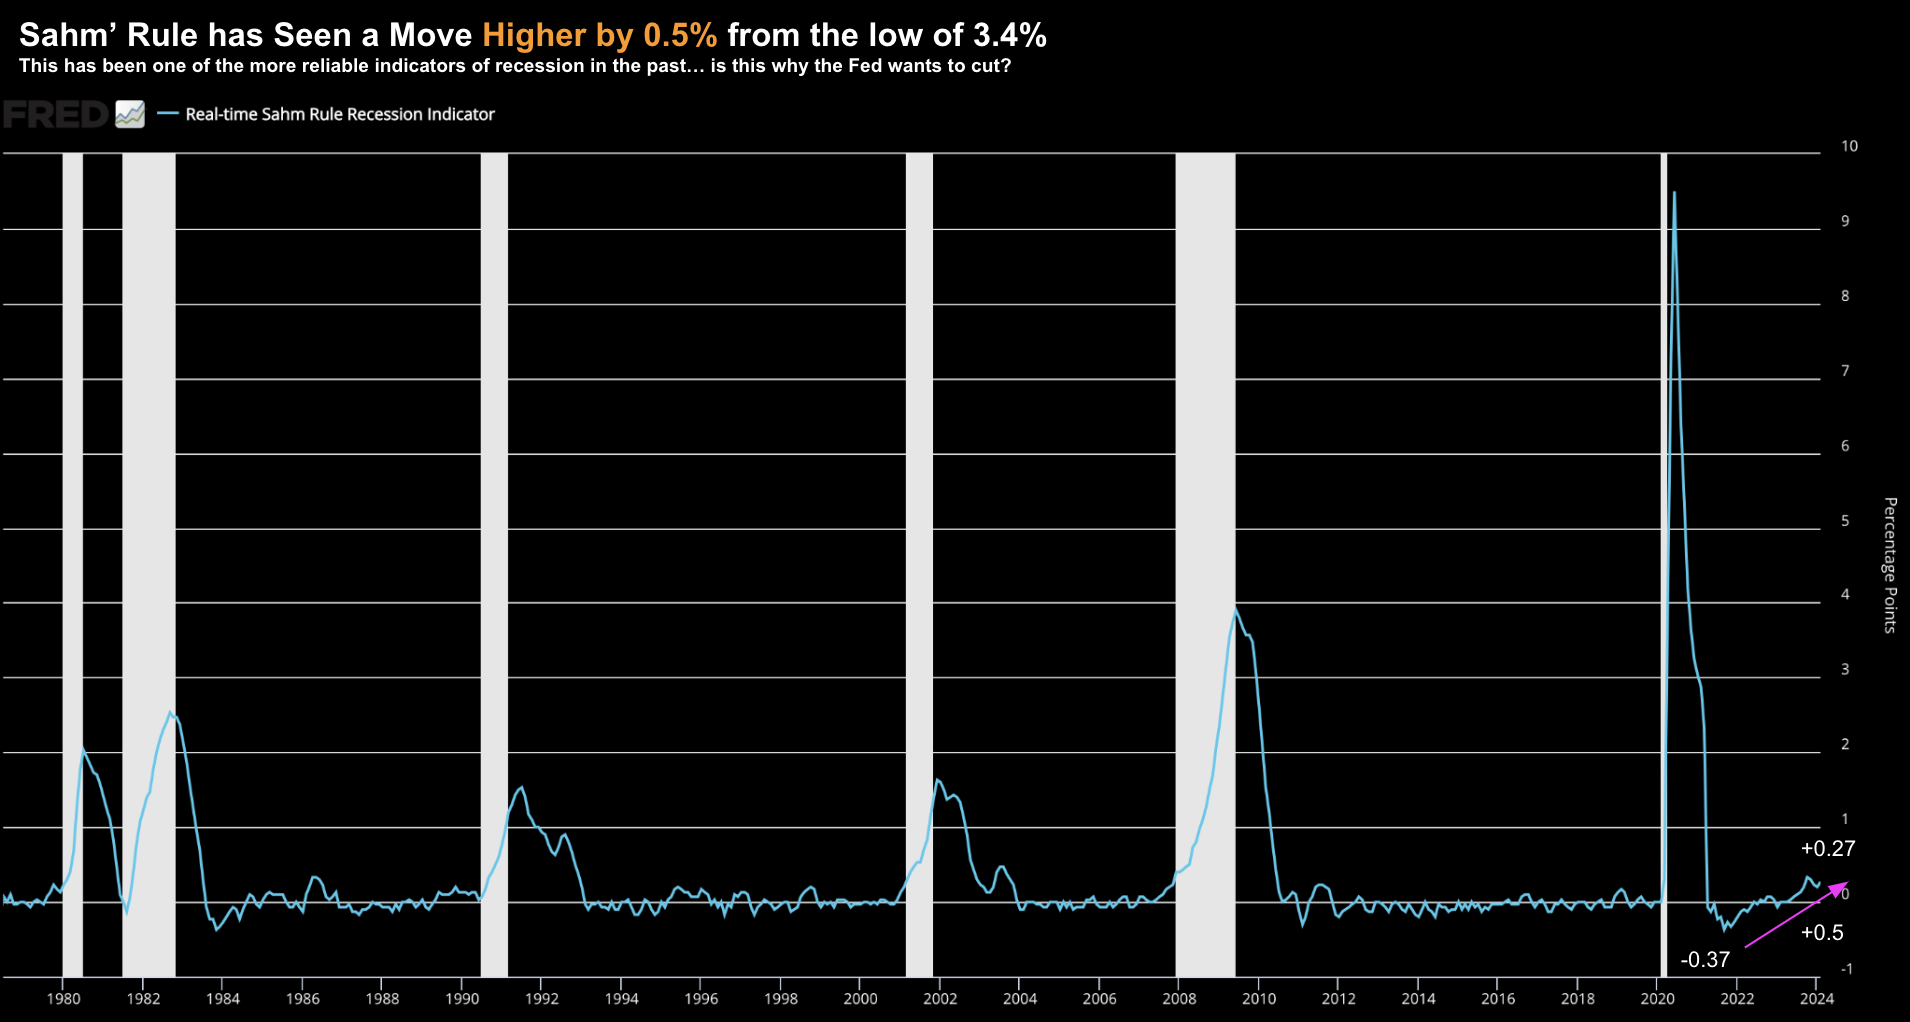
In addition, we know the U.S. unemployment rate has moved higher by 0.5% from its 3.4% low.
Which brings us to Sahm’s Rule….
Sahm’s Recession Indicator
For those less familiar, the Sahm Rule was published by the St. Louis Federal Reserve in October 2019. It is retroactively calculated to evaluate performance from past recessions. The recession rule is defined as:
Sahm Recession Indicator signals the start of a recession when the three-month moving average of the national unemployment rate (U3) rises by 0.50 percentage points or more relative to its low during the previous 12 months.
You can chart Sahm’s Rule here (pasted below for ease of reference)
March 21 2024
The Sahm Rule has received recognition by popular economics news sources because of its simplicity and low rate of false positives.
Now as we know, at the time of writing the employment picture looks strong.
And this is why most economists (including Powell) are leaning towards a so-called soft-landing.
Note – we saw very similar numbers in late 2007 where GDP was well above 2.0% for three consecutive quarters and unemployment was also extremely low.
Now if the unemployment continues to advance above 4.0% – you would have to think the Fed will be concerned.
For now, my focus is very much on the next monthly unemployment report due April 5.
Recalling our 70-year correlation:
If the Fed is cutting rates into a rising unemployment picture – that is typically bad for stocks.
Putting it All Together
As I said yesterday, the muted reaction in bond markets was more telling than what we saw with equities.
Equities are typically knee jerk and often fail to connect dots until very late.
Bond markets are the opposite.
They are generally early however more often right (hence the name “the smart money“)
But for now, there is a lot of momentum with the tape.
And I would not be trying to stand in front of it (why I have no short positions or own ‘long puts’ – both are low probability bets)
It’s very difficult (if not impossible) to know how far or when a trend will end.
I don’t attempt to guess…
But I also know that ‘trees don’t grow to the sky‘… not even the ‘AI trees‘.
And for someone like me who is only about 35% long stocks (underperforming the S&P 500 so far this year by about 5-6%) – these periods can be frustrating.
That said, I’ve been here many times the past 25 years.
This is familiar ground.
These days I maintain a healthy respect for a trend’s momentum – and the degree to which they become extended (in either direction). I also know better than to “fight the tape” (and/or aggressively chase momentum).
Par for the course.
This ‘healthy respect’ is partly why my 8-year CAGR is over 14% (about 2% better than the S&P 500 over the same period)
With that, let’s see how things go…
Keep an eye on the national unemployment figure come April 5…
Anything at or above 4.0% and my advice will be to proceed with caution in the 6-12 month’s ahead.


