- S&P 500 bounces back… double-top?
- Why are defensive assets handily outperforming the market?
- Retail sales continue to soften…
“It was the best of times, it was the worst of times, it was the age of wisdom, it was the age of foolishness, it was the epoch of belief, it was the epoch of incredulity, it was the season of light, it was the season of darkness, it was the spring of hope, it was the winter of despair.”
― Charles Dickens, A Tale of Two Cities
Crushing losses followed by exhilarating gains.
Ahhh Mr. Market… what mood will you be in next week?
After enduring its worst week since March 2023, the S&P 500 rebounded with its best performance of the year.
From mine, this kind of week-to-week unpredictability highlights the futility of attempting to predict short-term gyrations.
It’s not something I pretend to be able to do…
My approach prioritizes a longer-term perspective – as it increases the odds of success.
It’s near impossible to attempt to trade around Mr. Market – you can never know what his mood will be from one day to the next.
Therefore I choose to maintain a cautiously invested strategy – where ~65% of my capital remains in high quality stocks.
And if I felt the risk of recession was lower into next year and/or multiples were lower (e.g. closer to 18x forward) – I would increase that exposure.
Whilst I like to always be invested – the question of where to allocate your risk capital also matters.
From that lens, I’ve observed some curious trends.
‘Defensive Sponges’
Post July 10 we have watched some of the shine come off the tech trade.
That said this week some of these names enjoyed a bounce (specifically chip stocks and the Mag 7)
However, during the course of Q2, leading hedge funds reduced their exposure to the tech trade (based on their 13F filings)
And all that liquidity has been busy finding a home elsewhere.
The question is where?
This post will look at what has seen large inflows of capital… reflected by their superior year-to-date performance.
Three areas (or assets) come to mind:
- Utilities
- Gold; and
- High quality defensive stocks.
1. Utilities
Essential services that we depend on every day – are having one of the best year’s in decades.
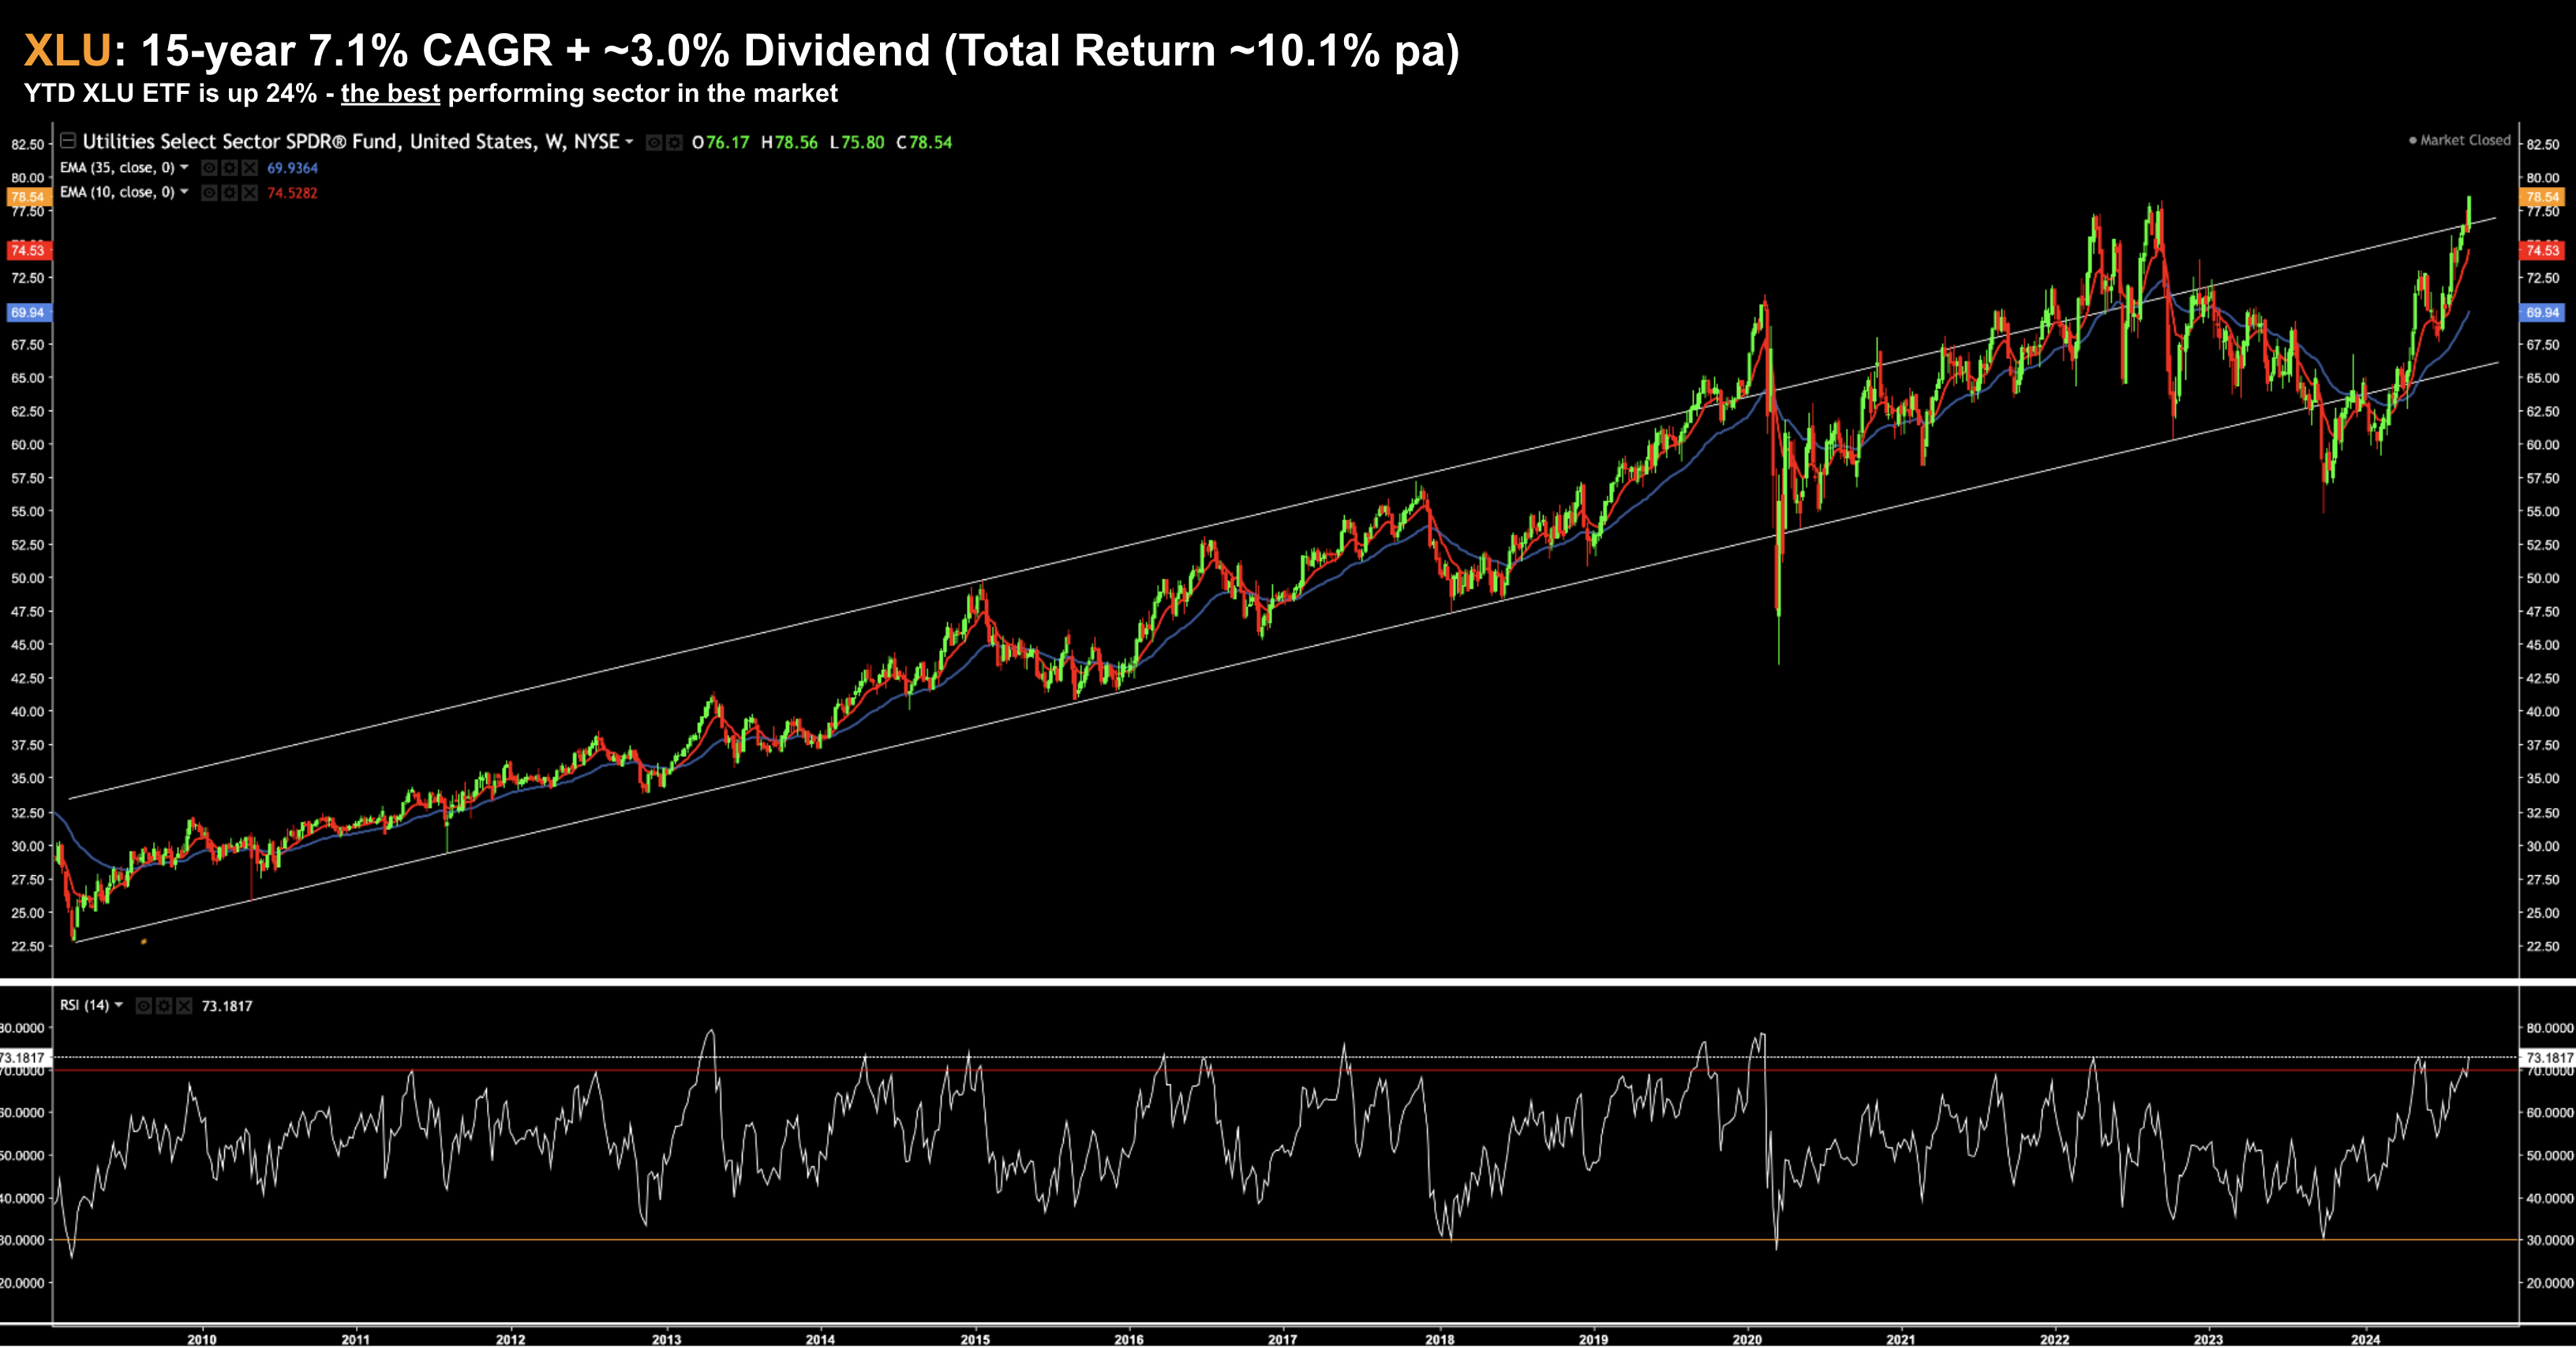
For example, the Utilities Select Sector SPDR Fund (XLU) is up ~24% year-to-date, making it one of the best sector performers.
Coupled with the ever-growing energy demands of AI data centers – it’s difficult to see why this long-running CAGR 7.1% (plus ~3.0% dividend) won’t continue.
Sept 13 2024
And with a total return of ~10%... it rivals the total returns of the S&P 500
2. Gold
- heightened market volatility
- unwanted inflationary pressures
- government fiscal concerns
- currency devaluation
- geopolitical tensions; and
- the threat of recessions
Take your pick of market ‘evils’ – as any one of these perceived risks will fuel gold’s price.
Here’s another statistic which might surprise you:
- Over the past 27 years – the shiny yellow metal has delivered a Compound Annual Growth Rate (CAGR) of 8.1%.
Again, that’s not too far behind the average long-term total return of the S&P 500 of around 10.5%
However, so far this calendar year – the gold bugs are smiling – as the precious metal is up 29%
Sept 13 2024
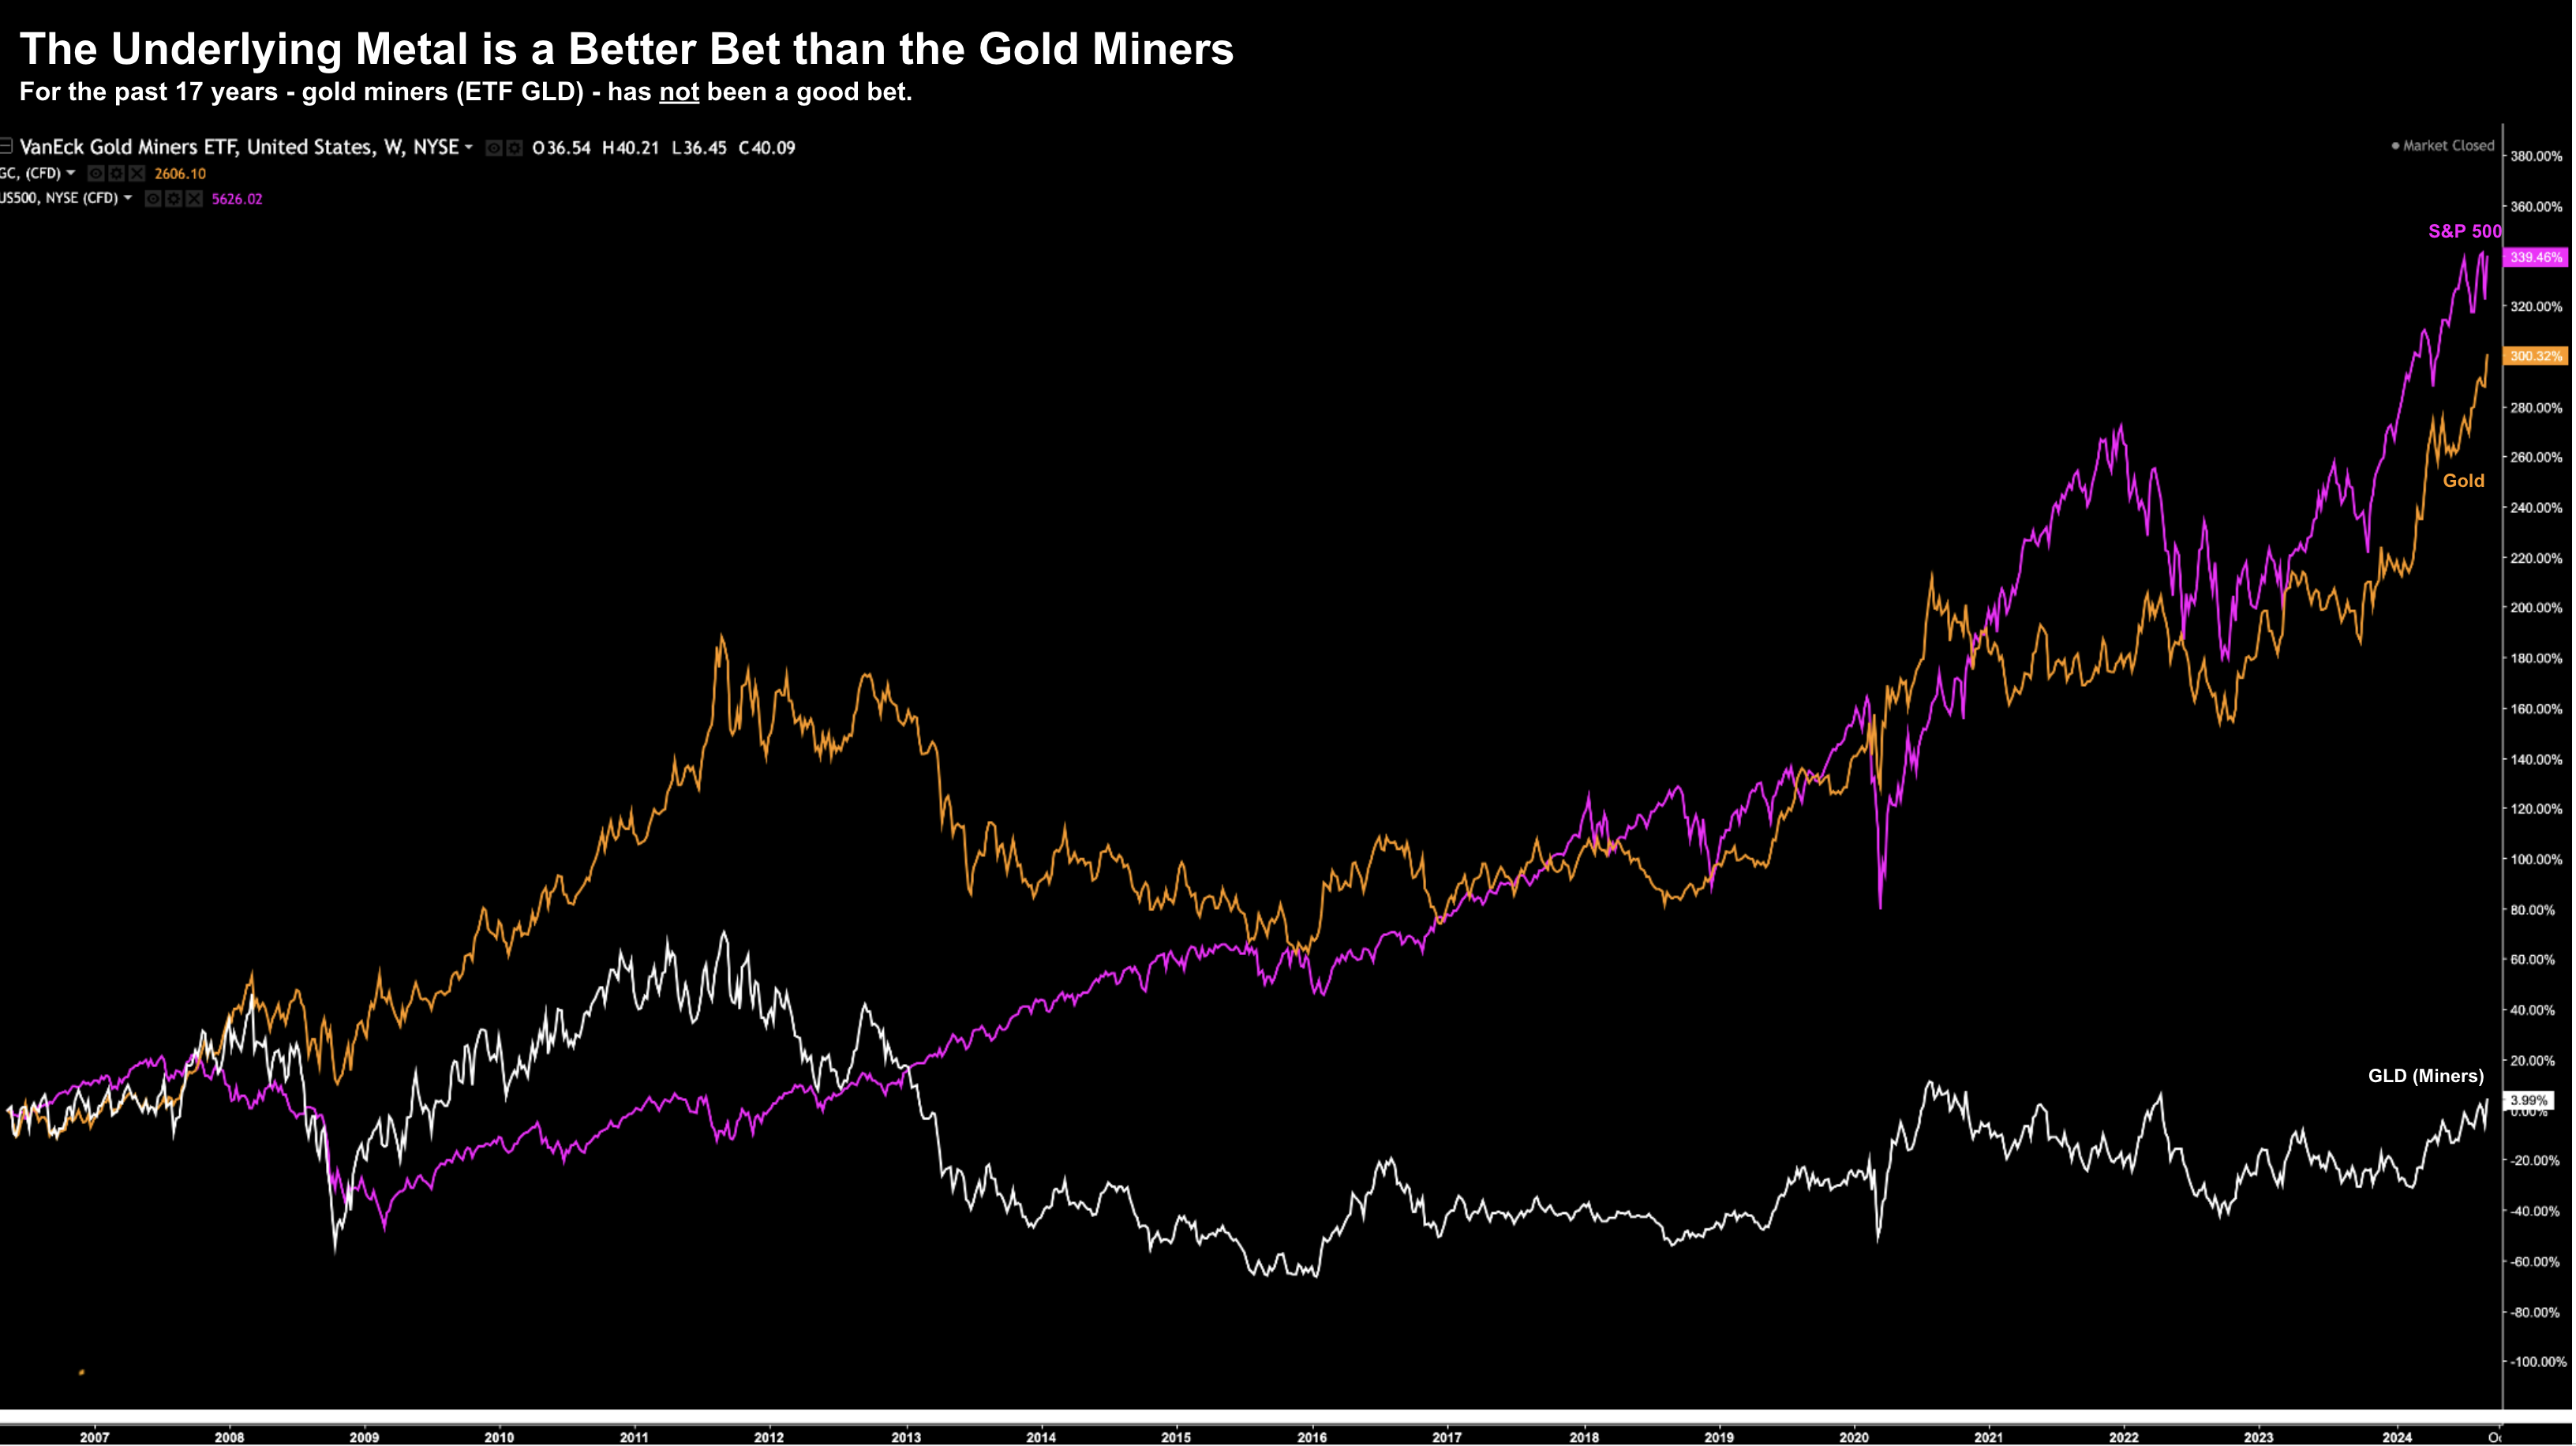
Despite the impressive long-term performance for the underlying metal – the same cannot be said for gold miners.
For example, if comparing the ETF GLD (‘Gold Miners’) vs the Gold – owning the miners has been ‘dead money’ (white line).
Sept 13 2024
That said, this year some of the long-suffering gold miners have caught a strong bid.
3. High Quality Defensive Names
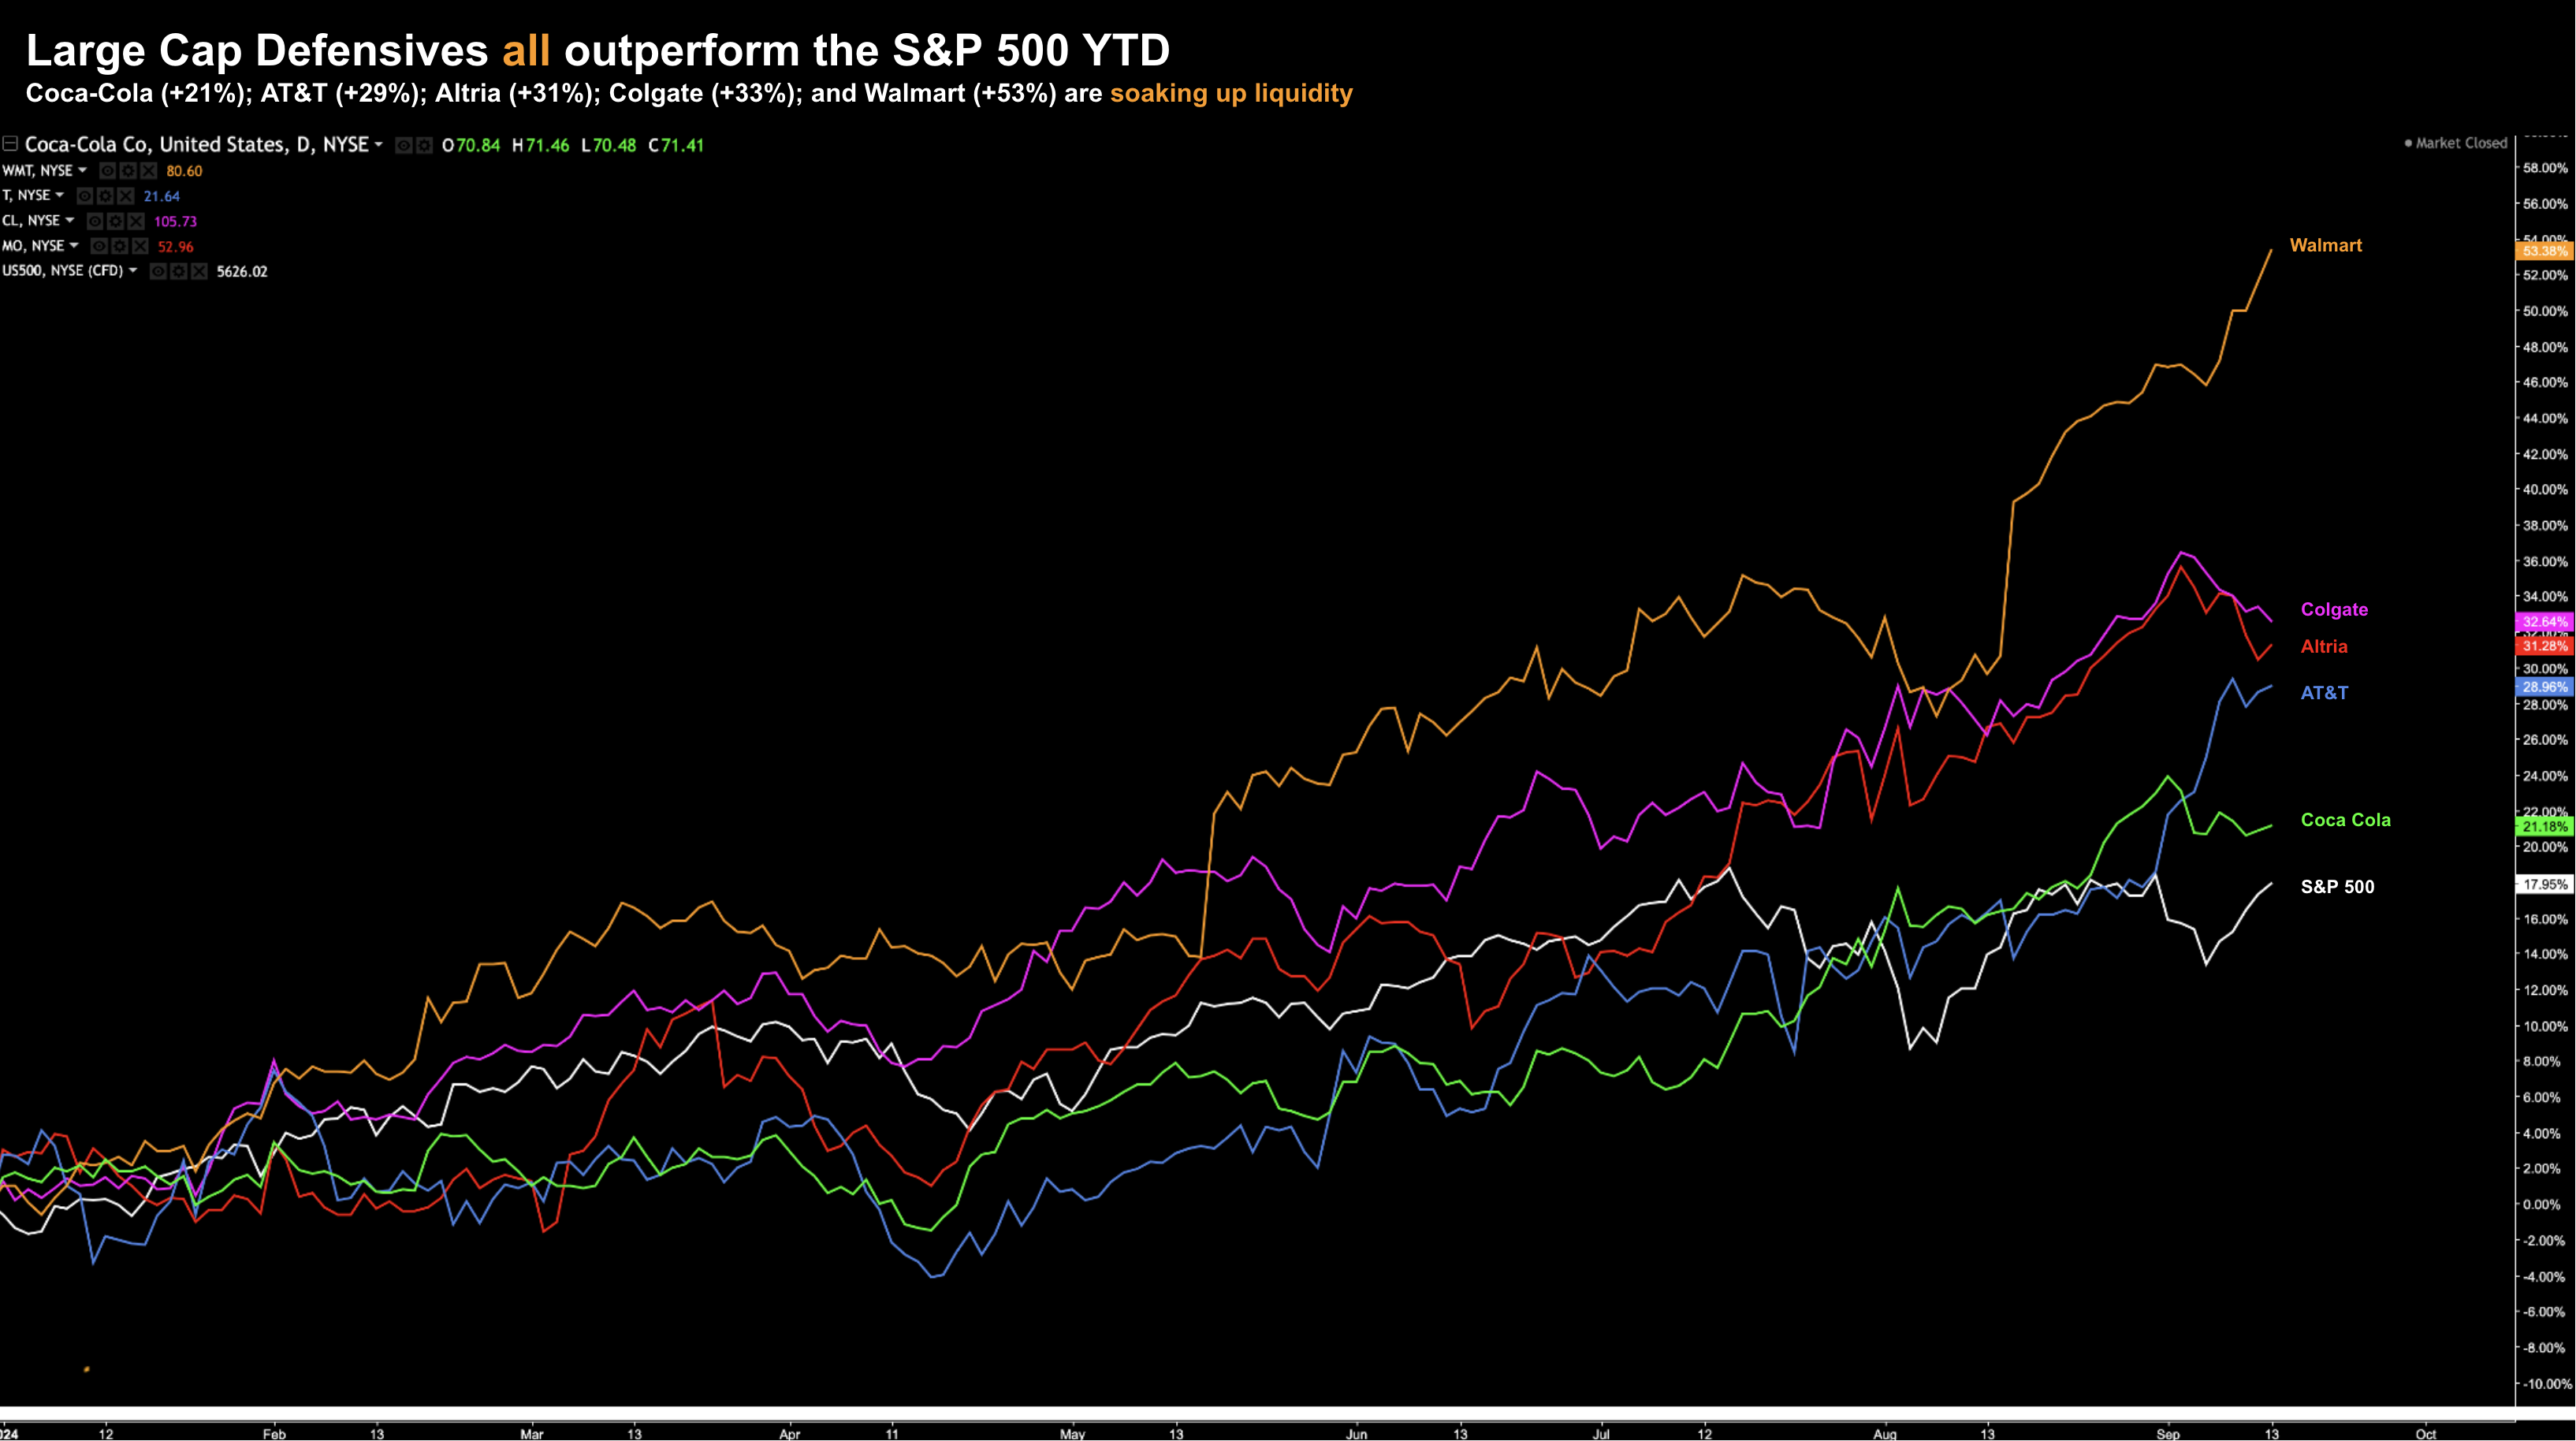
The third ‘asset class’ to attract capital this year has been the flight to large cap (high quality) defensive equities.
Consider the following (this list is not intended to be exhaustive).
- Coca Cola (KO)
- AT&T (T)
- Colgate Palmolive (CL)
- Altria (MO – formerly Phillip Morris); and
- Walmart (WMT)
Similar to utilities and gold – each of the above has handily outperformed the S&P 500 (white) YTD (with Walmart the standout)
Sept 13 2024
What each of these charts highlight is money is moving towards safer assets.
Why?
For example, if we are headed for a ‘soft landing’ – then why are these assets performing so well?
And why is gold up almost 30% this year?
For example, wouldn’t the money be better served in higher risk assets if growth is set to continue (and theres no risk of recession)?
My best guess is two-fold:
- Tech valuations were too high to justify the risk; and
- There remains a sense of caution with asset allocation.
Utilities, gold and higher-quality defensive names will do well in any environment.
And perhaps this is why money has been flowing in that direction?
At the end of the day, we’ll still need food, communication, internet access, energy, and perhaps a comforting beverage (maybe even a cigarette) even during a downturn.
And gold?
Well if the government continues to borrow and spend recklessly (and I don’t see why it won’t) – gold is a great hedge.
S&P 500: Surges Back
Coming back to my opening opening preface quoting Dickens…
The S&P 500’s rebound this week surprised most (including myself) – however it is September.
It was only last week I said expect a “bumpy” ride… with many more volatile weeks ahead.
You only need to look at the length of candles over the past few weeks as a measure of how uncertain the market is.
From mine, this is a market in transition…
Sept 13 2024
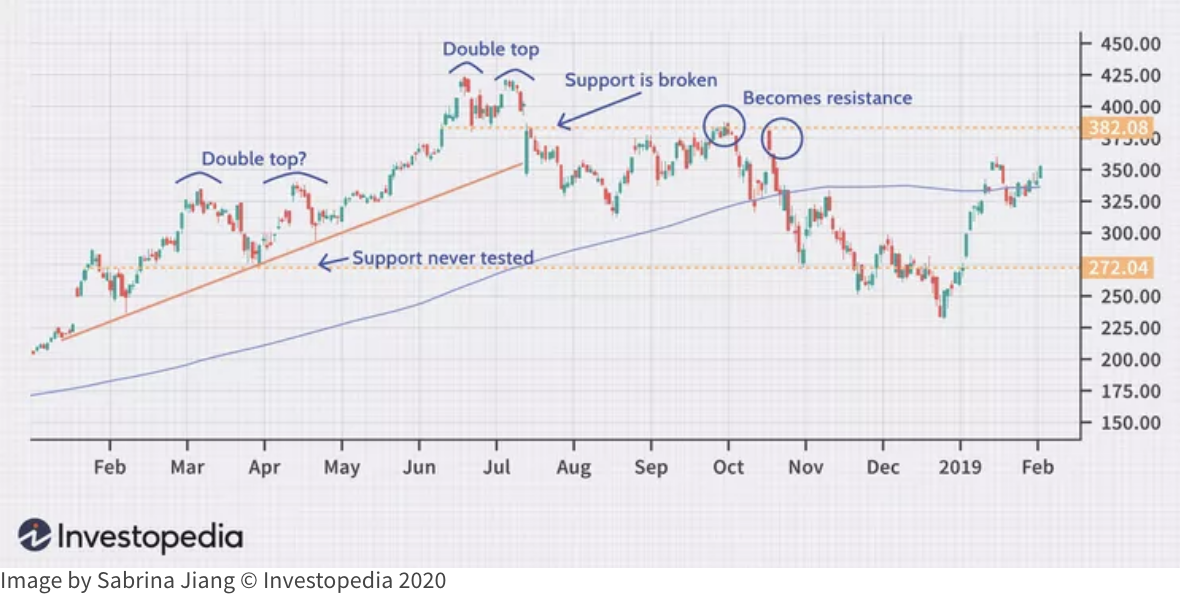
Looking at the chart, I suspect that technical analysts will be watching for a potential “double-top” pattern.
This is where the market rallies to its previous high, encounters resistance, and then sells off. Investopedia.com offers a useful example :
Now it’s impossible to know if a double-top will eventuate… we will only know post the fact.
For example, look at the example above and the ‘double top’ between March to May. It failed to re-test the support line.
And from there, it continue to rally.
That could happen today…
However, if we look at the second double-top between June and July – it broke through support and proceeded lower.
Looking at the S&P 500 today – that “support line” is around 5100 (which is a lot lower)
If that should break – the double-top suggests we could be headed down.
Now given the lofty valuations – this remains a possibility in the event we get more bad economic news.
For example, consider the following ‘defensive’ valuations:
These forward price-to-earnings (PE) ratios more akin to (high growth) tech companies.
A multiple of “24x” (or above) is high for a company that generates single-digit revenue growth.
What the charts (and multiples) suggest to me is these defensive plays have become “liquidity sponges” that may be nearing saturation.
Putting it All Together
Next week, the Federal Reserve will decide to cut rates.
The only debate is whether it will be a 50 or 25 basis points?
As I shared here – I believe a 25 bps cut is more likely. However, 50 cannot be ruled out.
But will 25 disappoint a half of the market?
It could.
Personally, I’m less concerned about the Fed’s decision – but I will be listening for any nuances.
For example, what do they see further out?
Irrespective, my focus remains on longer-term consumption trends reflected in Real PCE (Real Personal Consumption Expenditures).
While I’ll monitor the (slowing) employment situation – I prioritize leading indicators like Real PCE (vs lagging indicators such as employment).
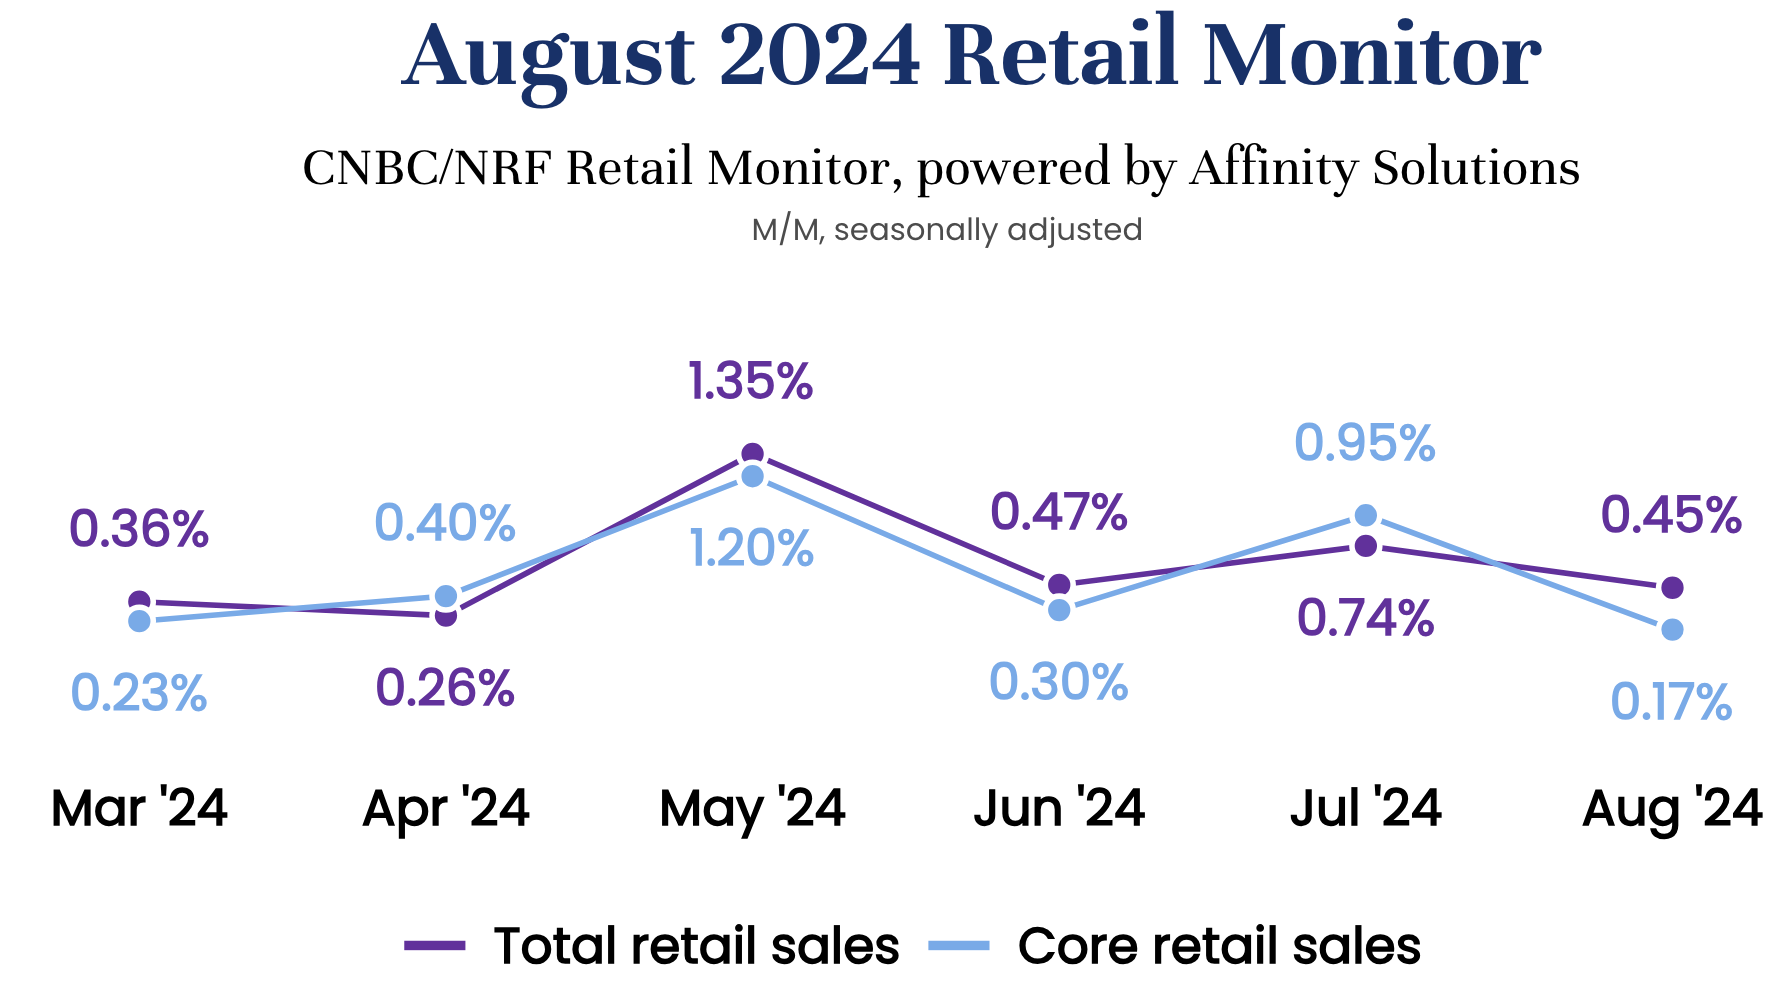
And today’s retail spending data suggested spending continues to slow:
According to the CNBC / NRF Retail Monitor – core retail sales rose only 0.17% month-over-month
That’s sluggish…
Weaker consumption will threaten revenue growth and in turn profit margins.
And as I said during the week, earnings per share growth will likely come from further cost reductions.

