- Have we seen ‘peak’ large-cap tech this cycle?
- What the average investor doesn’t typically do
- The indicator which will drive the Fed to cut rates
Selling is harder than buying.
I made a decision to reduce my exposure to large-cap tech a few months ago.
The decision wasn’t an easy one… these are extremely high quality stocks. And there are few better…
For example, did I sell prematurely?
Maybe.
The answer will be more obvious in 6-12 months when the cycle has had sufficient time to play out.
For now (as was the case when I sold) – I think the downside risks meaningfully outweighed further upside gains.
Put another way, I think most of these names are over-valued. I will add back exposure at better prices.
In this post, I explained how selling is a way of managing your risk.
I was ensuring I banked the appreciable gains realized over the past few years.
In light of the rotation out large-cap tech we’ve seen this week – I thought it was opportune to share some thoughts on:
- how I calibrate my portfolio in a changing environment;
- when to be aggressive and when to play defense;
- the importance of identifying (business) cycles; and finally
- the role our emotions play in these decisions (e.g., notably fear and greed).
For me, a successful investor is one who is mature, rational, analytical, objective and unemotional.
The first four characteristics are arguably easier to master. However, emotions can be very difficult.
But it’s something you will need to conquer if you are to be successful in this game.
Understanding the Game
“I want to think about things where I have an advantage over others. I don’t want to play a game where people have an advantage over me. I don’t play in a game where other people are wise and I am stupid. I look for a game where I am wise, and they are stupid. And believe me, it works better. God bless our stupid competitors. They make us rich.”
— Charlie Munger
The game of asset speculation is preparing for the financial future.
And most of us are playing the game in some fashion (even if it’s simply exposure via your retirement fund).
Therefore, it’s within your interest to have an advantage.
Today I will offer how you can gain one.
But first, we buy speculative assets (e.g., property, stocks, bonds, precious metals) on the basis we will benefit from a rise in their future value.
However, with respect to stocks (the focus of this blog) – it’s about beating the benchmark average.
That benchmark is the S&P 500 Index – which boasts a long-term (50+ year) annualized return of ~10.5% (including dividends)
But beating a CAGR (Compound Annual Growth Rate) of 10.5% consistently over a long period is difficult.
It also means doing something different from the average investor.
And typically, it means going against the crowd.
Quite often, it means taking the opposite trade. For example, that could mean selling large-cap tech when everyone else is buying (something I will expand on shortly)
In addition, in the short-term (e.g. 6-12 months) it can easily make you look foolish. Not many people are willing to do that.
Let me frame it another way…
If you constantly invest with the crowd, then you should expect average performance.
Doing something different means doing three things well:
- Determining what is knowable (e.g., the work required to understand the fundamentals of companies);
- Apply discipline as to what you are willing to pay for those fundamentals; and third
- Understanding the investment environment we’re in and positioning for it (which could include things like fund flows; the momentum trade and other factors).
The first two themes fall under the category of securities analysis – where there is no shortage of information available.
Here it’s a case of educating yourself and doing the work.
For example, you should be able to explain why you think owning “Apple at 32x forward earnings” represents very good (or discounted) value etc.
With respect to the environment, that can be a little more difficult to conquer.
But how you interpret the environment will also dictate how aggressive or defensive you are with your positioning.
For example, if interest rates were 1%, maybe owning stocks at “22x” forward is the right play etc. Risk is probably in your favour.
Today for example, I remain defensive with only ~65% of my portfolio long risk assets.
My objective is to be more aggressive when I believe assets are cheap.
I get defensive when they become expensive.
For example, with the S&P 500 trading at more than 21x forward earnings – and the risk free 10-year at 4.20% – that’s expensive.
Investors are receiving zero risk premium to own stocks.
Generally, I would like that to be in the realm of 2-3% or more.
And whilst we can never know what will happen in the future – what I am trying to do is tilt the odds more in my favour.
For example, quick math tells me zero risk premium means the odds are very much against me.
Which is a nice segue to the payoff from understanding (economic) cycles.
Coming back to Charlie Munger’s quote about having an advantage – this is where the average investor is at a disadvantage.
For example, they either:
- don’t know about their nature or importance of cycles;
- have not played the game long enough to experience cycles;
- don’t read about financial history and lessons from cycles;
- see the environment as isolated events rather than a series of
- repeatable patterns or cause-and-effect; and most important
- do not understand how cycles can help you identify opportunity and risk.
Those who play the game well and are attentive to cycles.
This is your opportunity to create an advantage.
And for clarity – a cycle will apply to stocks, inflation, employment, housing, spending or GDP… it doesn’t matter… they apply to most walks of life.
They identify past patterns and cause-and-effect scenarios (n.b., I’ve shared various examples on consumer spending as a leading indicator the economy)
From mine, doing this successfully will:
- increase the probability of knowing if you at the beginning of an upswing or late stages;
- if a cycle has been rising for a while and whether it’s gone too far;
- identify whether the emotions of fear and greed are driving things;
- whether the market overheated or frigid; and finally
- answer whether we should be positioned defensively or aggressively.
The Business Cycle
The famed investor Howard Marks talks to why this matters in his book “Mastering the Business Cycle”
Add this to your must read list (which I will update at the end of the year)
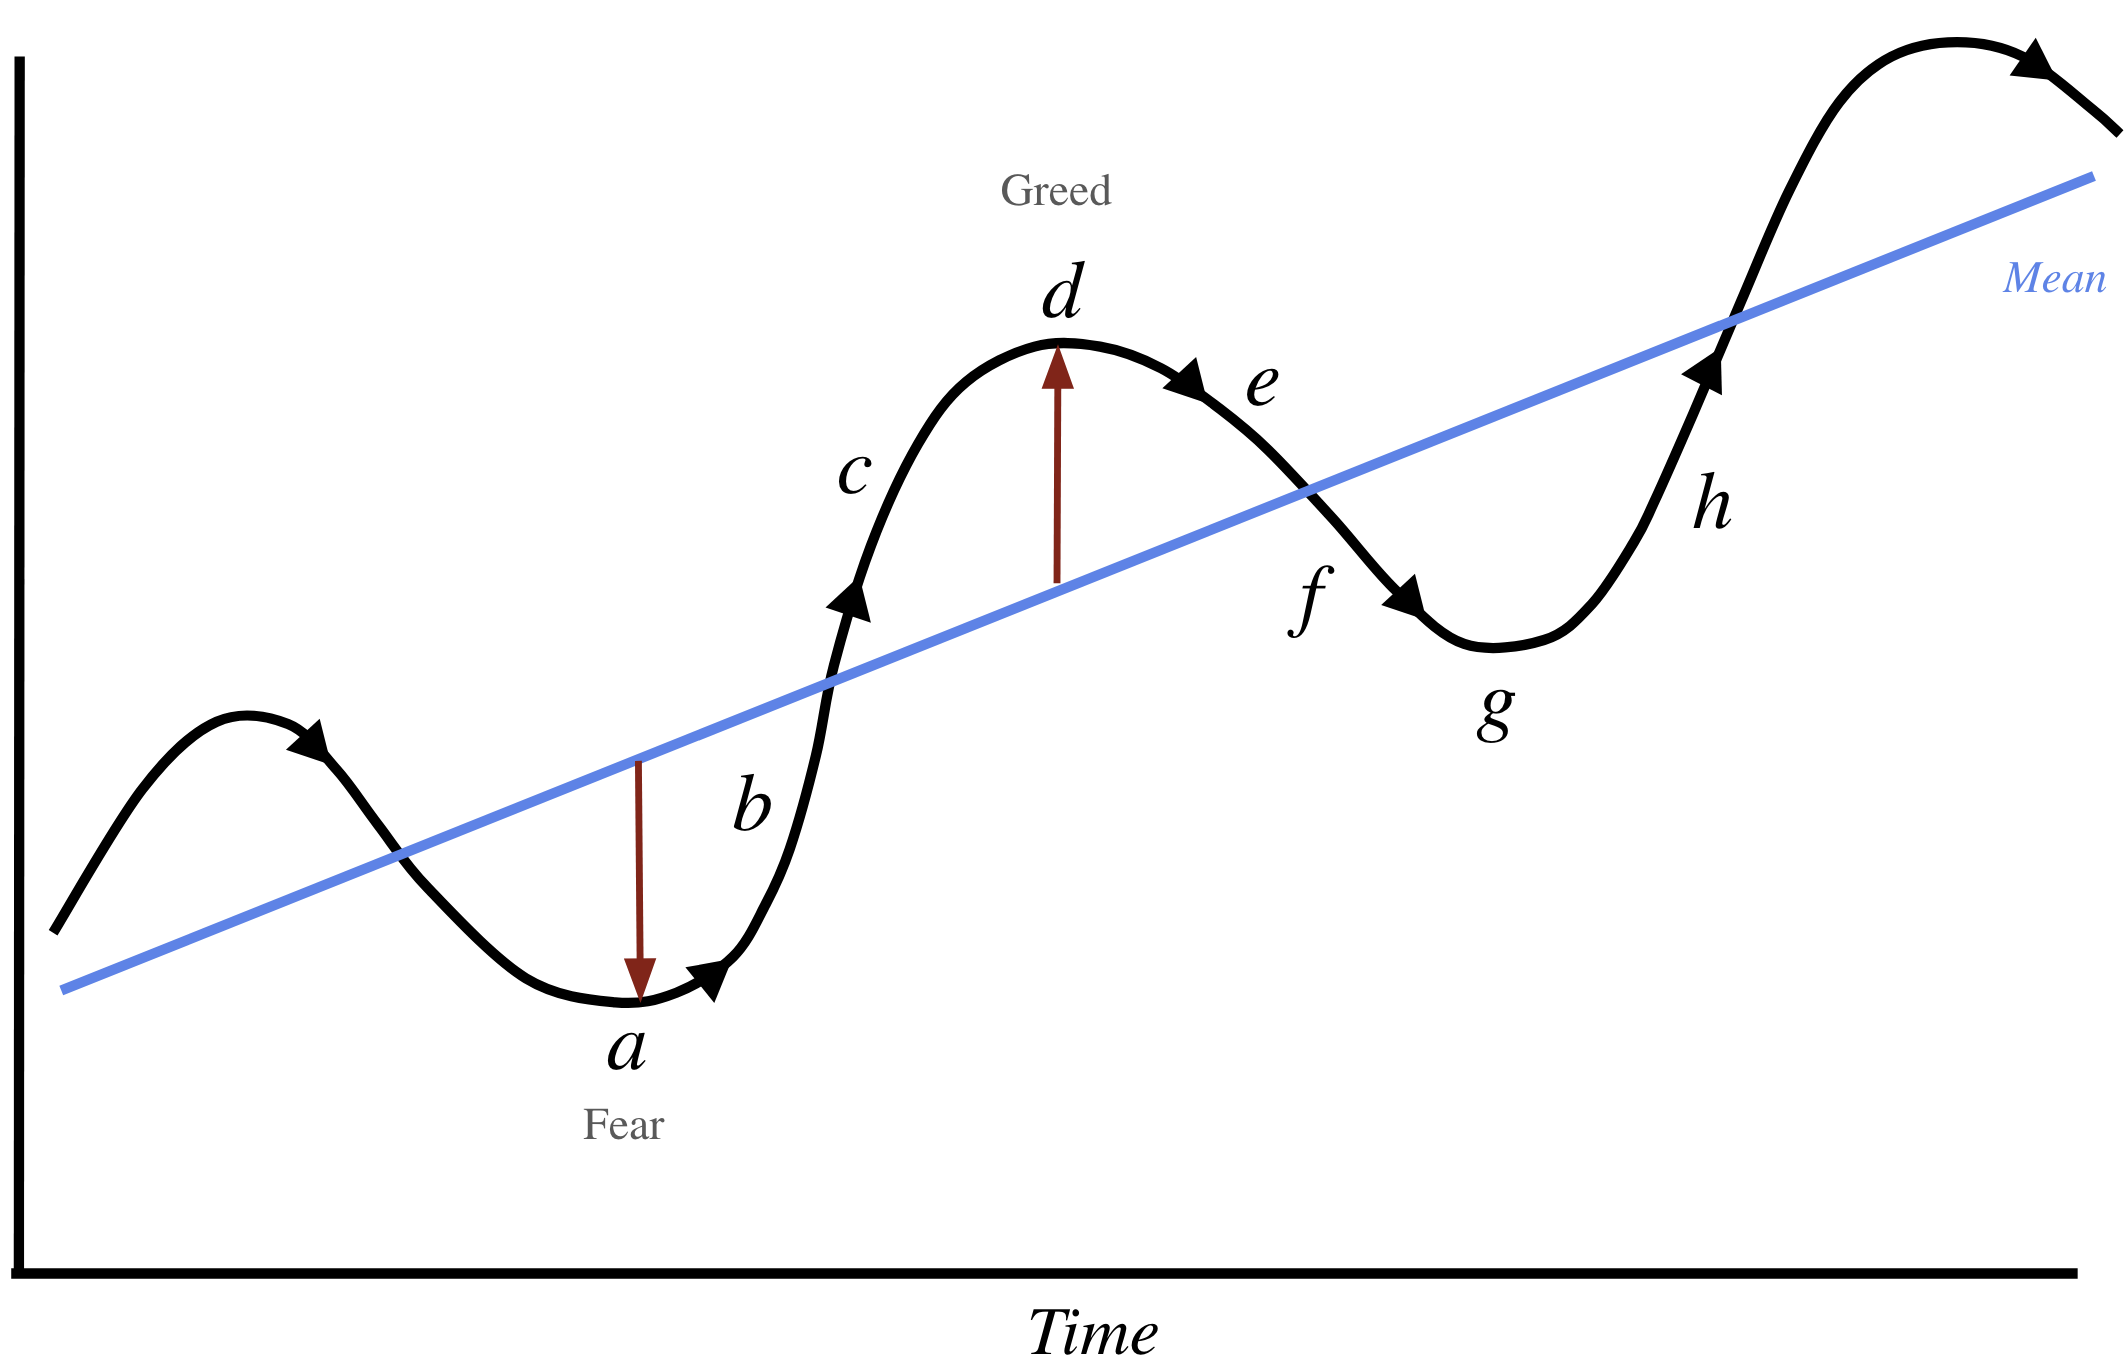
He offered the following diagram:
Using Marks’ diagram – let’s consider an example.
Let’s take the economy…
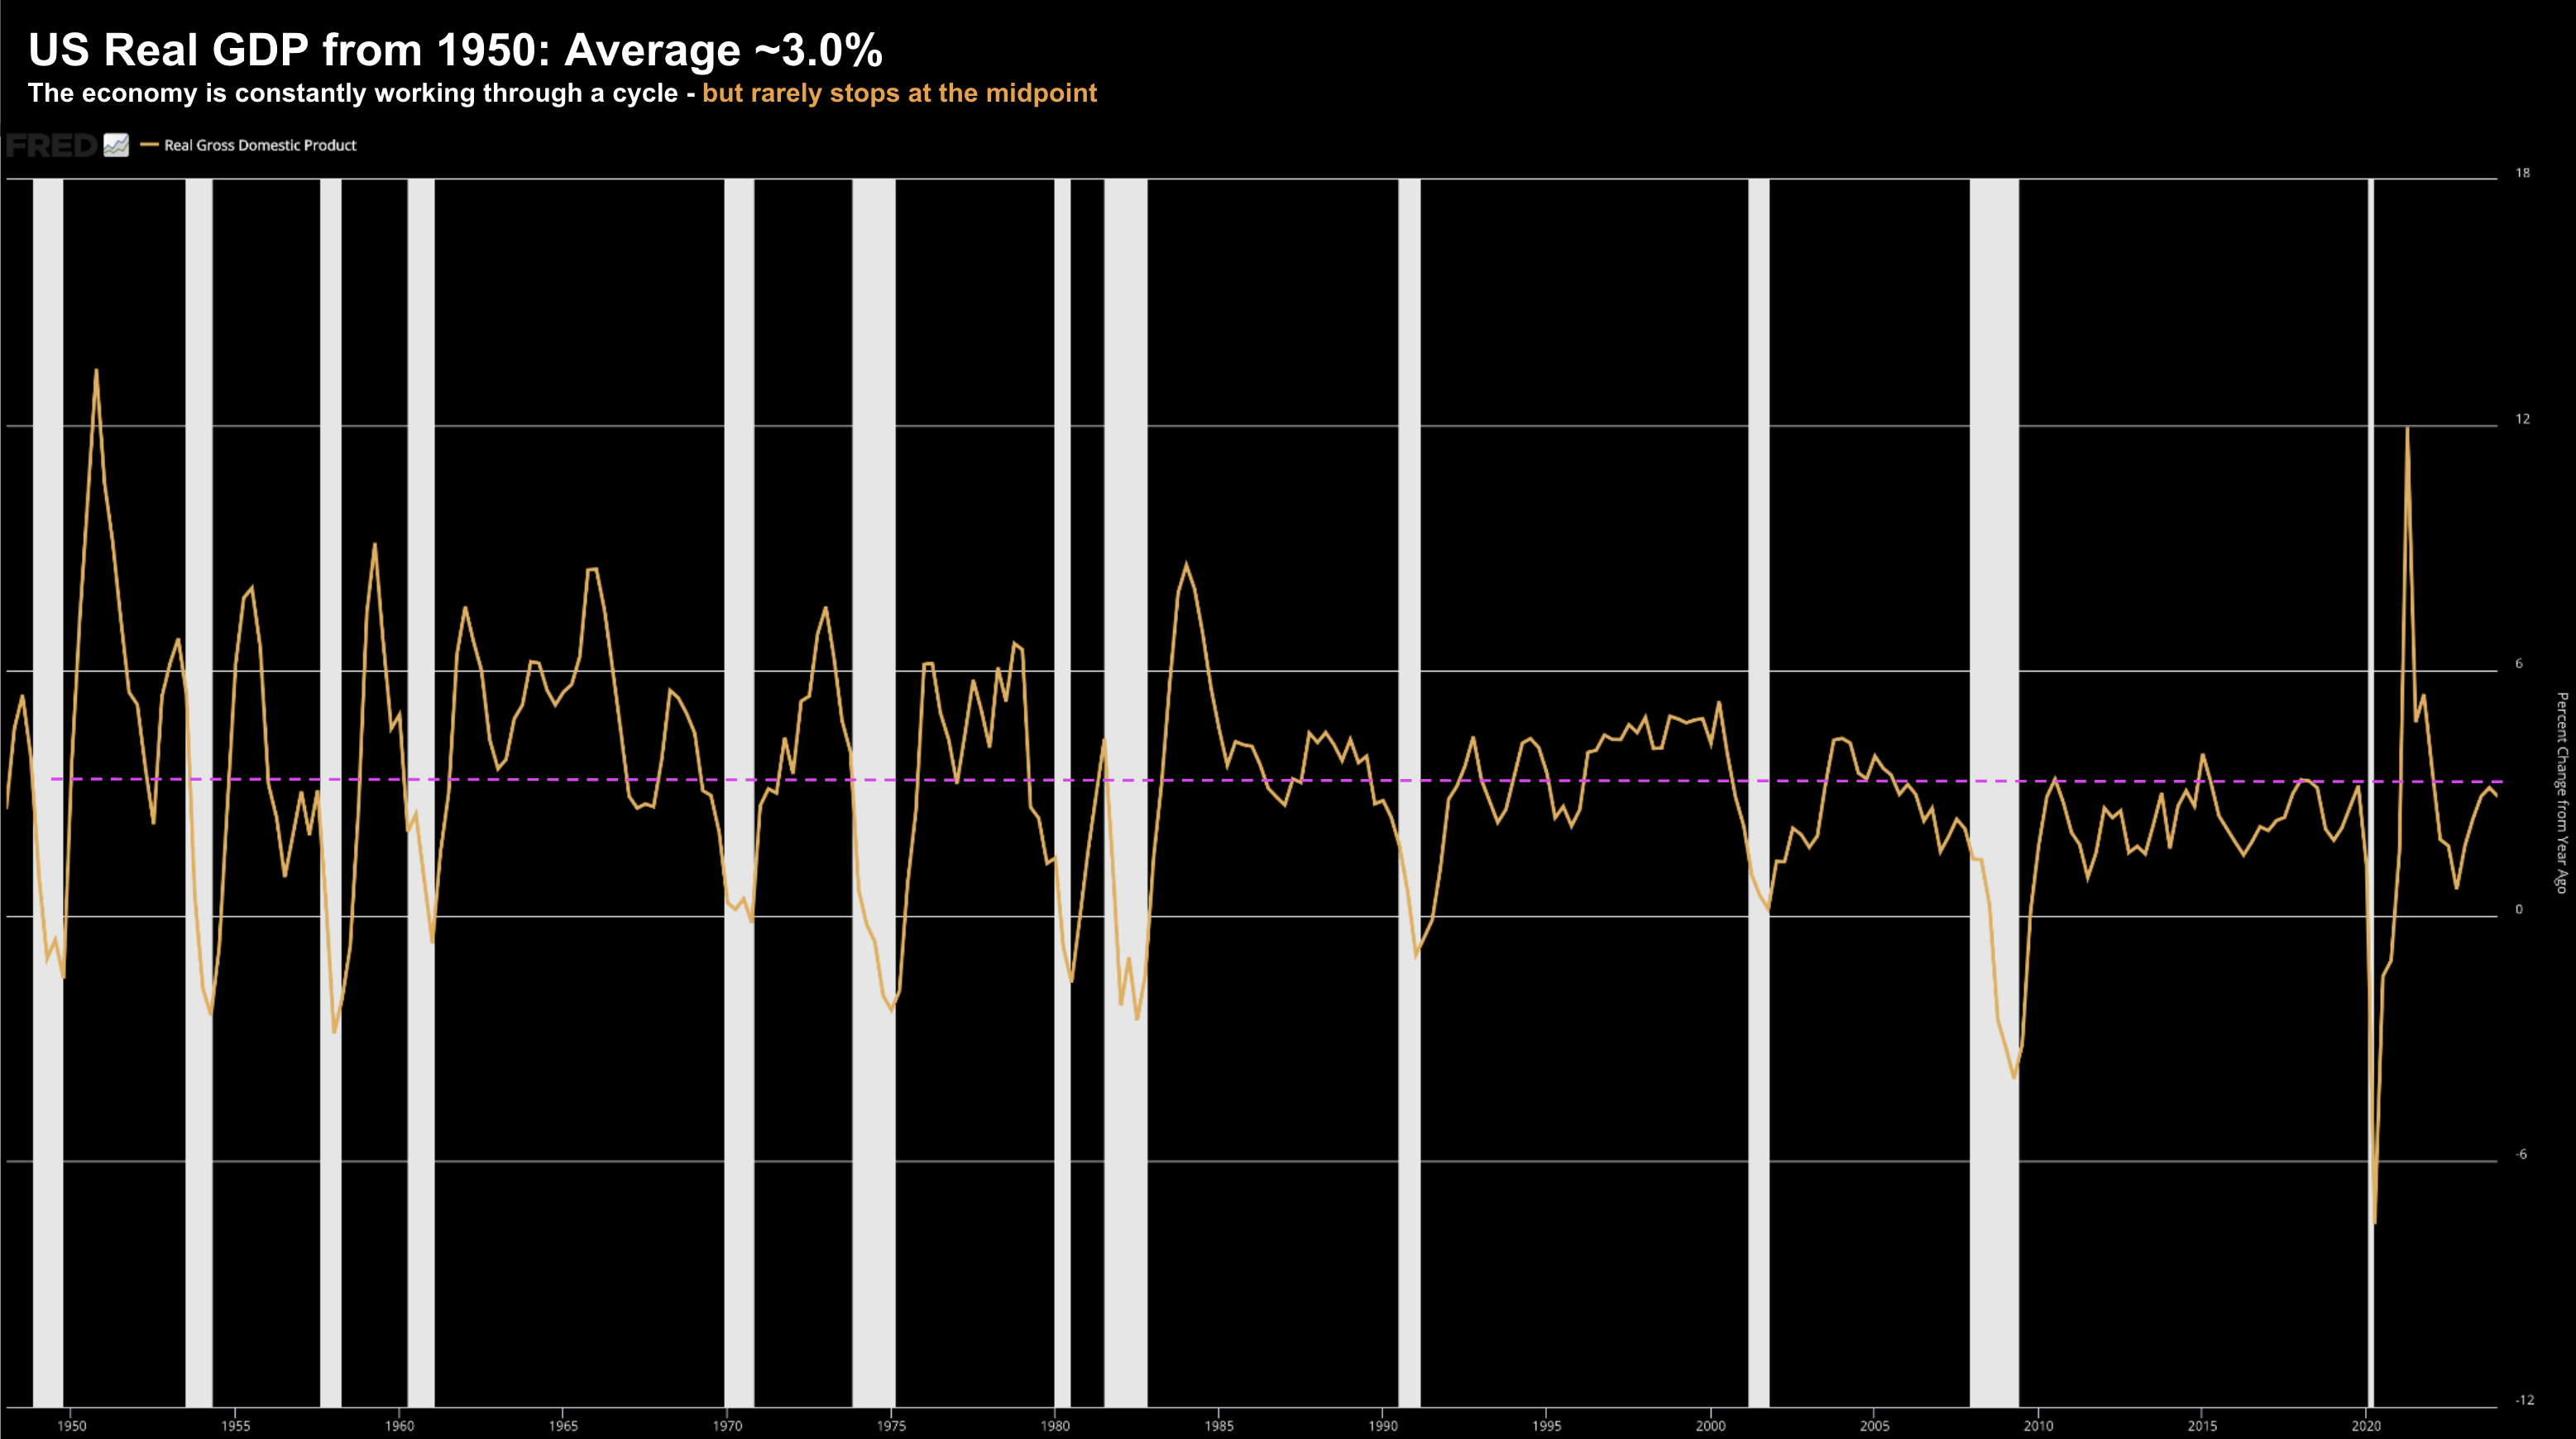
Over time, Real Gross Domestic Product (GDP) will expand (on average) around 3.0% per year (see pink line below). This is what we have seen for the past 80 years…
From 1950, when the US economy was thriving, its growth exceeded 5-6% per year.
When GDP is this strong – everyone is bullish.
Employment is typically very strong, corporate profits are soaring, and there’s little to worry about.
And no-one is talking about a recession. 1999 and 2007 were two very recent examples (however GDP didn’t quite get to this level)
This phase is represented by point “d” on Marks’ diagram (“greed”)
But then growth worries begin to surface…
Consumers pullback on spending; hiring starts to slow; and there’s talk of rate cuts.
At this point, we move from “d” (excessive optimism) to “e” (the midpoint or mean).
When the economy slows to the point of recession – GDP declines around 2-3% – and there’s widespread fear.
This is point “a” – characterized as a feeling of complete despair and nothing will ever get better.
Talking heads on the TV will tell you to “… sell all your stocks now before they go to zero”
But inevitably – things slowly start to recover – people feel less bad – and we trend back towards the midpoint.
The mean acts like a gravitational pull.
Put another way, it never approaches ‘escape velocity’ from either side (as some tend to think.
For example, the average investor will not think twice about buying at “d” (e.g., thinking trees grow to the sky); however they also panic at “a” (thinking if they don’t sell now – they will lose everything)
The savvy investor on the other hand – the one with the advantage – will be taking the other side of the trade.
What’s more, their emotions won’t come into it. There is no sense of panic when everyone is scrambling to sell.
And they’re not afraid to reduce exposure when everyone is buying.
But there’s something else which is important…
When we move back towards the mean from either side – rarely do we simply stop at the midpoint.
In fact, the cycle will spend very little time at the long-term average.
What typically happens is the cycle’s momentum will continue to the next point.
The Cycle of Rates
Understanding the nature of cycles is critical to everything we do.
As I mentioned earlier, it equally applies to macro variables such as interest rates (which I will demonstrate shortly), inflation, wages and consumer spending.
Consider today’s macro environment:
- Inflation was well above its 50-year mean (hitting 9% YoY) – however is working its way back to its mean b/w 2.0% to 3.0%;
- Unemployment was at 50+ year lows (3.5%) – but is now working its way back higher (now at 4.1%)
- Interest rates were artificially low ~0% in real terms for the past decade or more – they too are working their way back to the mean; and
- Consumer spending was excessive the past two years (enabled with $2.0T in government handouts) – now it’s normalizing.
These cycles are all easy to identify.
What’s more, if you can understand where we have been, it helps to understand where we are going.
Consider rates…
The 53-year 10-year yield average is 5.85% (historical yield data here)
At the time of writing, the 10-year trades at ~4.20%
For those who are not students of history (or take the time to look at longer-term trends) – they will suggest interest rates are “high” today.
That’s only true if your frame of reference is the past 25 years.
Repeating what I said earlier… the average investor tends to exhibit the following:
- don’t know about their nature or importance of cycles;
- have not played the game long enough to experience cycles;
- don’t read about financial history and lessons from cycles;
- see the environment as isolated events rather than a series of repeatable patterns or cause-and-effect; and most important
- do not understand how cycles can help you identify opportunity and risk.
Historically rates are not high.
In fact, my lens is the 20-year era of ultra-low rates is finished.
And the next two decades will look nothing like the previous two (in terms of capital being basically free)
For example, when 10-year yields were trading below 3.0% (2009 to 2022) – bond investors were at point “d” in our cycle.
Investors were (foolishly) falling over themselves to buy bonds (at paltry yields)
I called it “picking up pennies in front of a steamroller” – happy paying any price.
But they were essentially ignoring the longer-term cycle…
Any chart would tell that a rate of below 2.0% on the 10-year was an extreme aberration. It was a bond bubble.
In other words, at some point our stretched rubber band was going to snap back.
It turns out some prominent banks (and bond investors) were literally steamrolled.
(Note – Bond prices trade inversely to their yields. E.g., if yields are low – investors are bullish bonds)
These yields are now reverting to the longer-term mean… which sent bond prices tumbling.
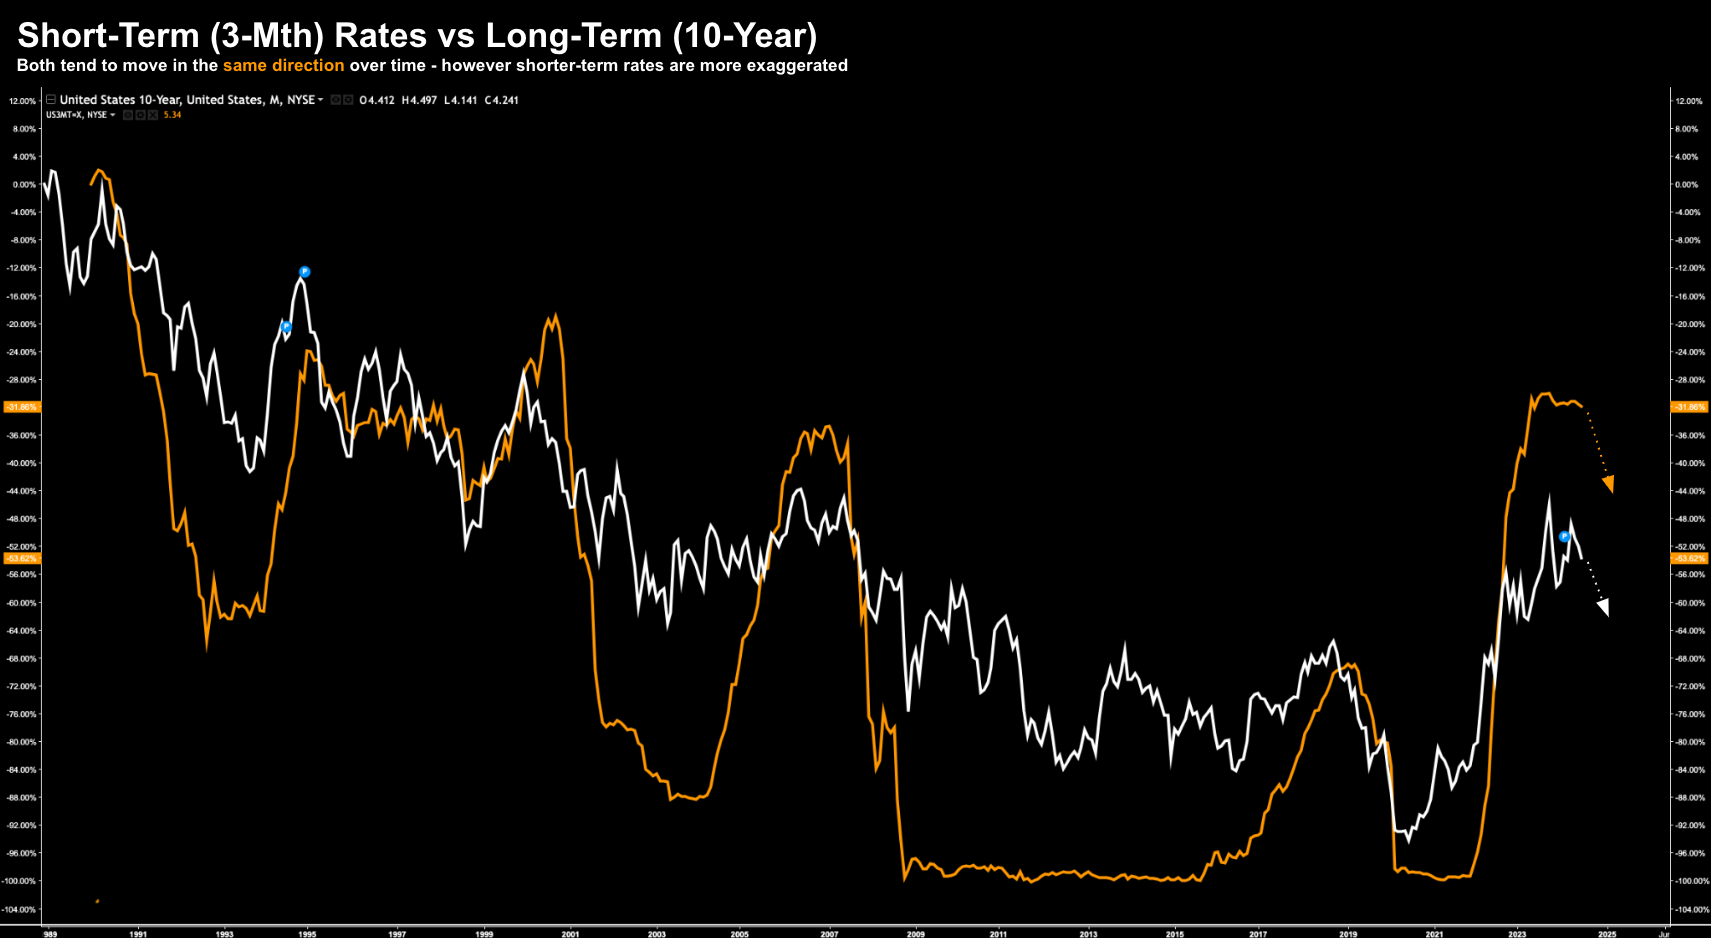
Let me offer a chart:
Using this timeframe, we’re better able to visualize the strong correlation between shorter and longer-term rates.
Whilst short-term rates (orange) are typically more volatile – both tend to move in the same direction over time.
For investors – this is important.
For example, on the assumption the Fed is set to commence an easing cycle – it follows longer-term yields will likely follow suit.
What investors need to ask is what’s the catalyst?
In other words, we can see where we are in the cycle, but what’s going to take us there?
Cause & Effect
It’s widely accepted the Fed is likely to cut rates in September (and possibly again in December)
For example, if we look at the CME’s FedWatch Tool – it has the probability of a September rate cut at 93.5%.
Fast forward to December – they see a 50% chance of 3 rate cuts.
Given the softening in the labor market – where unemployment has risen from 3.5% to 4.1% – this gives the Fed scope.
In addition, they might also see risks to growth stalling.
For example, the Atlanta Fed expects Real GDP to grow an anaemic 1.5% for Q2 (half its long term average)
Both of these things will weigh on the Fed’s decision…
However, the primary driver for any rate cut will be what we see with inflation.
This is the strongest ’cause-and-effect’ link with Fed policy (and by extension – longer-term rates).
Again, let’s revert to the cycle (identifying any possible cause and effect):
July 19 2024
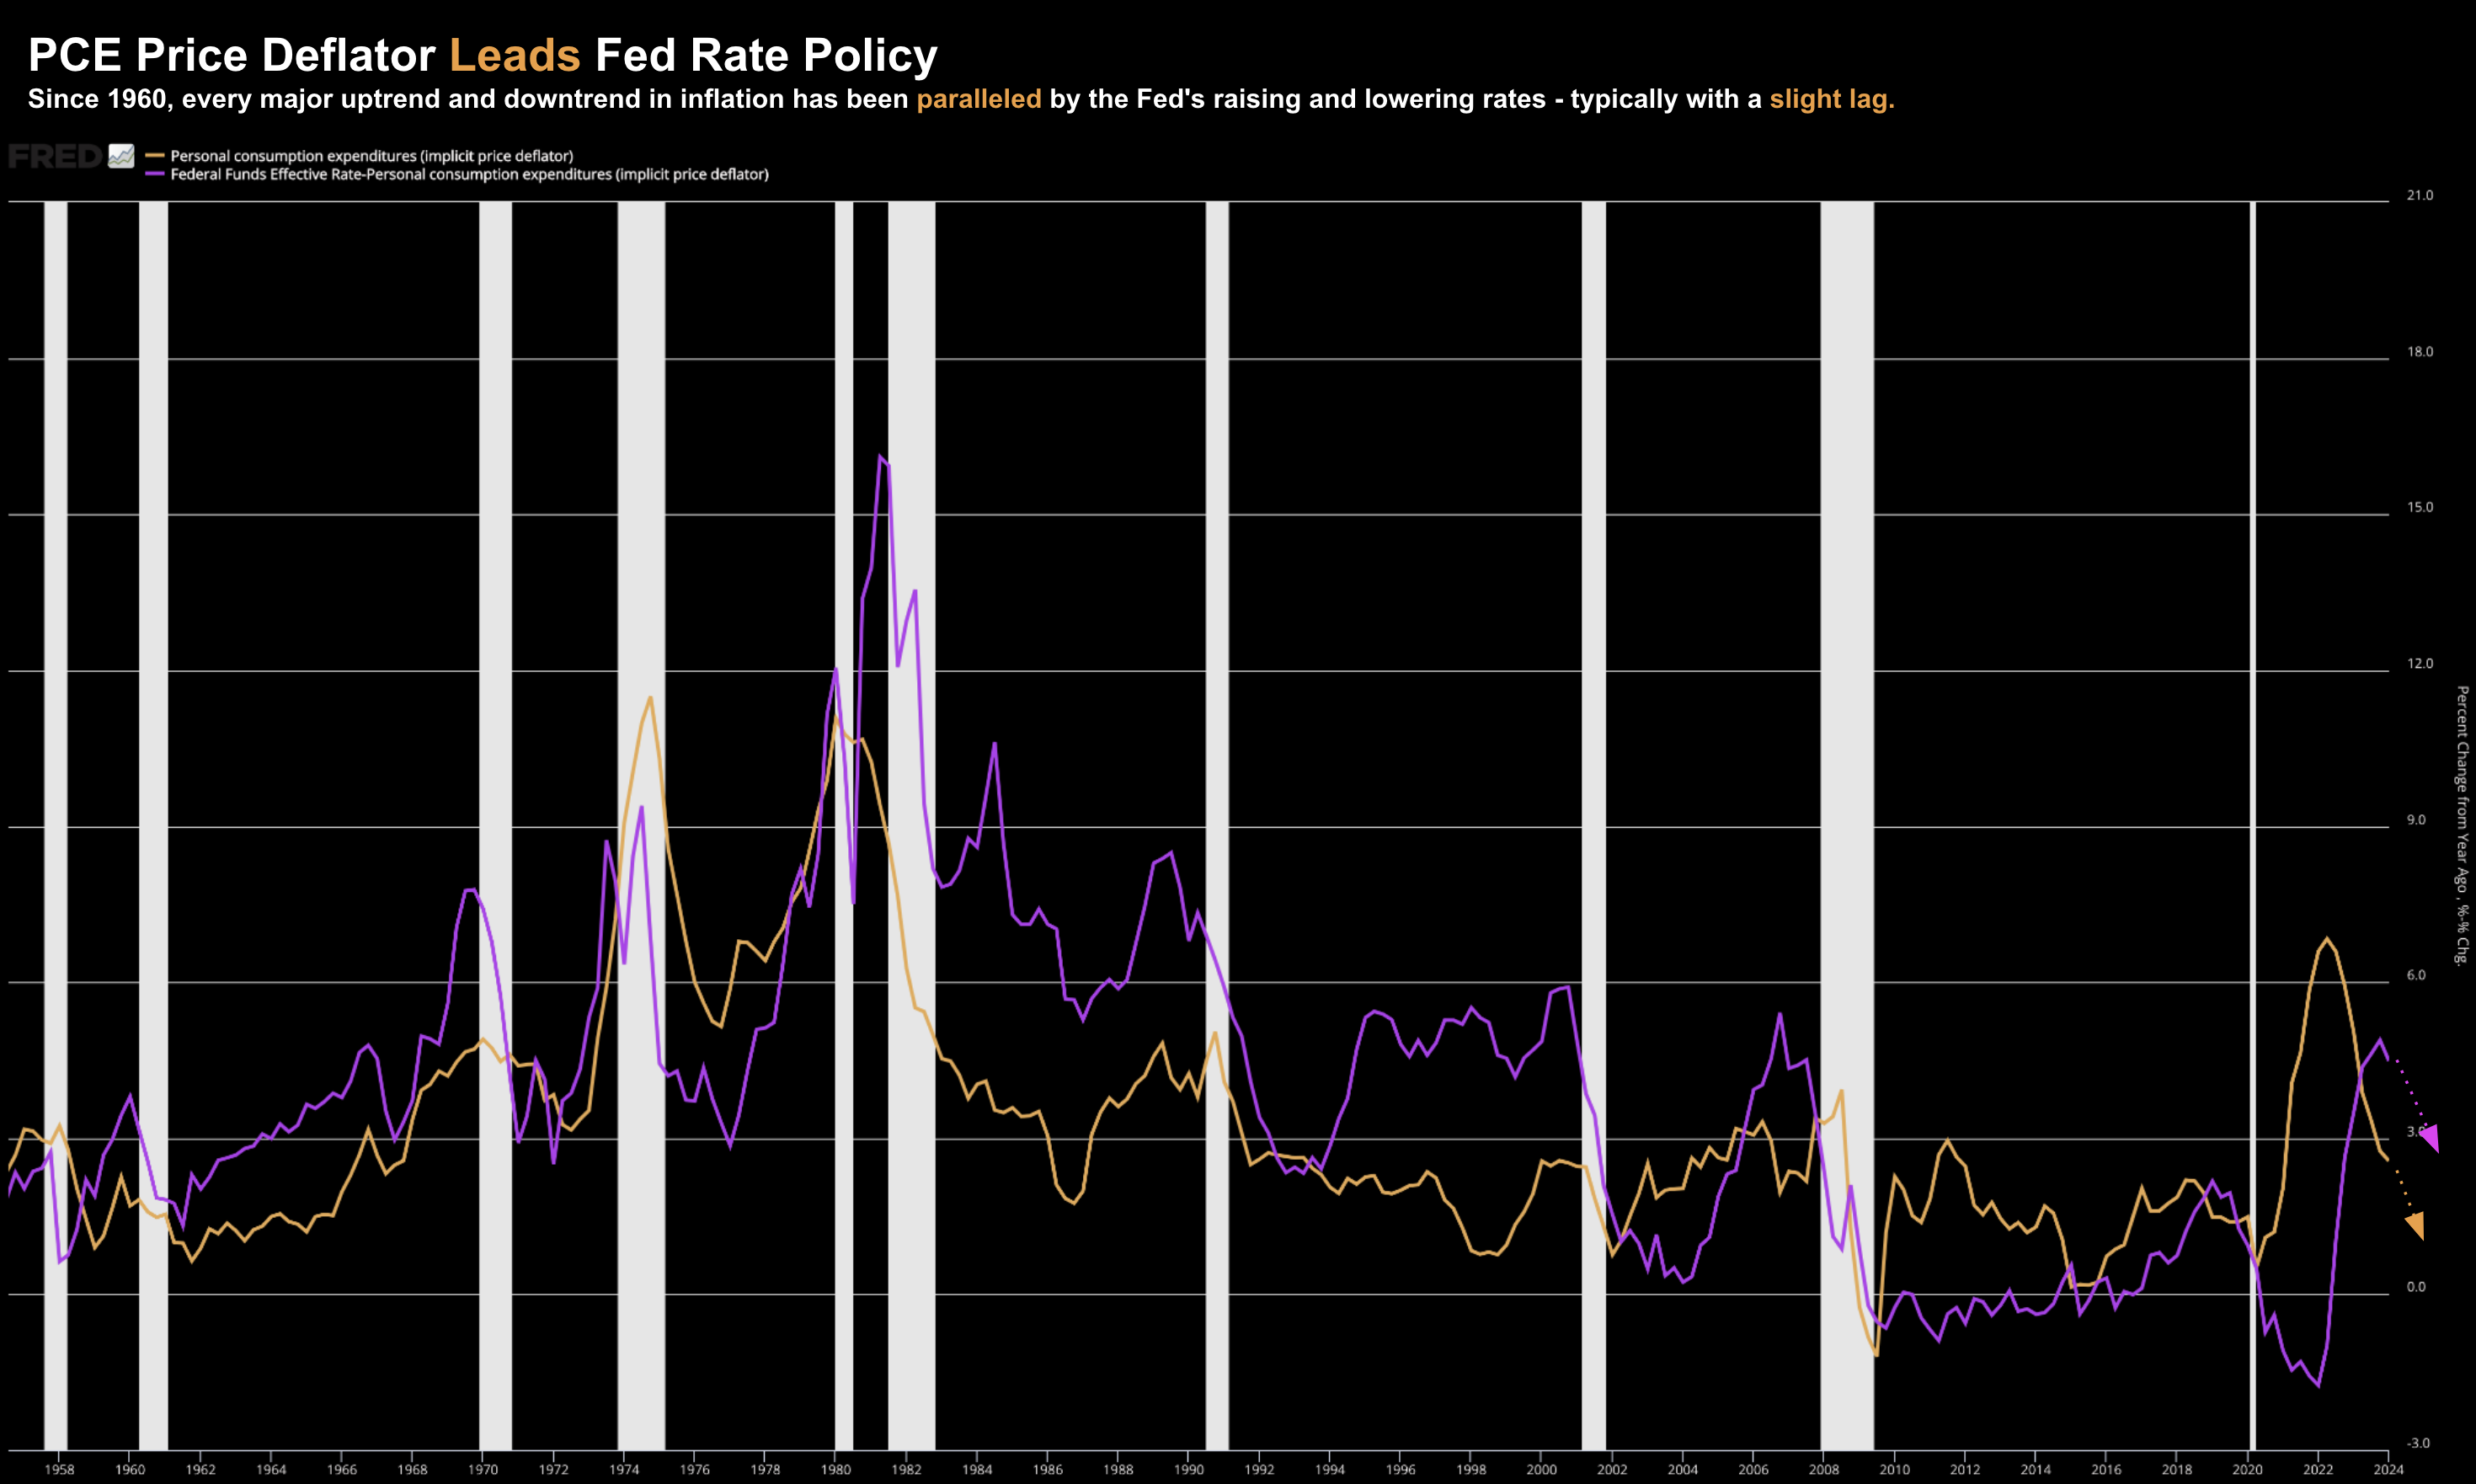
In orange, we have the PCE price deflator (as a measure of inflation).
In purple, we see the effective real fed funds rate (i.e. adjusted for inflation)
For those less familiar, the PCE price index (PCEPI) reflects changes in the prices of goods and services every month.
It’s what the Fed uses as their inflation gauge.
By creating this chart – I was interested in whether PCE leads Fed policy.
The answer is yes…
Since 1960, every major uptrend and downtrend in inflation has been paralleled by the Fed’s raising and lowering of the fed funds rate, typically with a slight lag.
This is very consistent.
And if we look at what we have seen with the PCE price deflator from early this year… it’s been trending lower sharply for ~6 months.
However, Fed policy has not moved.
But at some point within the next few months – I believe their hand will be forced.
It’s inflation which leads the Fed (not the reverse – as some may think).
Putting it All Together
- The laws of regression toward the mean (which applies to most walks of life);
- Longer-term charts over several decades (looking for cause-and-effect);
- What’s knowable (fundamentals) vs what’s not; and
- Where there are clear signs of significant excess or aberration (i.e., fear and greed)
Cycles are very repeatable and dependable patterns.
However they will vary in terms of their timing, duration and velocity.
What we attempt to do is understand the driving catalyst(s); i.e., the forces driving them.
Mark Twain allegedly said that “history doesn’t repeat – but it often rhymes”
The dynamics of business (and economic cycles) are usually very similar.
As an investor, it’s useful to observe when cycles progress from the midpoint to points of excess (in either direction).
And the more aggressive the aberration – the more damage that will be done.
Busts, crashes and panics will only ever follow a boom or bubble.


