- Dial in two 75 bps rate hikes over July and Sept
- Canada’s Central Bank Raises 100 bps
- Wages and rents the ‘stickier’ problems
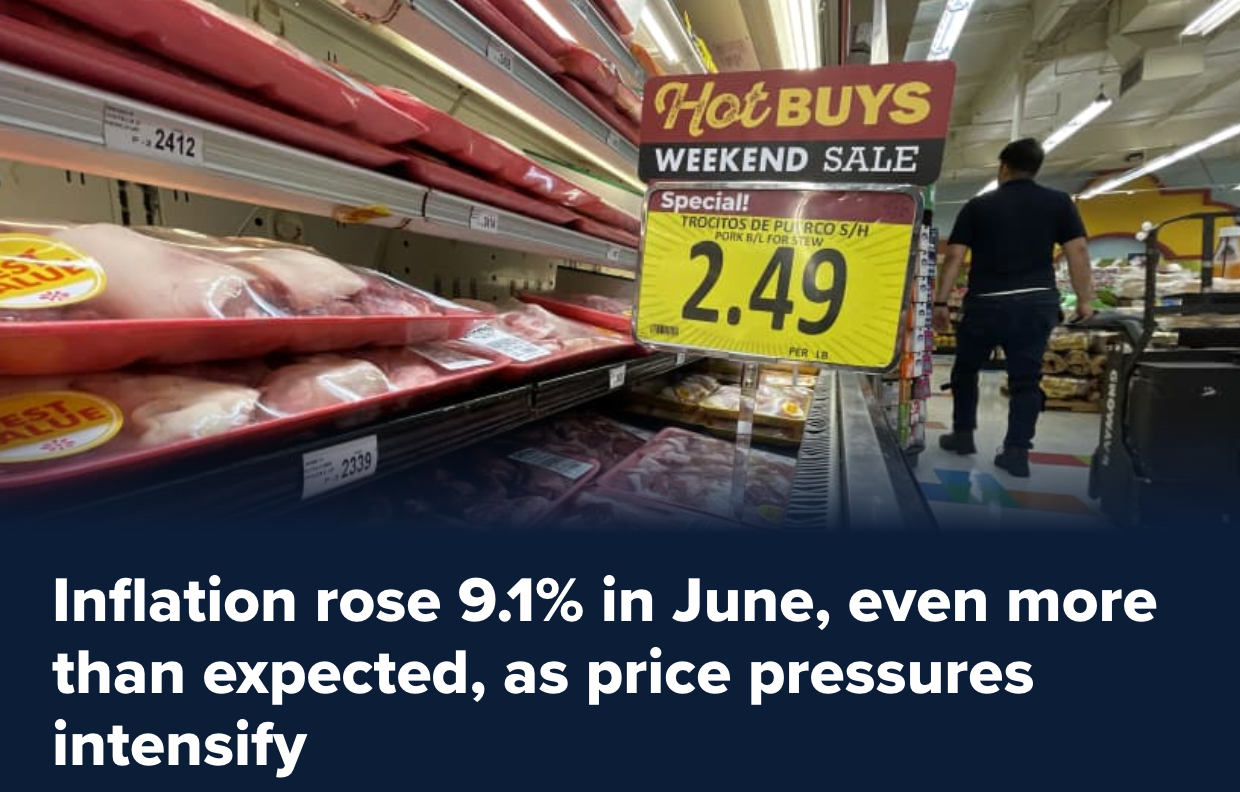
One of the most anticipated monthly CPI numbers is out: 9.1% YoY for June

Economists were expecting a number closer to 8.8% (which would have been up from May’s 8.6%)
Here’s CNBC:
The consumer price index (CPI), a broad measure of everyday goods and services, soared 9.1% from a year ago, above the 8.8% Dow Jones estimate. That marked another month of the fastest pace for inflation going back to December 1981.
Excluding volatile food and energy prices, so-called core CPI increased 5.9%, compared to the 5.7% estimate
On a monthly basis, headline CPI rose 1.3% and core CPI was up 0.7%, compared to respective estimates of 1.1% and 0.5%.
This is the opposite of what the Fed was hoping to see… but not completely unexpected.
We knew the number was going to be well north of 8%.
But north of 9%?
Jay Powell has been quite transparent in terms of what the FOMC needs to see before they soften their stance on rates and/or QT; i.e. a sequence of month-on-month declines (in core inflation at least).
Therefore, what this monthly CPI number does is restarts the Fed clock.
For example, going into this print, some were of the view that inflation was peaking and we could see signs of inflation reversing last month.
And if so, there was a possibility the Fed could back off their aggressive rate hikes later this year.
Wishful thinking…
From mine, it’s very hard to price in forthcoming relief when you get a headline 9.1% CPI YoY and 5.9% Core CPI
Let’s explore…
Bond Yields Shoot Back Up
It was not too surprising to see bond yields surge higher on the CPI news.
In short, it means “more Fed” (not less). And more Fed equals more volatility.
For example, Fed fund futures were pricing in a 3% chance of a 100 bps rise for July – that is now a 30% chance (which is what Canada’s central bank did today)
And in terms of a September 75 bps rise – this is now a 95% chance (up from just 39% before June CPI)
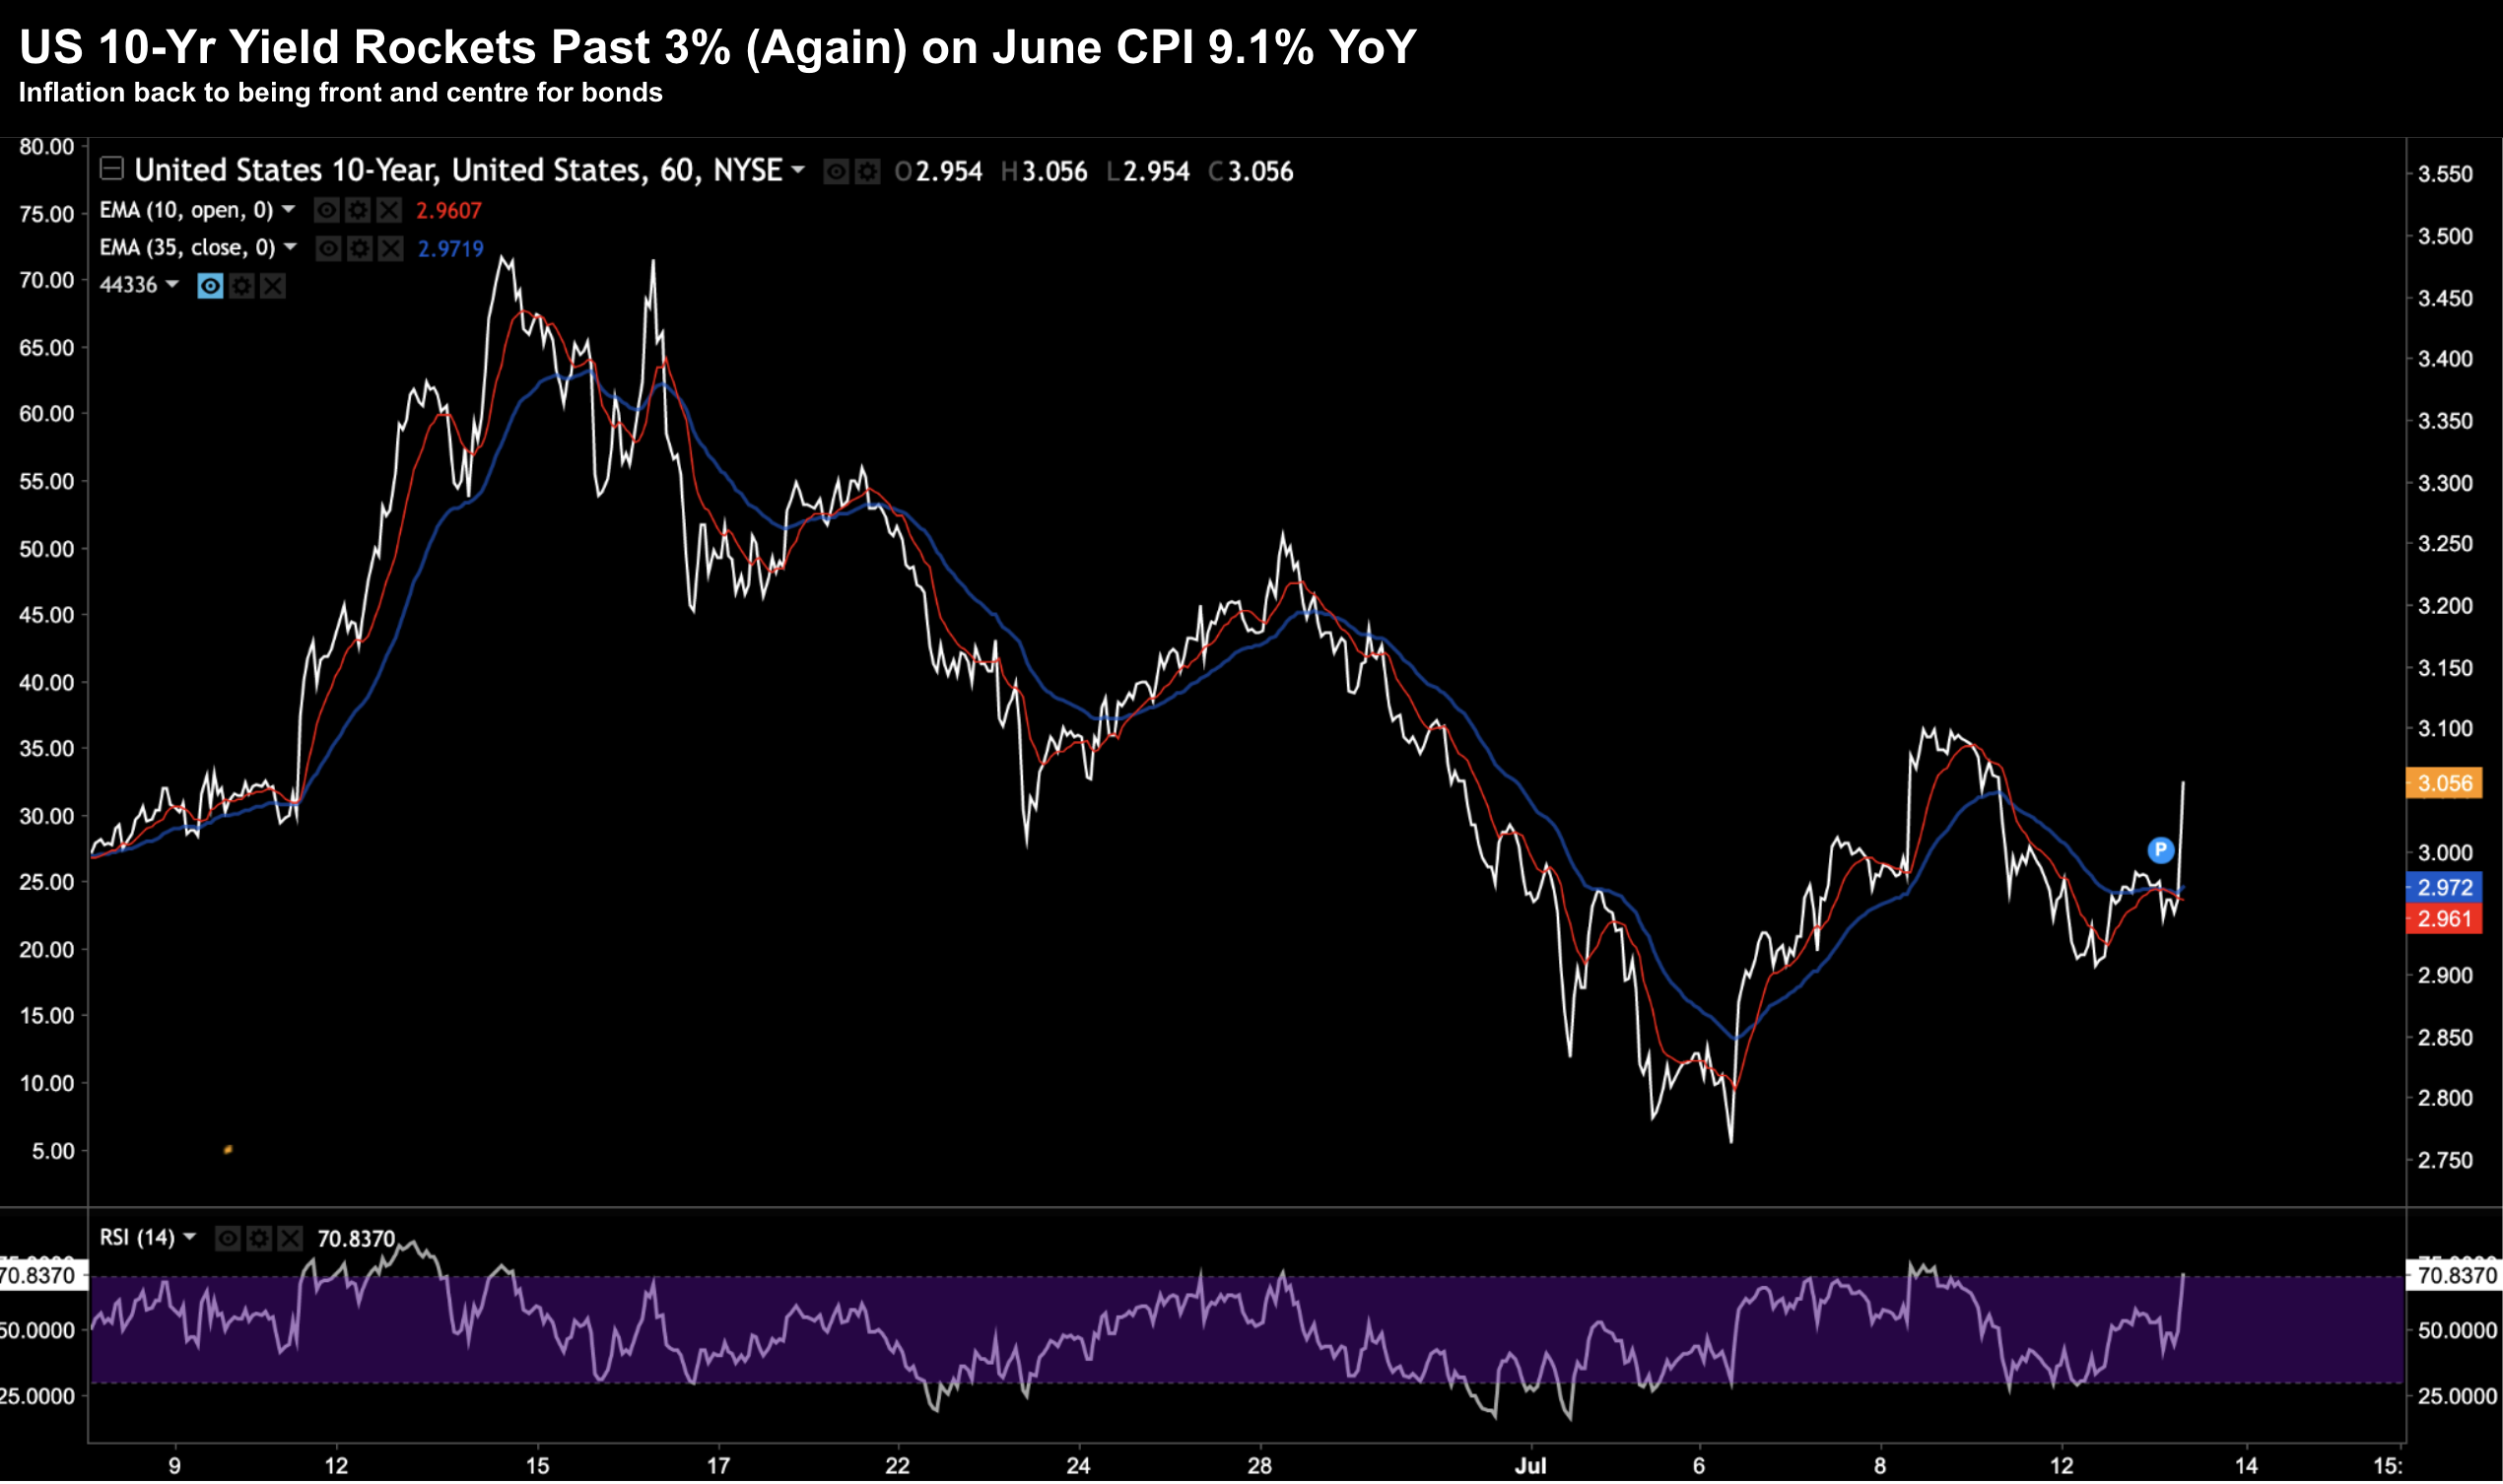
Below is the hourly chart for the US 10-year yield over the past month:
July 13 2022
As you can see, we are now back above the all-important 3.0% level.
Before this print, 10-year yields plunged from 3.50% all the way to 2.75% in less than a month.
Equities (notably high growth tech) started to catch a strong bid on the back of yields coming down.
The broader market was around 8% off its lows – as lower bond yields were pricing in a less aggressive Fed.
Not now – the market is starting to give back those gains.
However, we must also recognize that inflation prints are always backward looking.
The Contrarian Lens
Versus last month, inflation is mostly up across the board.
For example, over the past month alone (ie June vs May) we have seen:
- Gasoline up 11.2%
- Food up 1.0%
- Home prices up 0.7%
- New vehicles up 0.7%
- Medical up 0.7%
This means the typical person is spending at least $500 per month extra on the same items from a year ago.
But the ‘good news’ is the average US household has around $7,000 to $8,000 of savings – which they are drawing on.
Now with many leading commodities (such as iron ore, copper, wheat, lumber etc) all falling at least 20% the last few months – there is hope we could see some items start to come down (see this post)
For example, “Dr.Copper” – known for its economic predictive qualities – has plunged from $4.94 to just $3.27 (at the time of writing) – down a whopping 34%.
My prediction was we would see copper below $3.00 this year.
But that’s the good news…
However, on the flip side there are more sticky elements which are much harder to reverse.
For example, wages remain strong with the labor market tight (good news for consumers).
We have a situation where there are more job openings than people available (with 11.3M jobs open) – and yet we are talking about recession. Here’s the BLS (from July 6th)
The number of job openings decreased to 11.3 million on the last business day of May, the U.S. Bureau of Labor Statistics reported.
Hires and total separations were little changed at 6.5 million and 6.0 million, respectively.
Now with respect to rents – they continue to remain elevated.
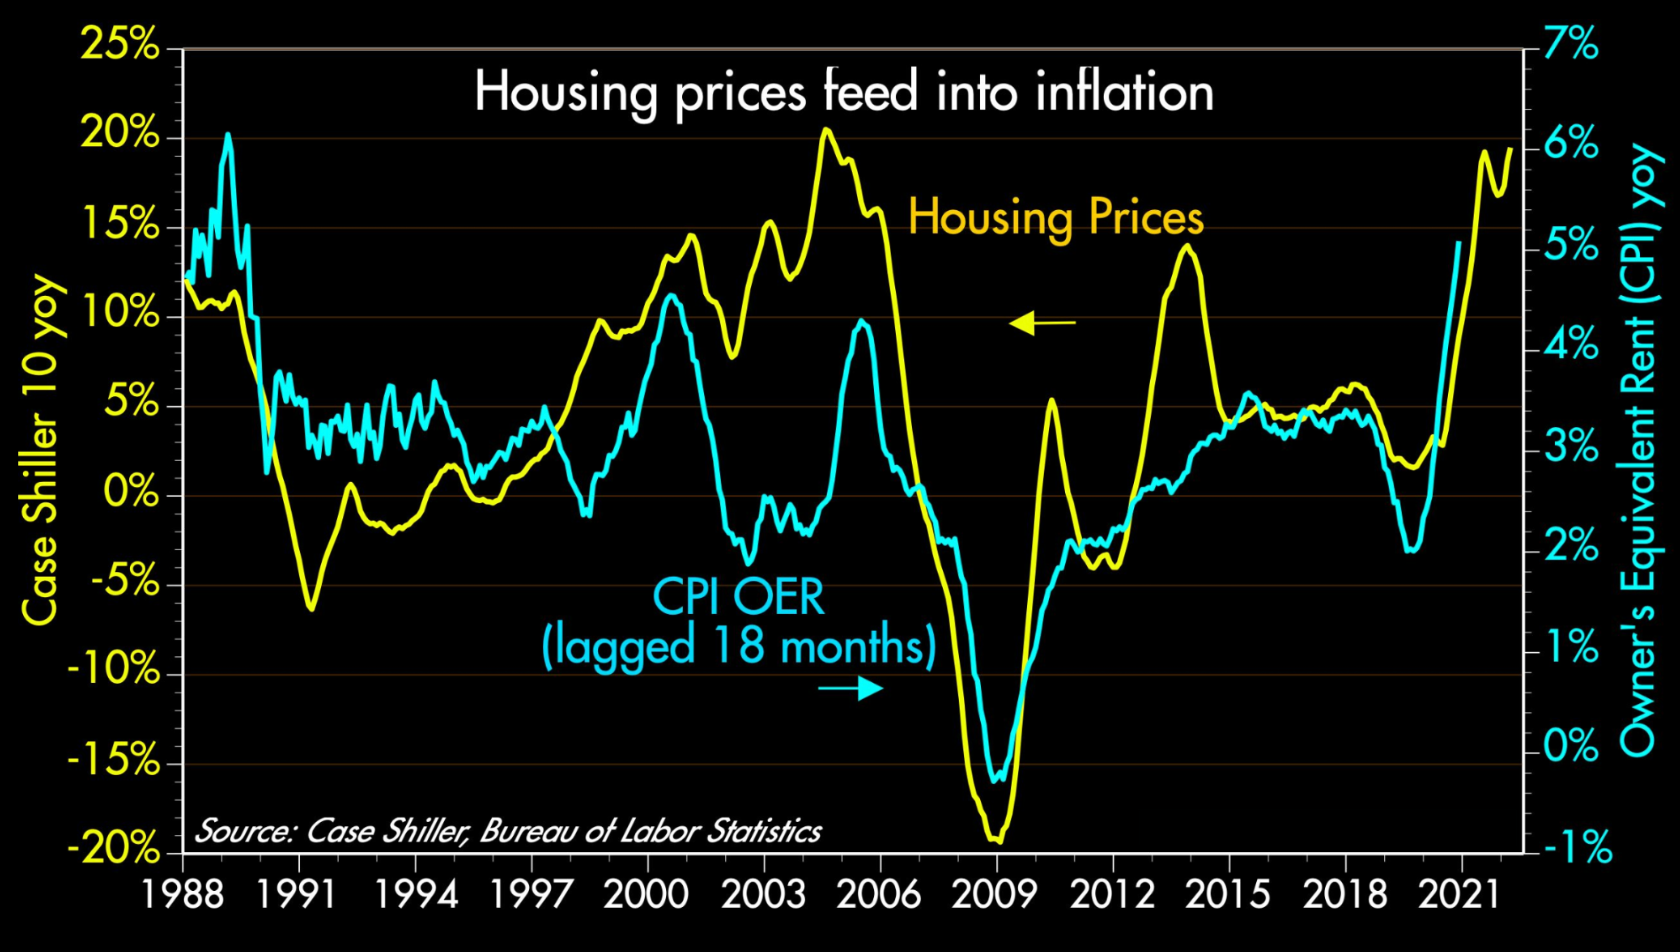
It’s well known that rents are known to follow house prices by 12 to 18 months – where house prices are up ~20% YoY (up again 0.7% month-on-month)
Scott Grannis shows the strong correlation (and lag) between the two:
This is problematic… as renters are not likely to see relief anytime soon.
Put together, whilst we could be “close to peak” inflation (e.g, with cars, food, air travel, apparel, consumer electronics etc) – the sticky part of the equation is still alive and well
And of the two – I think we will find that wages will be the very last to come down.
Putting it All Together
Equities are roughly 1.5% lower on the June inflation news.
Markets are quickly repricing what the Fed is likely to do – now expecting 2x 75 basis point rises the next two meetings (July and Sept).
What’s more, there is a 30% probability of a 100 bps rise this month (which I think is unlikely) .
The good news is inflation is rear-view mirror…
To that end, we’ve seen meaningful moves lower with most commodities which could see a lower print next month.
However, the Fed will want to see several months of decline before pivoting.
From mine, I think we need to watch the inflation opposite shelter and wages. When are they likely to show meaningful falls?
For me, that remains a longer path… unfortunately.


