- Markets finish the month on a high
- Possible warning sign with July PCE – as savings rates plunge
- Bonds are pricing in 6 to 7 cuts over 12 months… is that too much?
Eight months down. Four to go.
After shedding almost ~10% to start the month – the bulls managed to close the market at its highs.
Whiplash anyone?
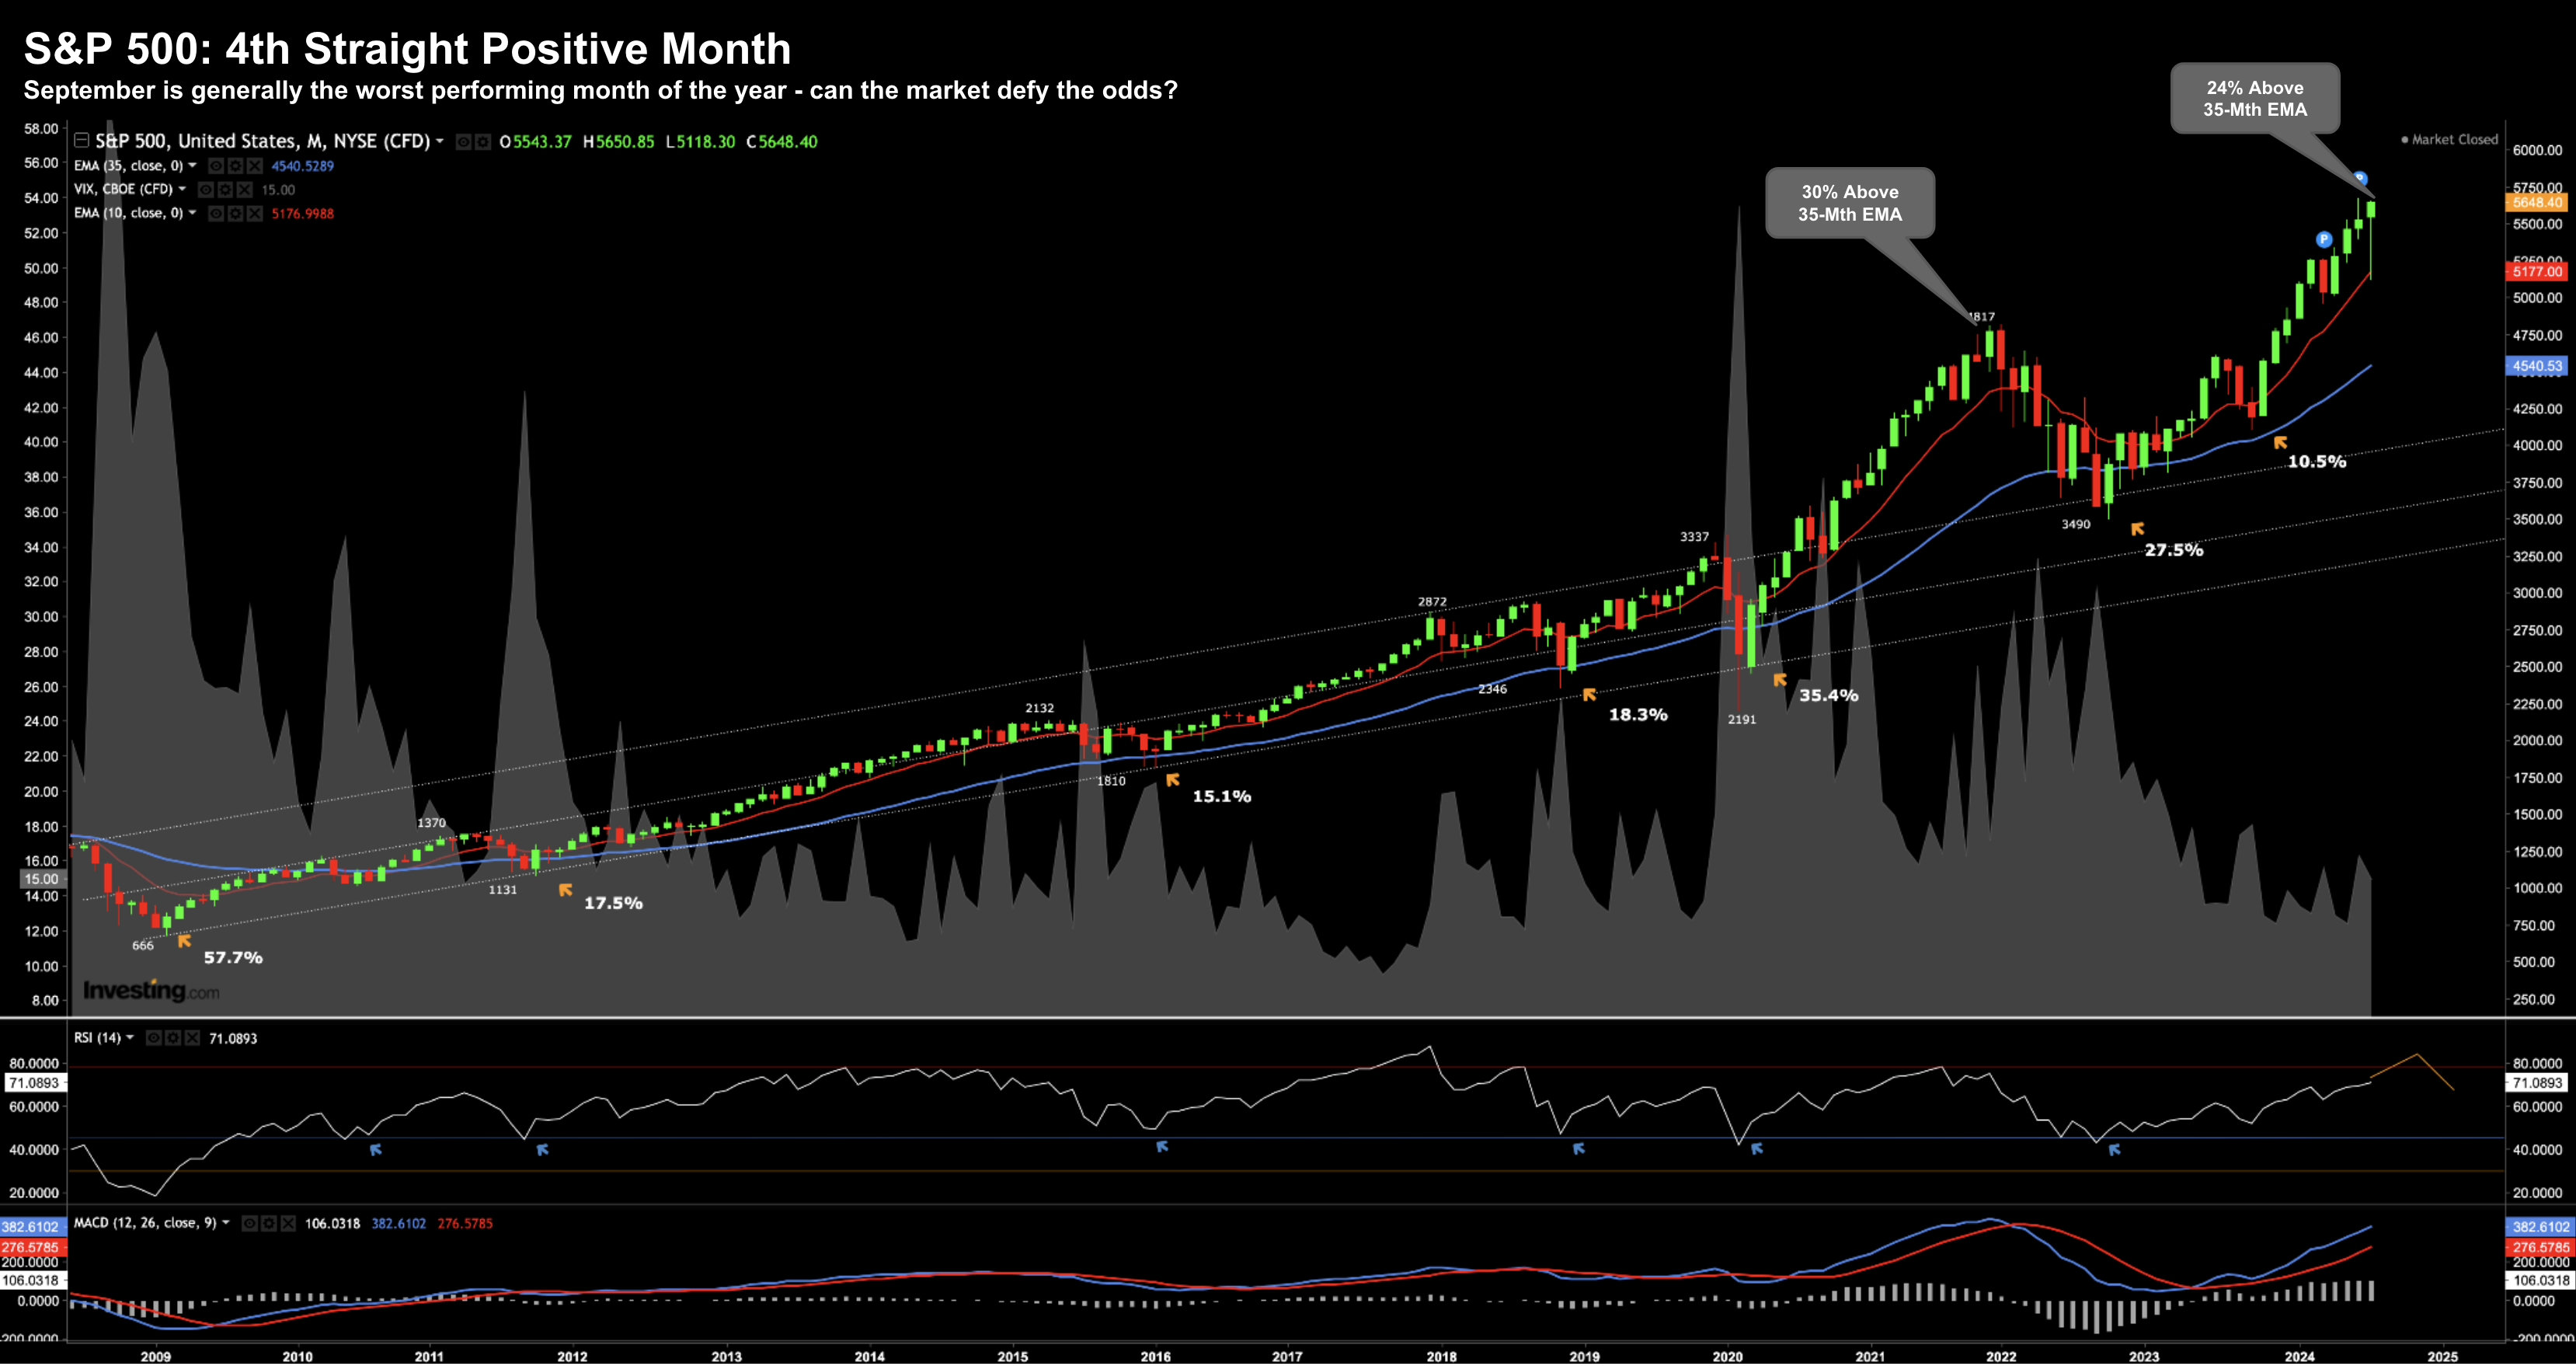
Below is the monthly chart – which offers useful perspective.
Aug 30 2024
This gives you a sense of the how long this market has remained bullish.
For example, post the recession of 2008/09 – the 10-month EMA (red line) has continued to trade above the 35-month EMA (blue line).
In other words, our bullish trend has not deviated despite the ~28% pullback during 2022.
What’s also interesting is on the six occasions the market retraced more than 10% (e.g., 2011, 2016, 2018, 2020, 2022 and late 2023) – it found support around the 35-month zone
This is typical of a bullish trend.
To end the month, the S&P 500 closed at 5648 – a lofty 24% above its 35-monthly EMA.
This level of extension isn’t something you see often…
However what’s curious is the current bout of enthusiasm is opposite:
- analyst’s revising down their forecasts for second half earnings; and
- they have not increased earnings estimates for next year.
In other words, what we see is multiple expansion.
Investors are willing to pay higher multiples for stocks as rates come down (see this post for an explanation on the inverse relationship stock valuations enjoy with rates).
And whilst lower rates typically demand higher PE ratios – we are now pushing close to 22x forward earnings.
22x is far from ‘fair value’…. it’s risky.
For context, over the past 10 years, the S&P 500 has averaged a forward PE of around 18x.
That’s potentially 4-turns too high…
With that, let’s visit the weekly chart and answer what could be next… followed by deeper dive into latest PCE print for July.
Back to the Scene of the Crime
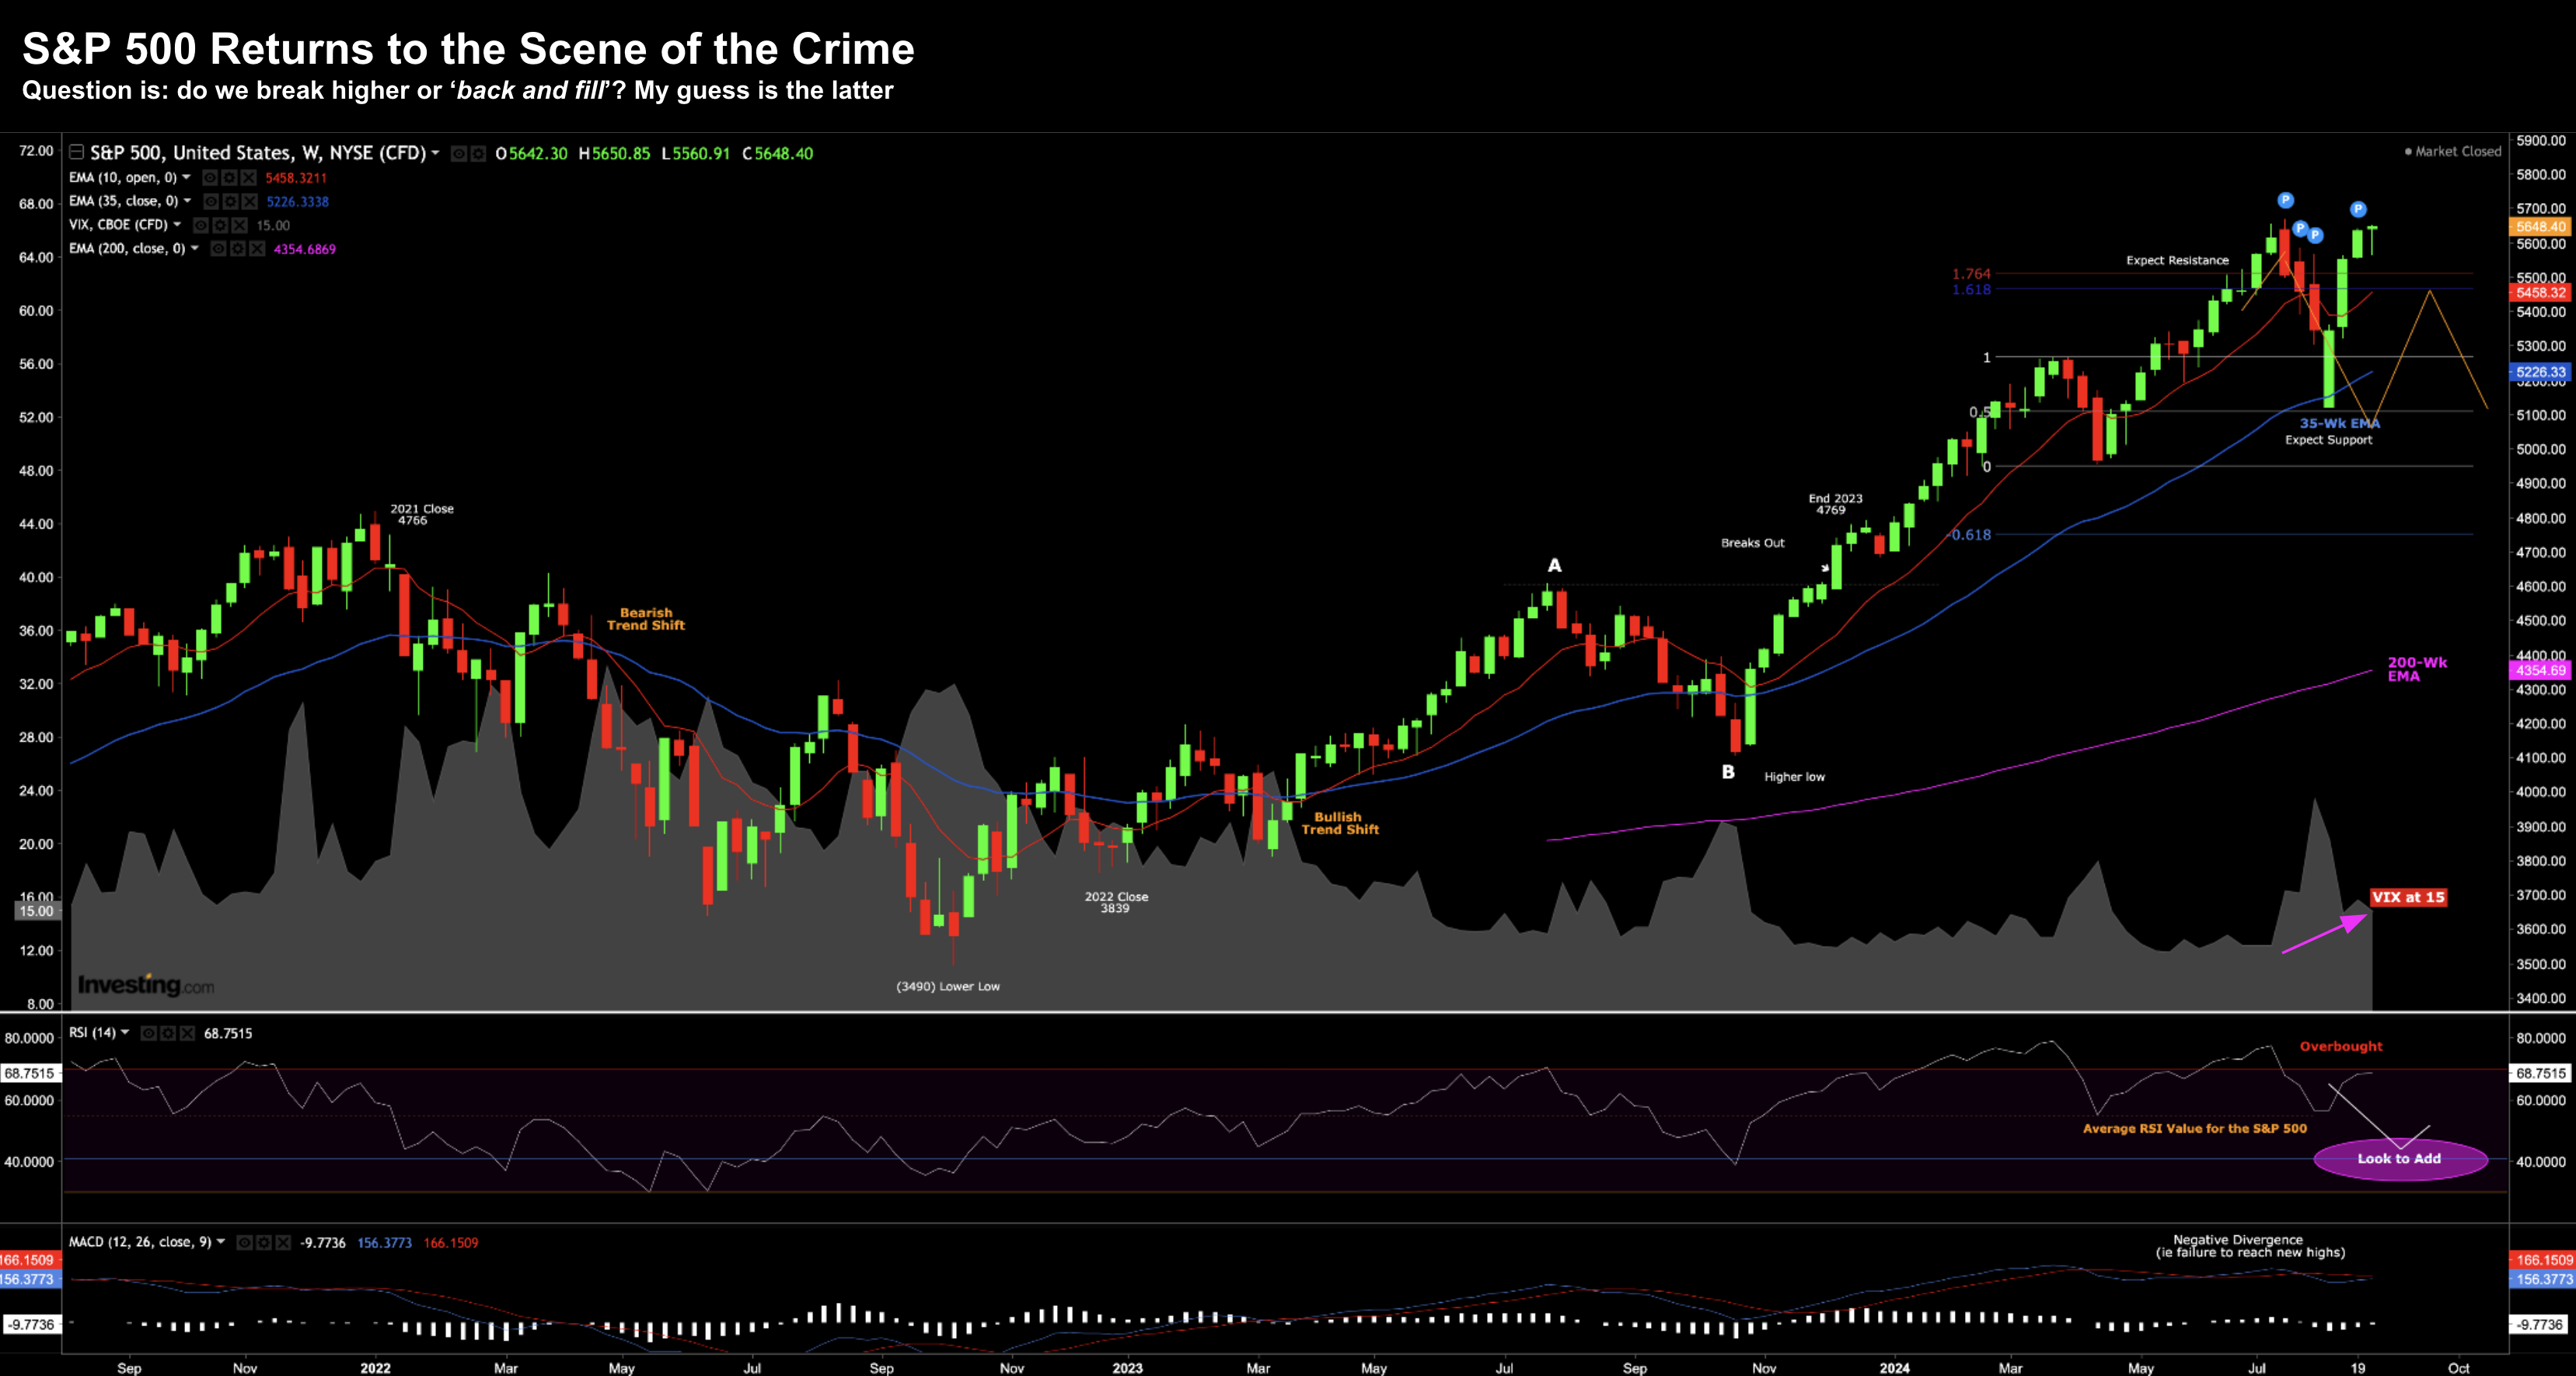
The weekly chart shows the 10.4% surge in the space of 4 weeks.
We are essentially back to the point where the markets panicked on a growth scare.
Further to my preface, we started the month at the 35-week EMA (blue line) and continued higher – only to find resistance near the previous high (i.e. what I’m calling the ‘scene of the crime’).
Aug 30 2024
- breaks through previous resistance (i.e., the all-time high of 5669); or
- performs what traders call a “back and fill”
My guess is we see the latter.
The 10% surge over the past 4 weeks doesn’t make me feel any better.
A violent move down matched by an equally violent move higher is not a market which is comfortable.
For example, note what we see with the VIX (the ‘fear index’)
Despite the 10% move higher – it has not gone back to its previous ‘complacent’ levels (around 12).
It remains elevated around 15.
As I explained here, volatility like we experienced the past few weeks is indicative of a market in transition.
Therefore, I would not be surprised to see a few large down weeks during the month of September.
What July’s PCE Told Us
This morning the market was sweating over what we saw with PCE price index (i.e., inflation in goods and services)
A higher-than-expected print might have seen investors pare the expectations for rate cuts (more on this in my conclusion)
The good news is it came is as expected – up 0.2% MoM
- Core PCE prices increased 0.2% in July and 2.6% from a year ago. The 12-month figure was slightly softer than the 2.7% estimate.
- All-item inflation came in respectively at 0.2% and 2.5%, in line with forecasts.
- Personal income increased 0.3%, slightly higher than the 0.2% estimate
- While consumer spending rose 0.5%, in line with the forecast.
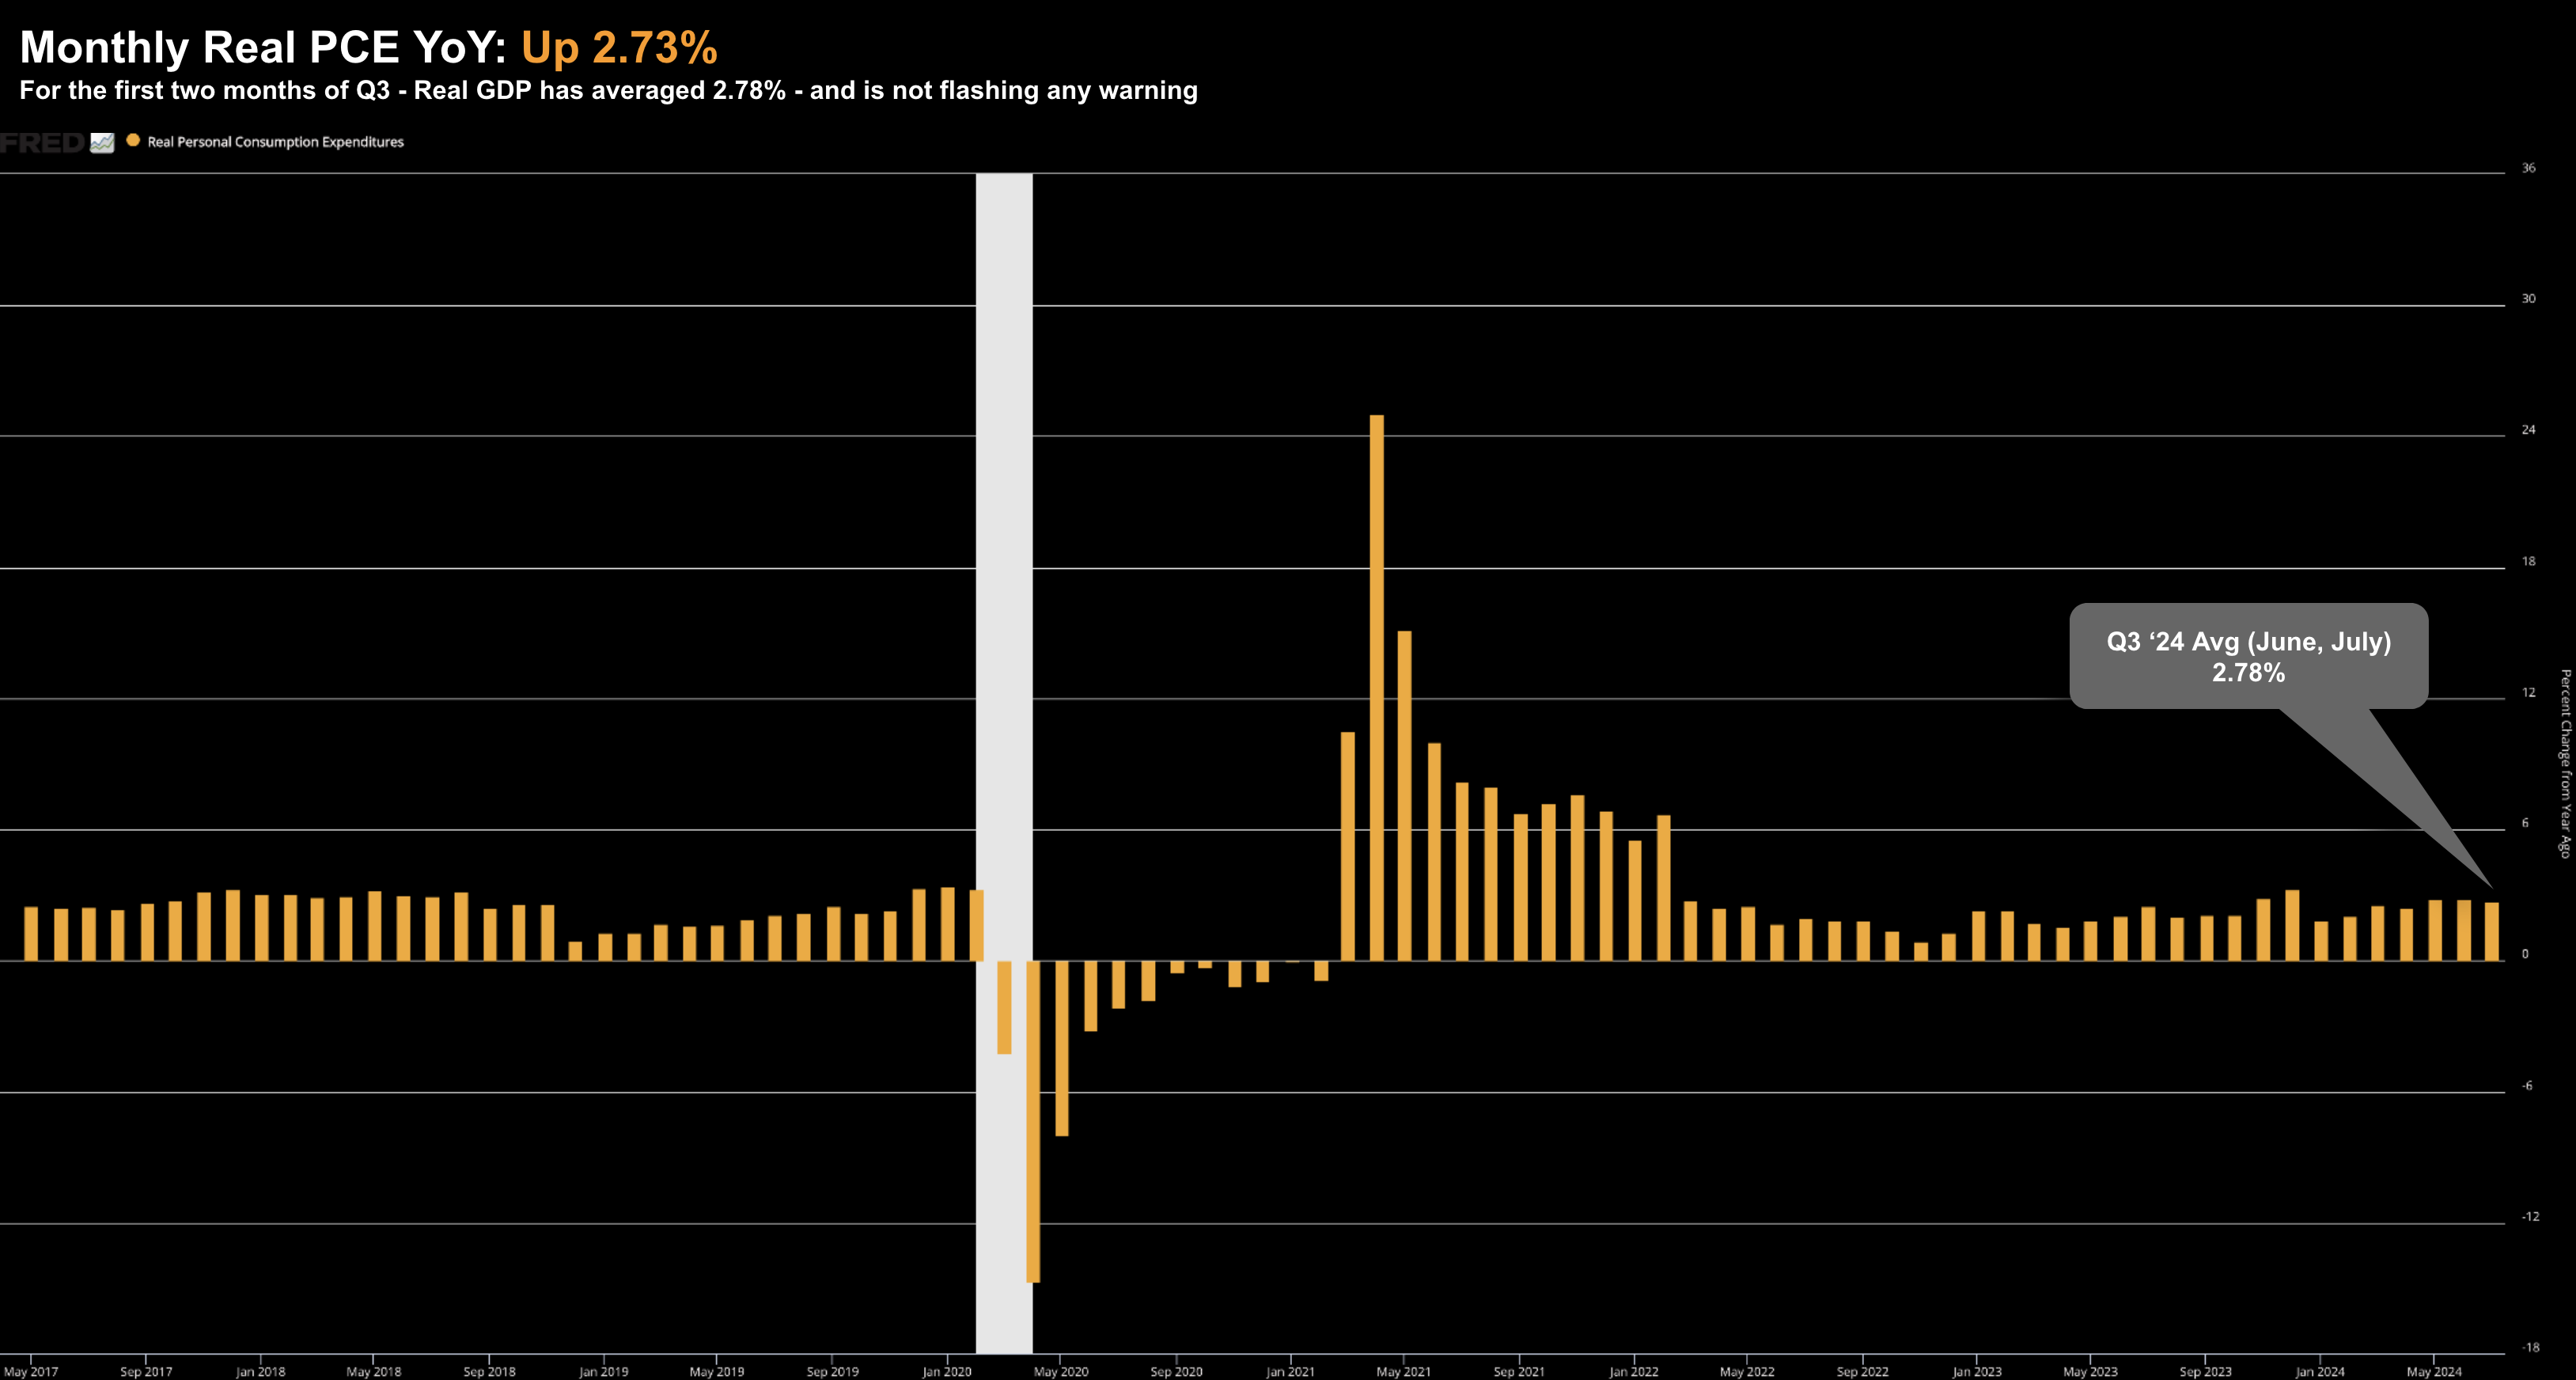
With respect to spending (and its 70% weight on GDP) – what I like to do is assess the quarterly YoY change – and so far there is nothing ‘flashing red’ with Q3 (with two of the three months now behind us)
Aug 30 2024
Based on what we see with consumer spending – the soft landing narrative remains intact.
However, it’s prudent to assess what’s enabling spending.
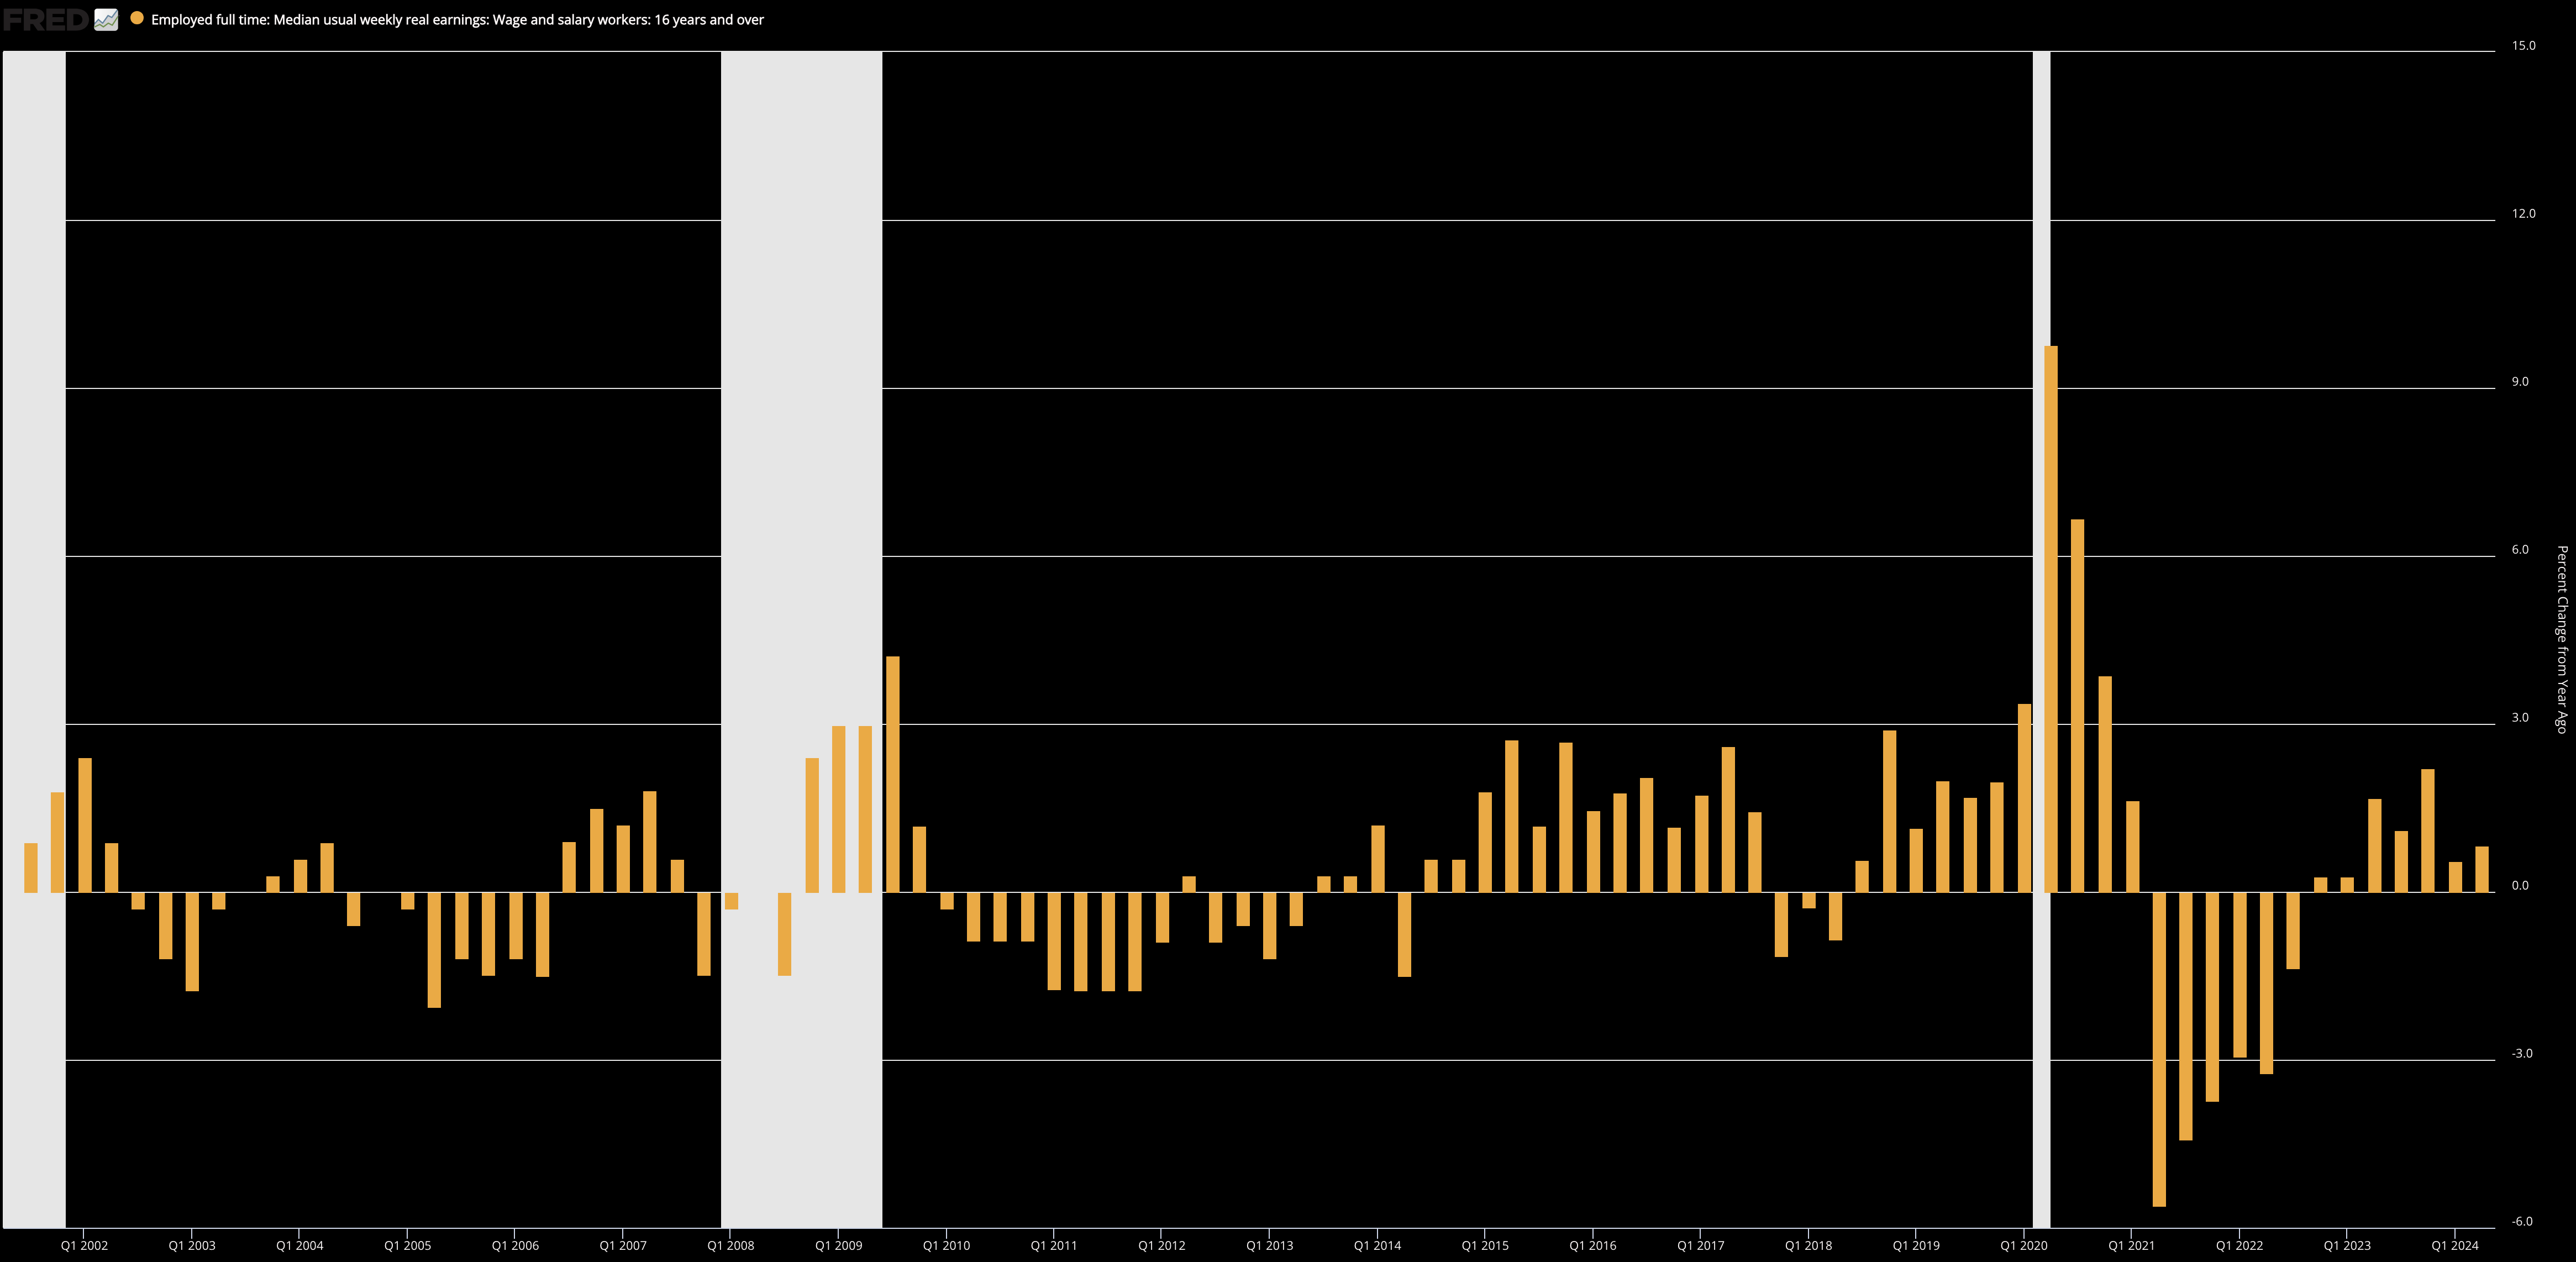
First, let’s assess the trend in real incomes:
Aug 30 2024
From Q4 2023 – real wages have grown at far slower rates.
That said, it’s important that wage growth remains above inflation – enabling consumers to keep their heads above water.
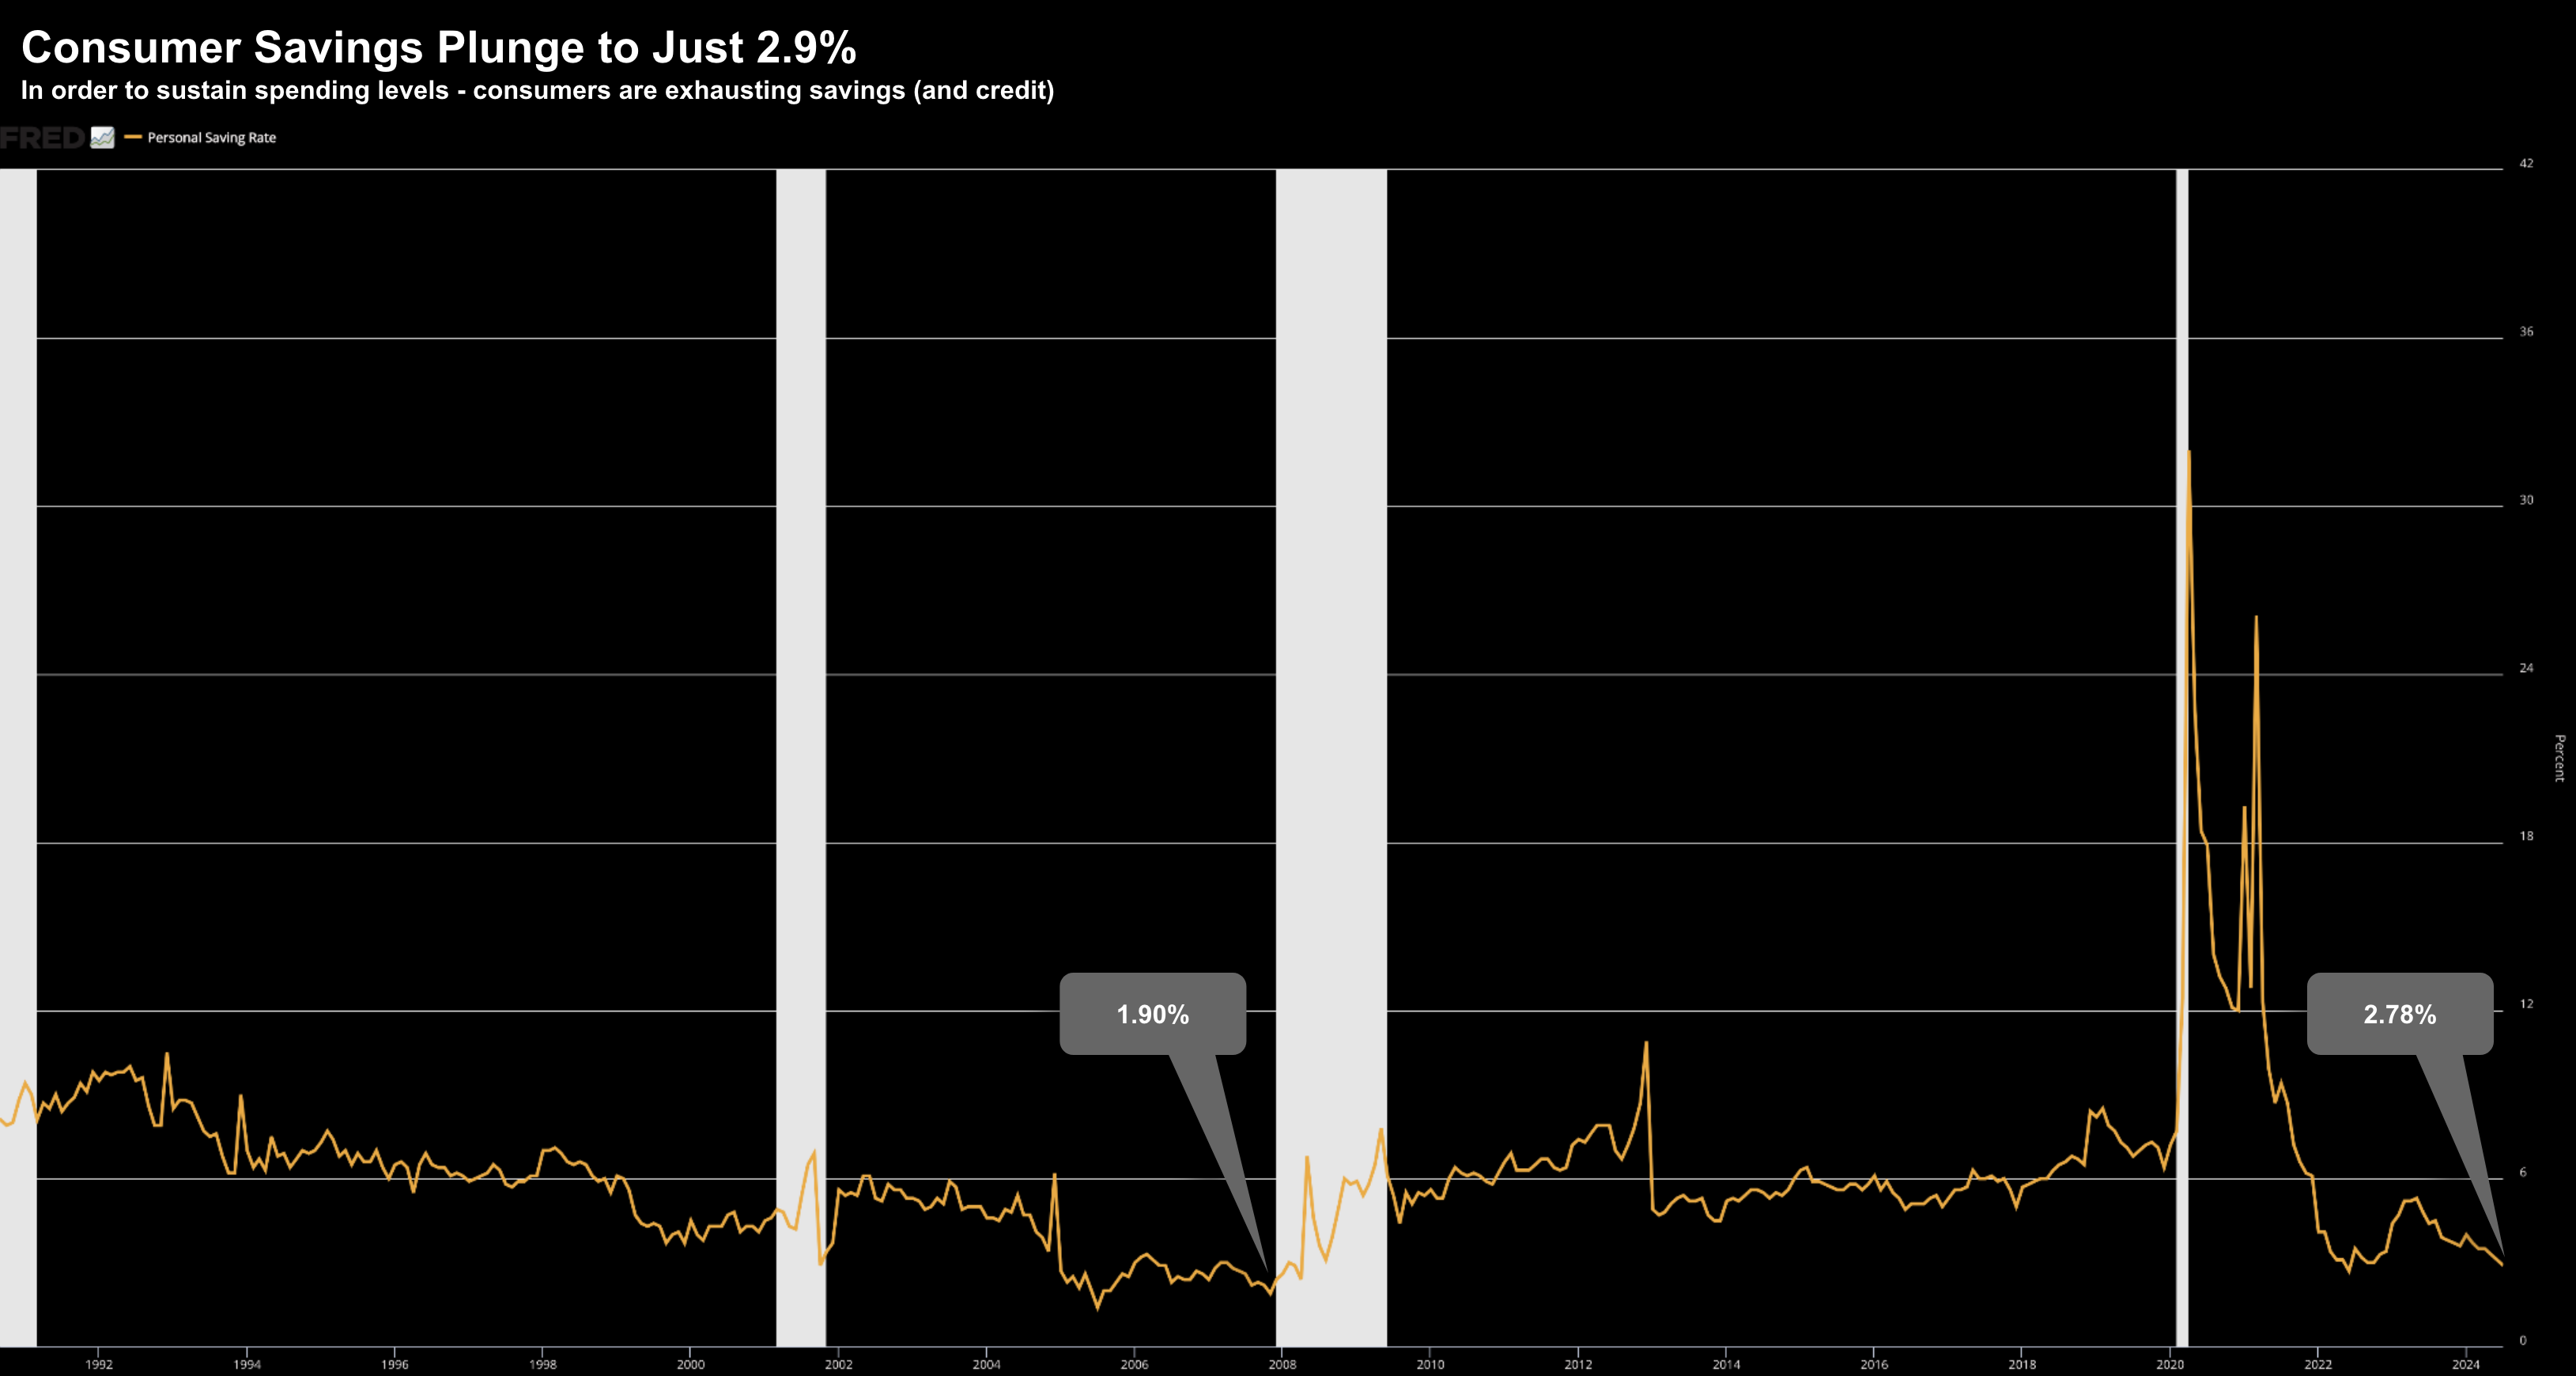
However, the warning from PCE was what we see with the savings rate:
Aug 30 2024
This tells us just how cash strapped some consumers are.
Here’s discount retailer Dollar General (who targets lower income consumers):
Customers who make less than $35,000 annually contribute about 60% of the company’s overall sales.
At the same time, Vasos said 60% of households in that demographic say they’ve had to cut back on buying basic necessities due to higher costs for those items, as they struggle to keep up with other basics — rent, utility and health care expenses.
“It appears to us very strongly that … this lower end consumer continues to be very much financially strapped especially as it relates to her ability to feed our families and support her families,” Vasos said. “[T]his is a cash strapped consumer right now, even more so than what we saw in Q1.”
With that, I will continue to watch consumption trends like a hawk.
For now, they are holding up (just).
However, what we see with trends in real incomes and savings is starting to bite.
Putting it All Together
What we’ve seen in the market the past three to four weeks is one of relief.
For example, we received positive prints with GDP and PCE – where the consumer appears to be hanging tough (at least middle and upper cohorts) – with Powell assuring us rate cuts are on their way.
All reasons to buy stocks.
However, I would like to point out that notable divergence with bond yields.
Whilst stocks have managed to work their way past a recent growth scare – bond yields remain low.
Why?
My take is bond yields are still pricing in too many cuts.
As I said a few weeks ago (when lowering my exposure to the long-end) – this feels a lot like January – where the market was pricing in 6 or 7 cuts this year.
However, as we saw then, this does not align with what we’re seeing in the economy (e.g., GDP and PCE trends).
For example, if the Fed were to cut 150 basis points (i.e., 6 cuts) over the next 12 months (which is what’s priced in) – what would be happening in the economy?
During the depths of COVID, the GFC of 2008 and the dot.com bust of 2000, the Fed were panicked into 200 bps of cuts.
Is that what lies ahead?
I don’t pretend to guess – but that’s what I see as the disconnect in the market.
Things which make you go hmmm.

