- Market hypnotized by all things “AI”
- The large bifurcation in earnings – healthy?
- GDP drops to just 1.6%… but does it matter for stocks?
The Artificial Intelligence (AI) narrative continues to dominate sentiment.
Whether it was Google, Meta or Microsoft… the (AI) earnings script was similar.
They are “all in”…
Mega-cap tech companies so far have reported impressive earnings and revenue growth with respect to their AI strategies (across online ads, cloud and search)
It was music to investor’s ears.
More on this shortly when I discuss earnings – as there’s an interesting trend.
Meanwhile…
In the real economy – growth and inflation concerns linger.
GDP for Q1 was anaemic at just 1.6%; and the Fed’s preferred measure of inflation (Core PCE) continues to be stubbornly high.
But who cares… you might say.
We have AI!!
For investors, the narrative of AI as some kind of panacea might hold for a quarter or two yet.
And why not?
I discussed why it’s still premature to ‘fight the tape’
That said, over the longer-term, what we see with economic growth and rates will trump technology innovation.
Let’s start with earnings… with 46% of companies now reporting Q1 results.
The Earnings Bifurcation
Taking a bird’s eye view – one might conclude that earnings are performing better than expected.
On the whole earnings up just under 5% YoY.
Good… not great.
That said, the market expects earnings growth rates of 9.7%, 8.6%, and 17.3% for Q2, Q3, and Q4 2024, respectively.
That’s an aggressive ramp.
And whilst it could happen – it hinges on a strong, spending (employed) consumer combined with Fed easing.
But let’s pull apart the ~5% earnings growth for the S&P 500…
Where is it coming from?
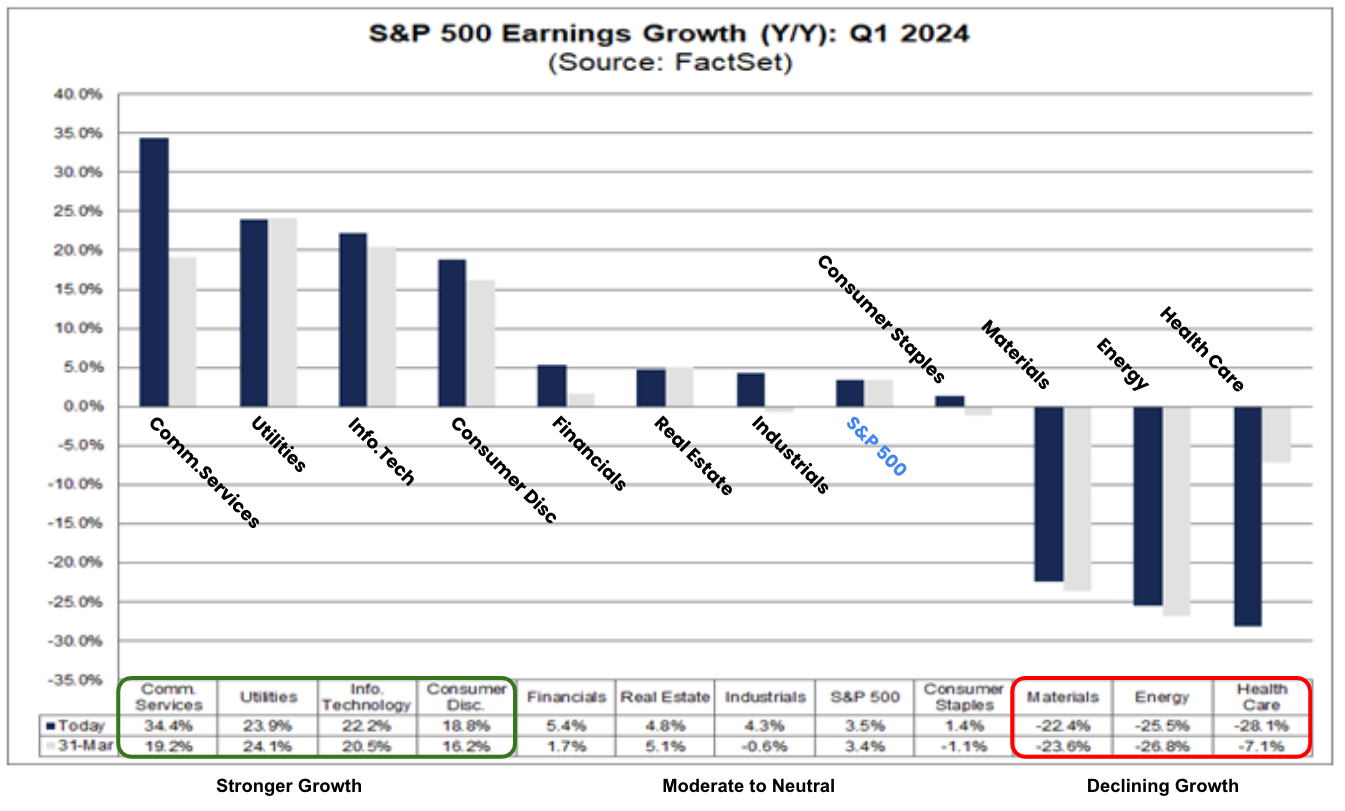
The growth in earnings is very narrow – coming from just four sectors:
- Communication services (+34%);
- Utilities (+24%);
- Information tech (+22%); and
- Consumer discretionary (+18%).
From there… it’s daylight.
Let’s start with three large cap tech stocks belonging to ‘communication services’ (Google and Meta) and ‘information technology’ (Microsoft)
- Google: revenue of $80.54 billion; 15% YoY growth – its fastest growth rate since early 2022;
- Microsoft: revenue of $61.9 billion; 17% YoY growth;
- Meta: revenue $36.5 billion; 27% YoY growth (with $35.6 billion from ads!!) – its fastest rate of expansion for any quarter since 2021
Online ad spend is booming (n.b., look for Amazon to post something similar next week when it reports – being 8% of the total online ad market)
And whilst Meta’s stock dropped ~10% post the release – its stock is up almost 500% over the past 18 months. Put another way – all the good news was more than priced in.
Put together, large-cap tech comprise ~30% of the total S&P 500 market capitalization.
And whilst the AI story might be exciting – the concentration in earnings growth also makes for a fragile market.
I’ll frame it another way…
If you’re building an exceptionally tall tower – it’s generally prudent to widen your base.
You want the tower to withstand threatening forces such as gale force winds, earthquakes and other potential risks.
This brings us to our ‘earnings growth’ tower:
Thanks to large-cap tech – they’ve enabled S&P 500 earnings to creep into positive territory.
However, without it, growth would be negative.
It really is the tale of two economies… the old vs the new.
Let’s hope the AI narrative continues to deliver over the next few quarters (and it could).
Factset tells that the blended earnings growth rate (actual results with estimated results) for Q1 is 3.5% today.
This is a lot higher than the earnings growth rate of 0.6% reported last week (i.e. the large contribution from big tech)
With respect to revenue – the blended revenue growth rate for the first quarter is 4.0% – compared to a revenue growth rate of 3.5% last week.
Put together, analysts expect the full year to deliver 10.8% (or ~$245 per share)
With the S&P 500 trading around 5100 – that’s a forward P/E ratio of 20.8x
That’s not what I would consider a bargain.
This Isn’t a Cheap Market
Factset tell us that 20.8x earnings is above the 5-year average (19.1x) and above the 10-year average (17.8x)
And that’s one useful measure.
And whilst back of the envelope math tells me 21x isn’t cheap – we need to be mindful of what we see with rates.
For example, if rates were say 1-2%, I could justify the 21x multiple.
In that case, you are getting a 3% premium by owning (riskier) stocks.
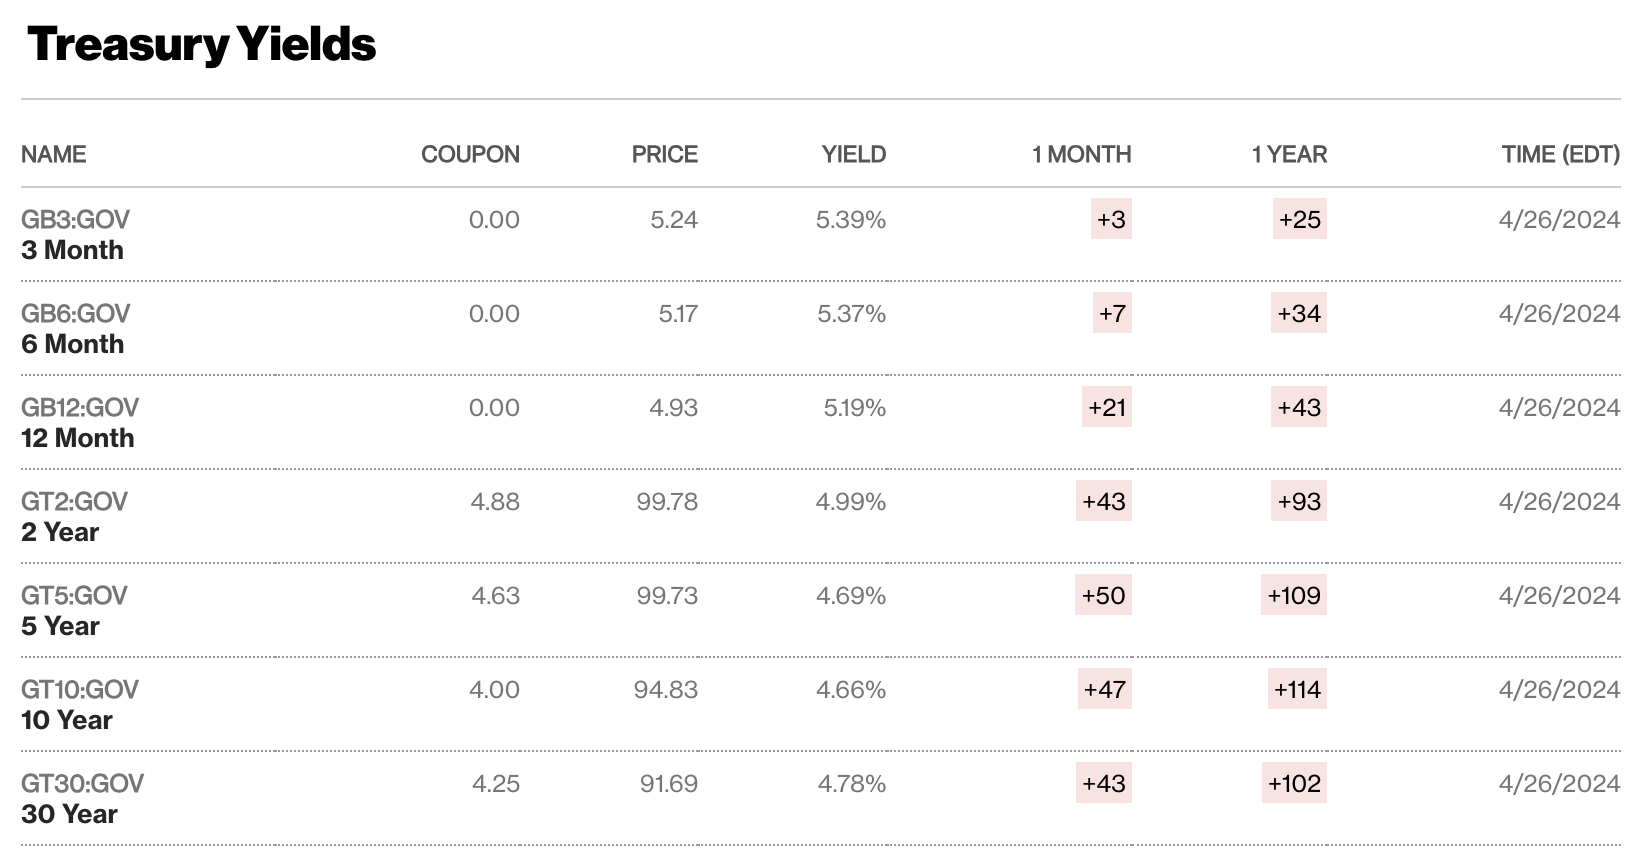
But it’s very hard when the risk free rate is 5.0% (as we find with the US 2-year)
Using that measure – let’s assess the (lack of) equity risk premium you’re receiving today.
With a forward PE of ~21 – that equates to an earnings yield of 4.76% (i.e., the inverse of 21)
The risk-free yield on the US 2-year is 4.99%; and the longer-term 10-year yield is 4.66%
Source: Bloomberg April 26 2024
Therefore, with stocks yielding 4.76% – there is no risk premium by owning equities.
Let’s add some further context…
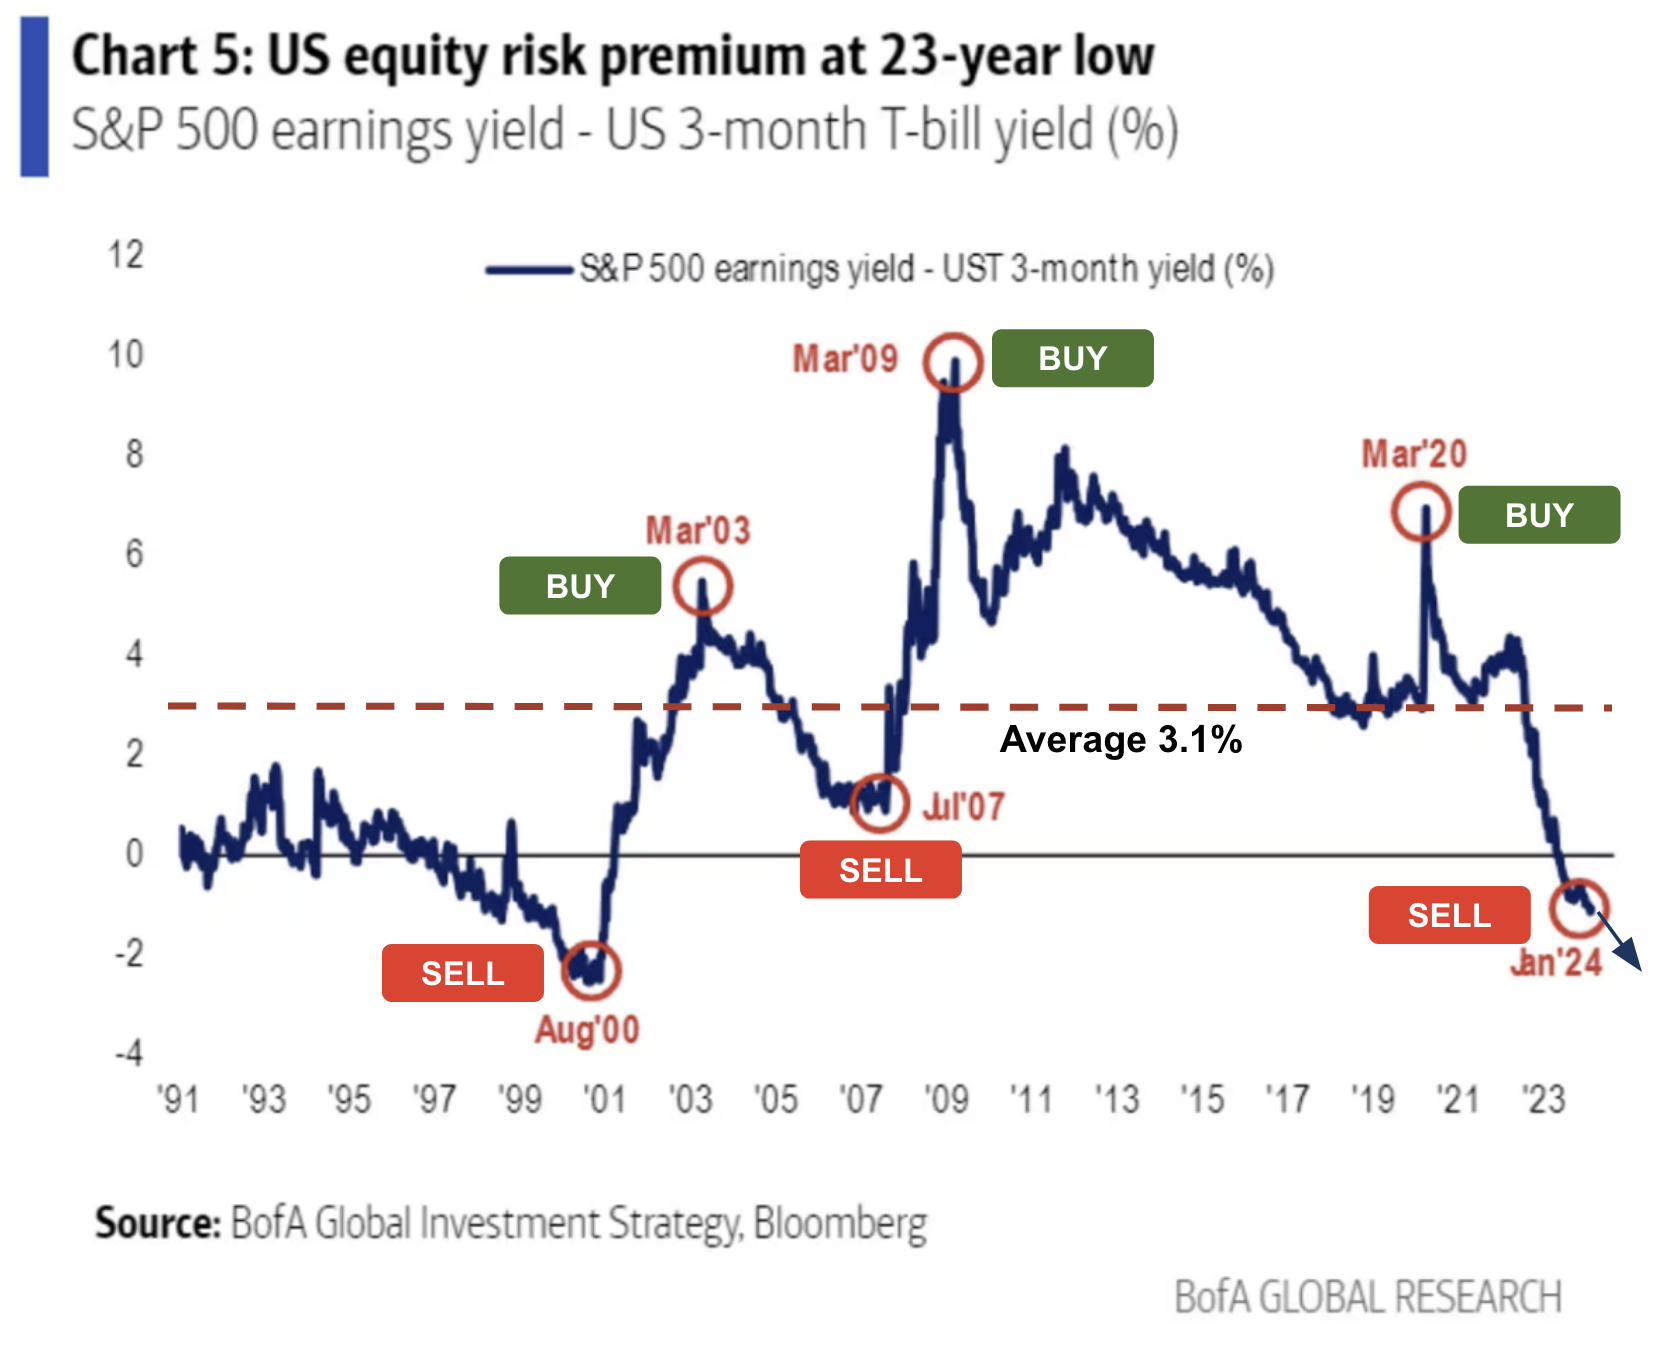
This BoA chart from 1991 shows equity risk premiums are now challenging levels not seen since the dot.com bubble
(Note: equity risk premiums have moved lower since January – with yields rising sharply).
Now I’ve taken the liberty to annotate BoA’s chart with “Buy” and “Sell” labels.
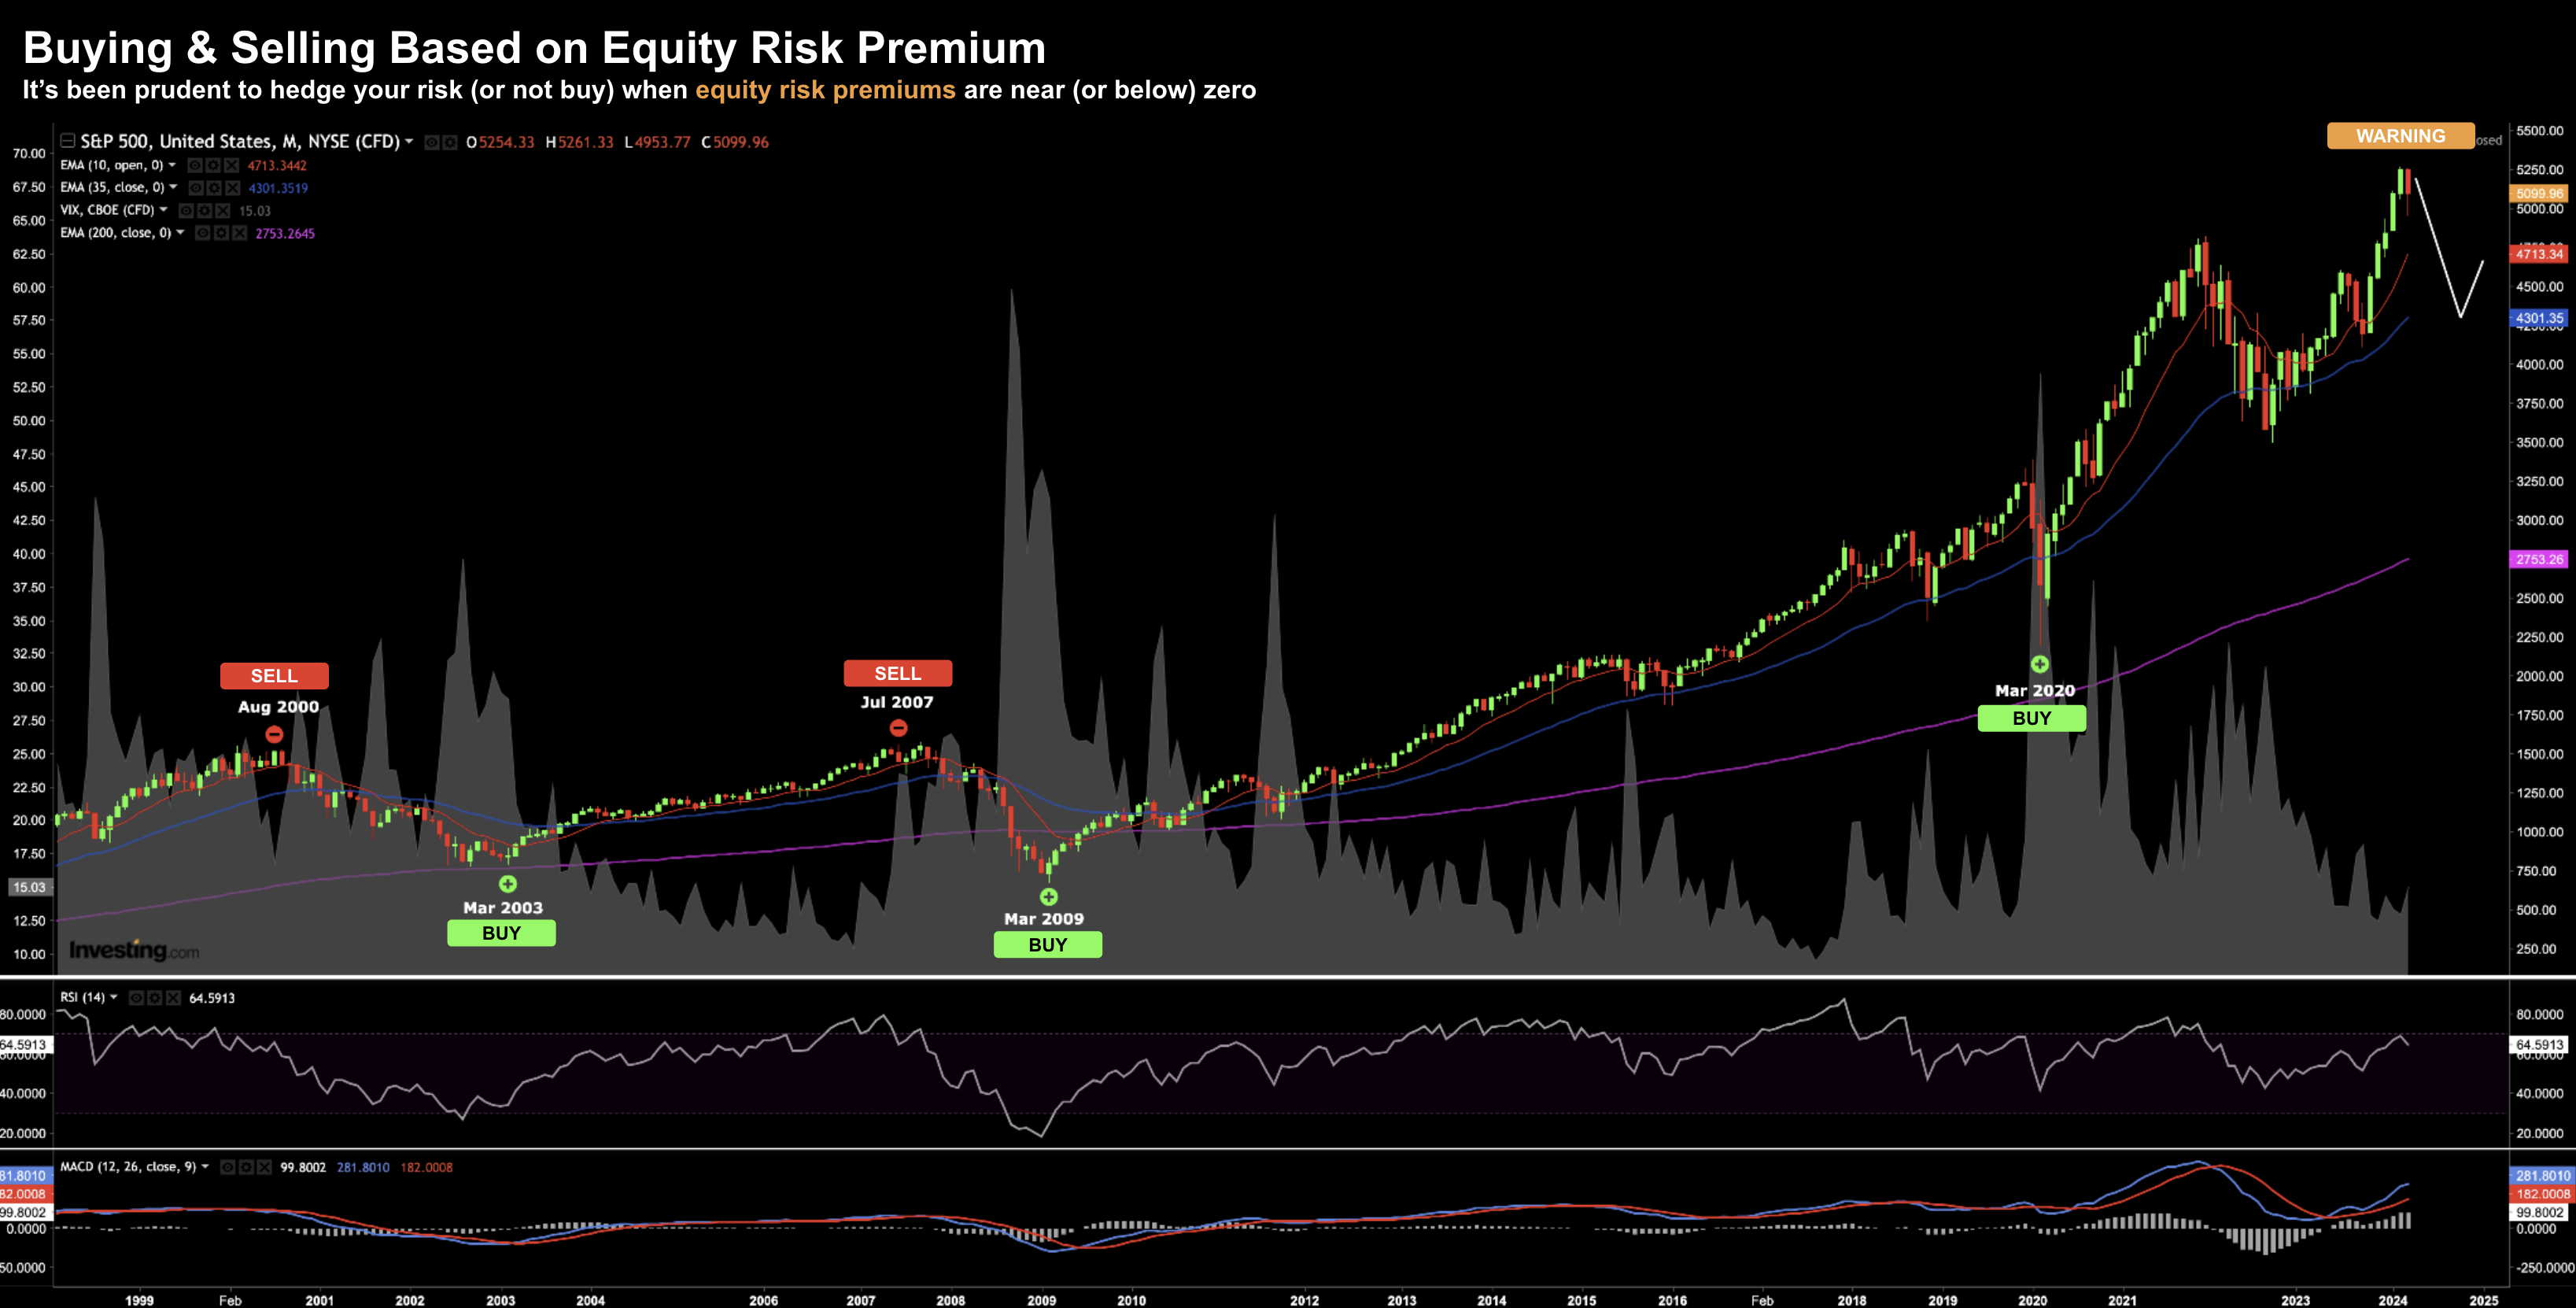
For example, buying the market in March 2003, March 2009 and March 2020 were exceptional opportunities.
Similarly, selling (or at least hedging) when the equity risk premium was at or below zero (e.g., Aug 2000, July 2007) was prudent.
In these cases, the market went on to lose around 50%.
At that point, equity risk premiums improved dramatically (i.e., as yields fell with asset prices), creating great opportunities:
April 26 2024
So here we are….
Equity risk premiums are at or below zero at the time of writing (if using the 2-year at 5.0% and/or 10-year at 4.66%)
Again, paying 21x forward earnings is not cheap (i.e., a 4.8% earnings yield)
It’s my view this market has negative convexity.
In other words, the downside risks outweigh any potential upside gains (the promise of AI or otherwise).
On the other hand, when equity risk premium is high (e.g. above 3.5%) – the downside risk is lower and upside high.
That’s positive convexity.
In the meantime, we are contending with (AI) momentum and that should not be ignored.
Core PCE Uncomfortably High
The Fed’s preferred inflation measure – core personal consumption expenditures (PCE) – hit the tape on Friday.
And it was slightly hotter than expected (2.8% vs 2.7%).
Below are the monthly numbers for March:
- Core PCE – excludes food and energy – up 2.8% YoY (unchanged from Feb and above 2.7% expected)
- Personal spending rose 0.8% on the month, more than the personal income increase of 0.5%.
- The personal saving rate fell to 3.2%, down 0.4 percentage points from February and 2% from a year ago.
From mine, this does little to change the probabilities for near-term rate cuts.
The ‘good news’ (if there is any) is it probably doesn’t raise the odds of a rate hike (more on this shortly when I talk to insipid GDP)
However, there is very little ammunition in PCE for the Fed to cut soon.
We will learn more from the FOMC next week.
Now as a complete aside, I find it funny when people say we’re “closer to winning the inflation fight”.
For me, this comes how one chooses to define “winning”?
Yes, the acceleration of inflation has slowed.
It peaked at 9.0% YoY. We are now closer to 3.0%
But have prices dropped to a level of where they were three years ago?
Not even close. For example:
- Let’s say the price of ‘something’ was $50.00 in 2021
- Through 2024 – it’s now up 15% and costs $57.50
- But, with inflation slowing, next year it will be “only” be up ~3% (e.g., $59.22)
Question: is a cumulative price gain of ~19% ‘winning’?
Some say yes.
And my guess is we’re not going back to what prices were.
What’s happened is the rate of inflation acceleration has slowed.
What was once ‘9% YoY’ has dropped to an increase of ‘only 3% YoY’.
However, we’ve had to “swallow the 9%”.
This is largely why there is still pain being felt in lower-to-middle income households (where energy, food and shelter are not back at 2021 levels)
On the other hand, wealthier families that either (a) own their homes; or (b) have exposure to risk assets like stocks – probably feel good about things.
Their exposure to speculative assets directly benefited from excess inflation.
Inflation is a poor man’s tax.
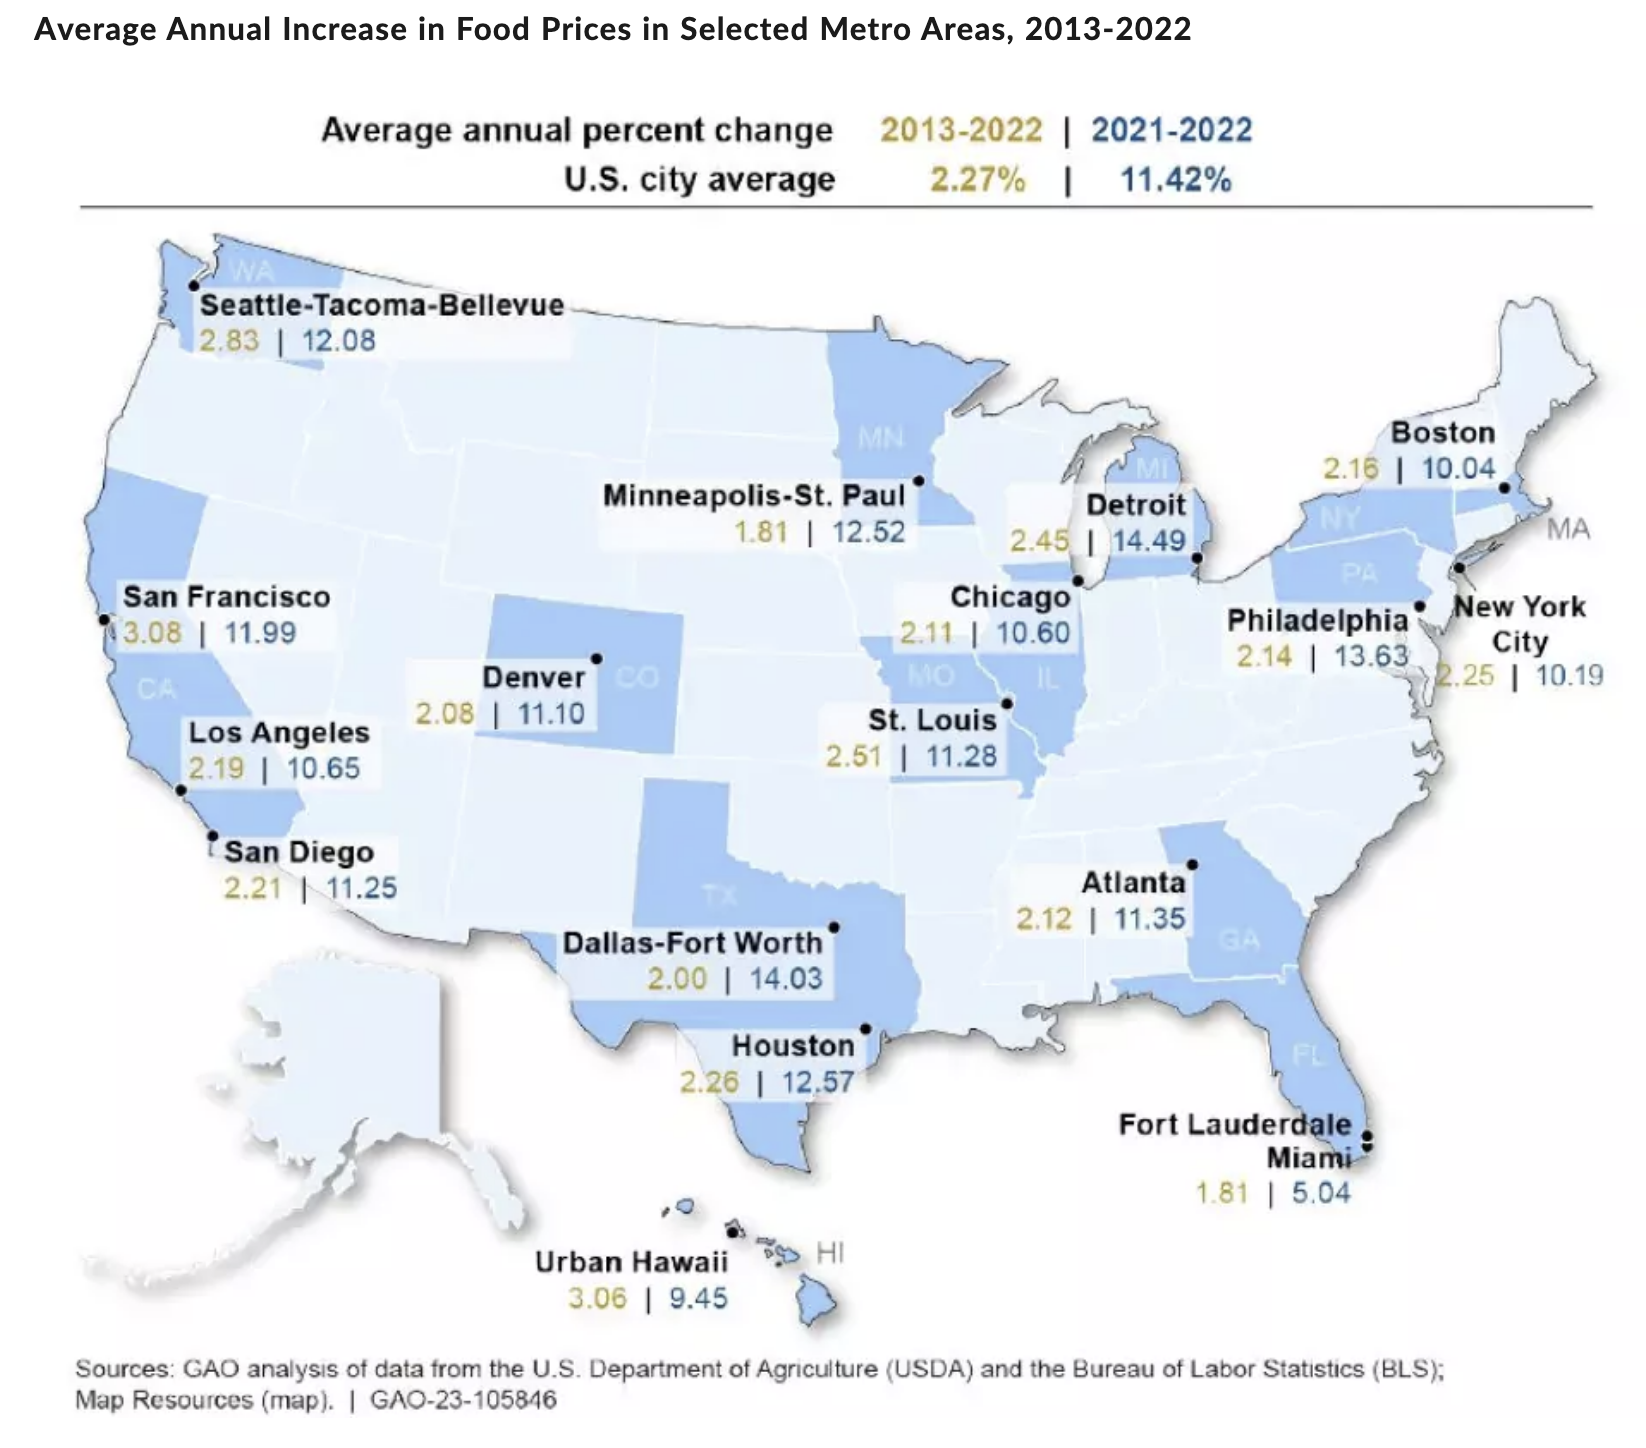
By way of example, have a look at the average gain in food prices across the US over 2021-2022:
In San Francisco (where I live) – food prices jumped 12% over 2021-22 – and have continued to climb ~3% each year through 2024.
That equals a total price rise of ~19% in less than 4 years.
Have you experienced something similar?
It might be what you pay in insurance for your home or your car? Or your electricity bill? Maybe it’s the rate you pay on your credit card?
Is what you’re paying today close to what you paid in 2021?
So in summary…. expect to hear the (false) narrative we’re “winning the fight” with inflation.
That’s from an economist’s lens.
Reality is prices continue to rise and we’re paying a lot more for almost everything (specifically non-discretionary items like food, energy, health, insurance etc)
That’s why average income households feel lousy about the economy – as it’s being felt ‘at the kitchen table’.
And when GDP slows – that pain becomes more acute.
Anyone Notice GDP?
For those not hypnotized by all things AI – the GDP number for Q1 was not great.
The silver lining – it gives the Fed some ‘cover’ if talking to the prospect of either
(a) potential rate cuts this year; and/or
(b) tapering of QT in the coming months
The 1.6% result was lower than any estimate in the Bloomberg Econoday consensus range of 1.7% to 2.8%
The increase in real GDP primarily reflected increases in consumer spending, residential fixed investment, nonresidential fixed investment, and state and local government spending that were partly offset by a decrease in private inventory investment.
Put another way, if we remove excess government spending (and borrowing) – growth would have been negative.
I call this “plugging the GDP gap” using the nation’s credit card.
Other points of note:
- Within services, the increase was mostly higher spending in health care as well as financial services and insurance (note: insurance premiums for cars are up over 20% YoY)
- Within goods, the decrease primarily reflected decreases in motor vehicles and parts as well as gasoline and other energy goods.
- The increase in state and local government spending reflected an increase in compensation of state and local government employees.
- The decrease in inventory investment primarily reflected decreases in wholesale trade and manufacturing (i.e. the real economy).
From my lens, there was not much to like about this report.
Government expenditures were a lot higher; private investment continues to ebb; as inflation went up.
Let’s finish with a look at the tape for the S&P 500 – as tech had a better week.
S&P 500 Bounces for Now
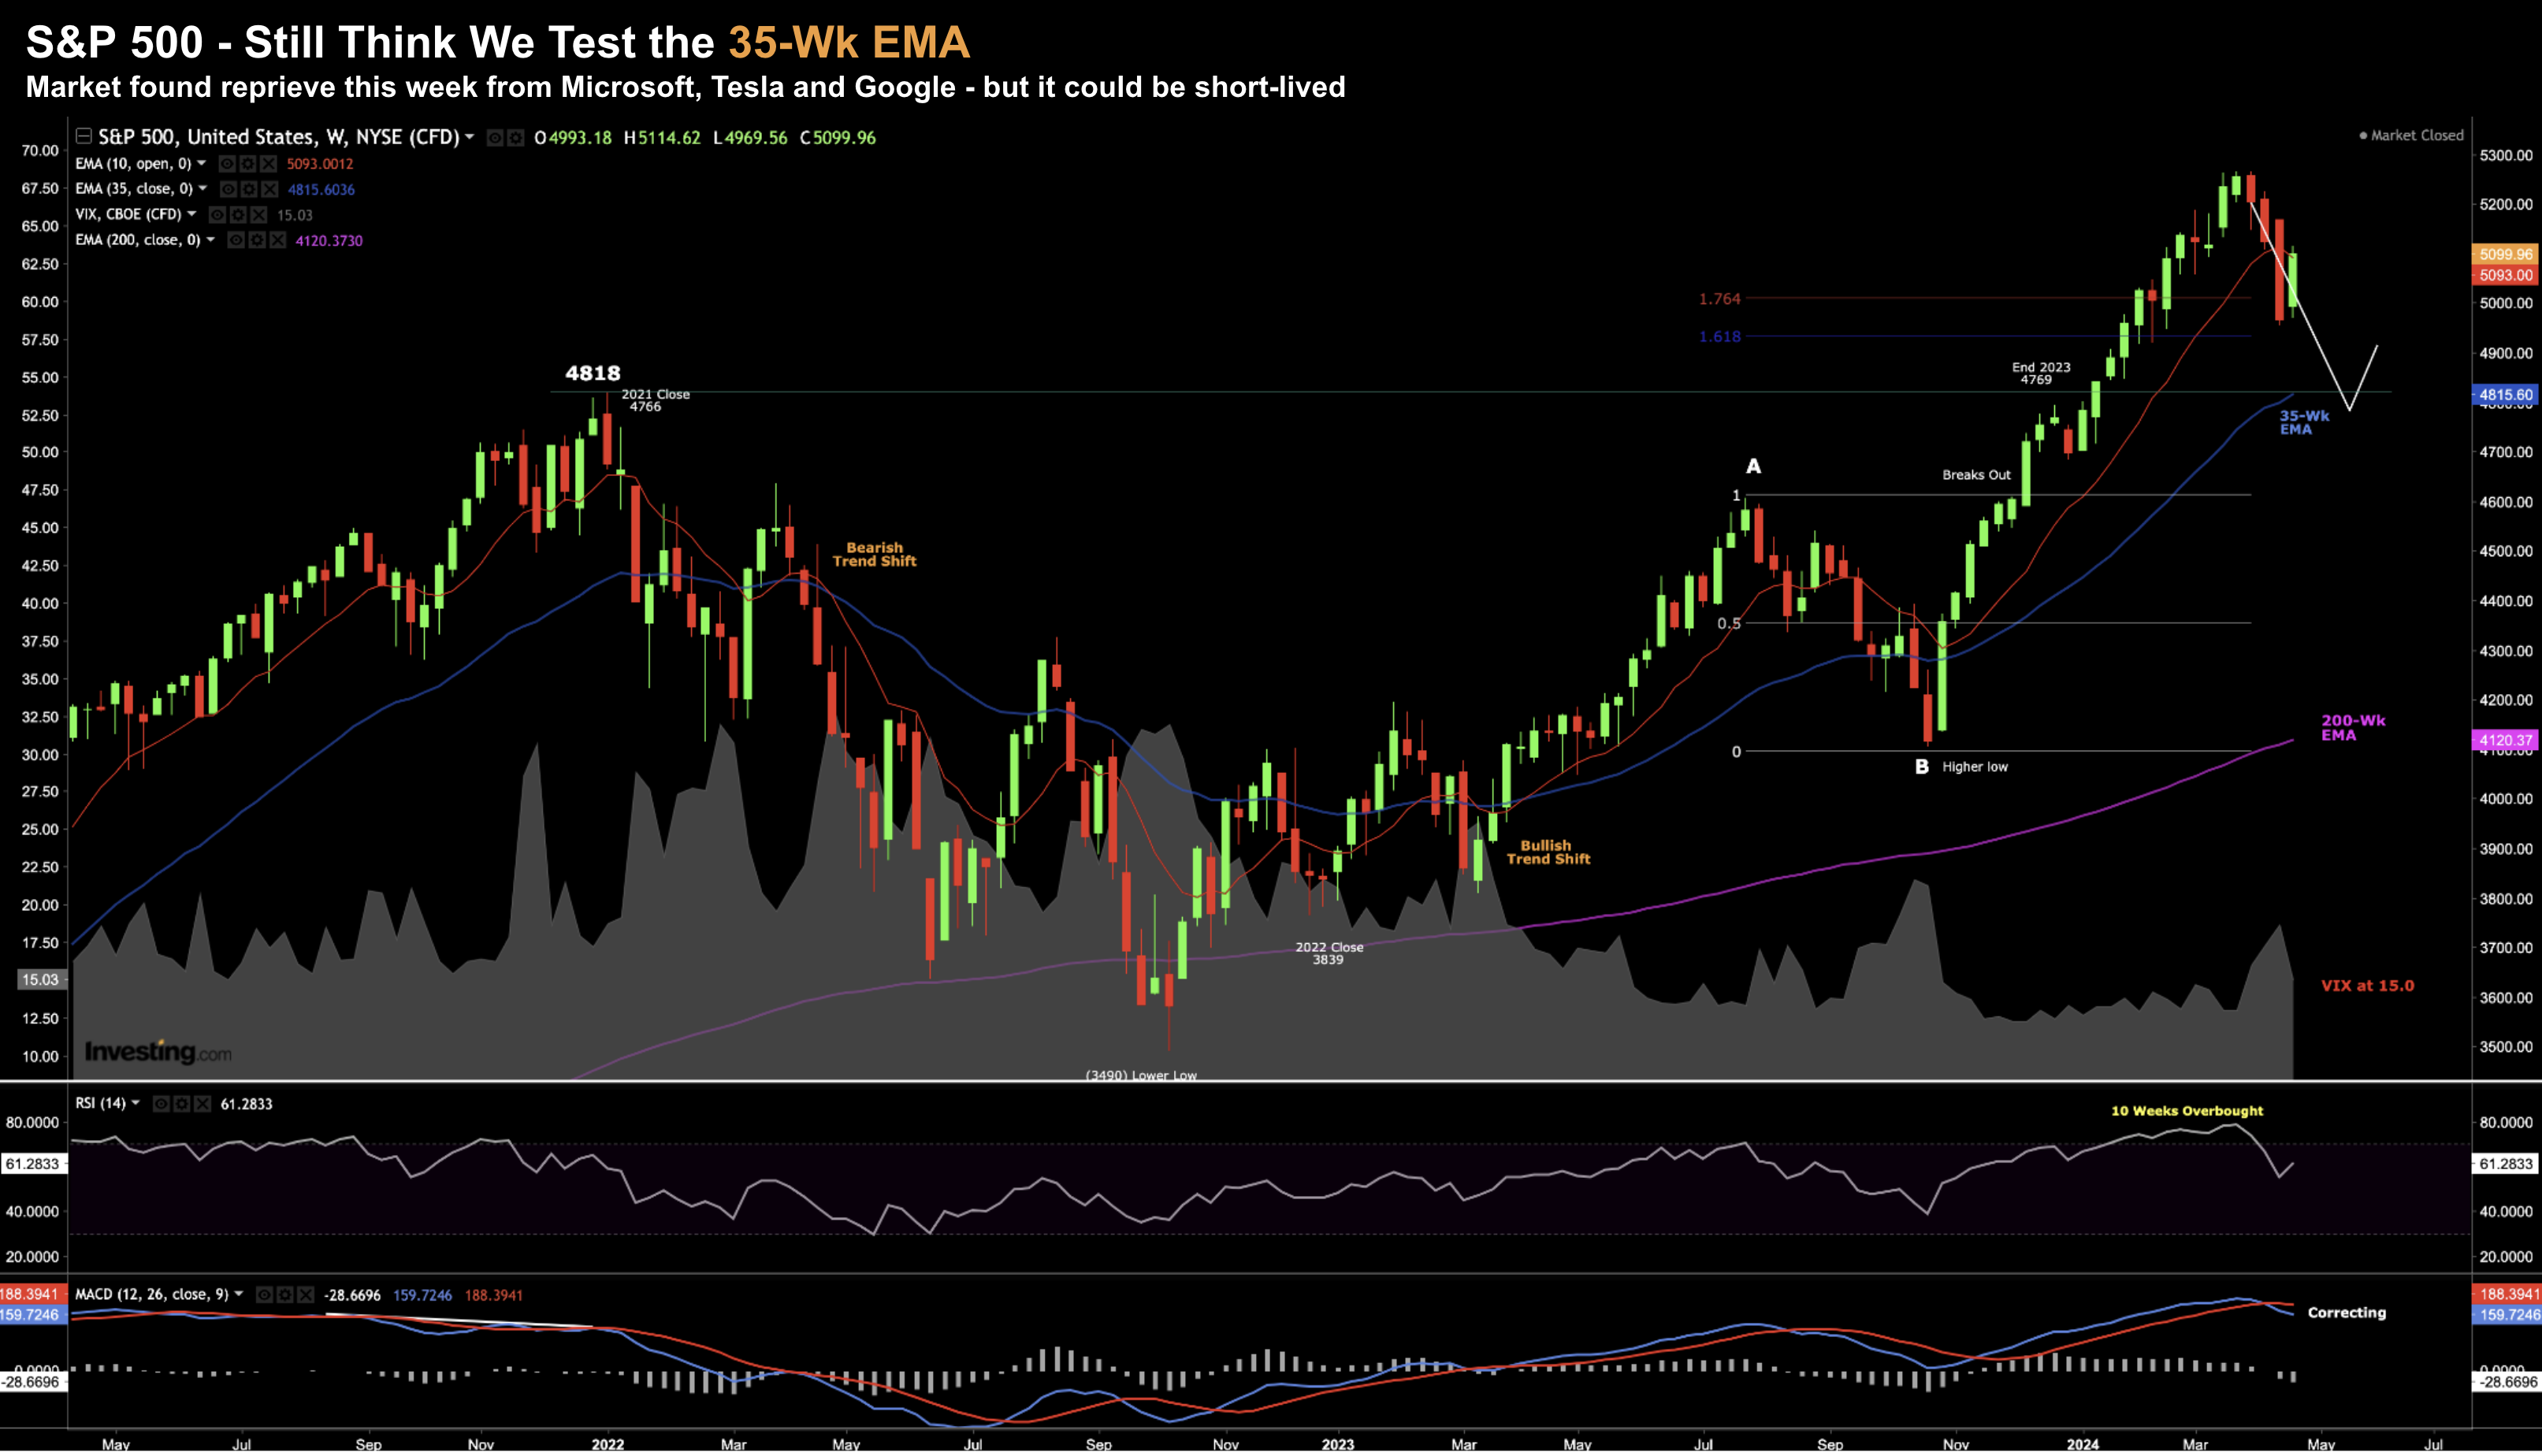
The bounce in stocks this week was not unexpected given the ~5% three-week fall.
But when I look at the weekly chart – there’s nothing which suggests to me the near-term correction is over.
I think we’re still going to test the 35-week EMA zone of around 4800 – which will be a time to re-assess quality companies.
April 26 2024
- The index rallied back to the 10-week EMA (red-line) and found resistance;
- Typically when we break of the 10-week EMA – a test of the 35-week is a matter of time; and
- The weekly-MACD has rolled over which tells us the market is losing momentum.
Whilst the move lower to the 35-week EMA (if it happens) won’t be in a straight line – I think we see more volatility.
Expect big up and down weeks.
But again, should we test the zone between 4600 and 4800 – I think this will attract long-term buyers.
And should the Fed move towards its easing cycle – this will bode well for stocks (as rates fall)
The only caveat is if we see material weakness in the underlying economy (e.g. unemployment rising above 4.0% or inflation rising sharply).
Putting it All Together
Next week we get more earnings (e.g., Apple and Amazon), the FOMC statement and monthly payrolls.
A very quick word on each…
Earnings:
- Bar is now high for Amazon and specifically AWS (web services – the primary earnings driver);
- The market expects YoY growth of 15-20% – which they will likely achieve (given Google Cloud and Azure results);
- Keep an eye on their surging online Ads business – expect it to do well with Amazon dominating all things eCommerce;
- Apple will give us color on the (slowing) impact of China and its iPhone sales (it’s a large part of their growth);
- I will also be listening for any AI narrative (for e.g., what we can expect for AI chips on-device).
The Fed:
- Whilst expected to hold rates steady the next two meetings – sentiment will be important;
- Powell is a ‘natural dove’ – he won’t like being forced to sound hawkish;
- Listen for any revised plans on QT tapering and if they plan to commence in May – equivalent to a rate cut.
Payrolls:
- Market expects 250,000 to 300,000 job additions for March;
- A number below 100,000 or greater than 300,000 could see a strong market reaction;
- Look through the headline print to assess whether it’s full time vs part-time jobs added (my guess is full-time jobs are being lost);
- Pay attention to the number of public sector jobs (e.g., anything more than 60,000 is not good – as it adds to the (unsustainable) US govt. debt load)

