- End of the 20-year cheap money era
- Periods of heightened volatility is a market in transition
- I doubt Monday’s sell off will be the last
Think of a time when you worked through major transition in your life.
For example, maybe it was the end of a relationship; a deep loss; changing your career; starting a family; or relocating for work.
Generally during times of meaningful transition there is a period of adjustment and uncertainty.
And sometimes, the change will come with volatility.
From mine, it’s possible the market’s wild behavior this week is representative of one in transition.
For example, at the start of the week, markets were thrown off balance as the popular carry trade started to unwind.
As I explained here, for well over a decade, traders leveraged cheap money in the form of a Yen to invest in higher yielding securities (e.g., US Treasuries and large-cap tech).
However, with the Bank of Japan intent on raising rates and pulling back from (excessive) bond market intervention – traders see that trade coming to an end.
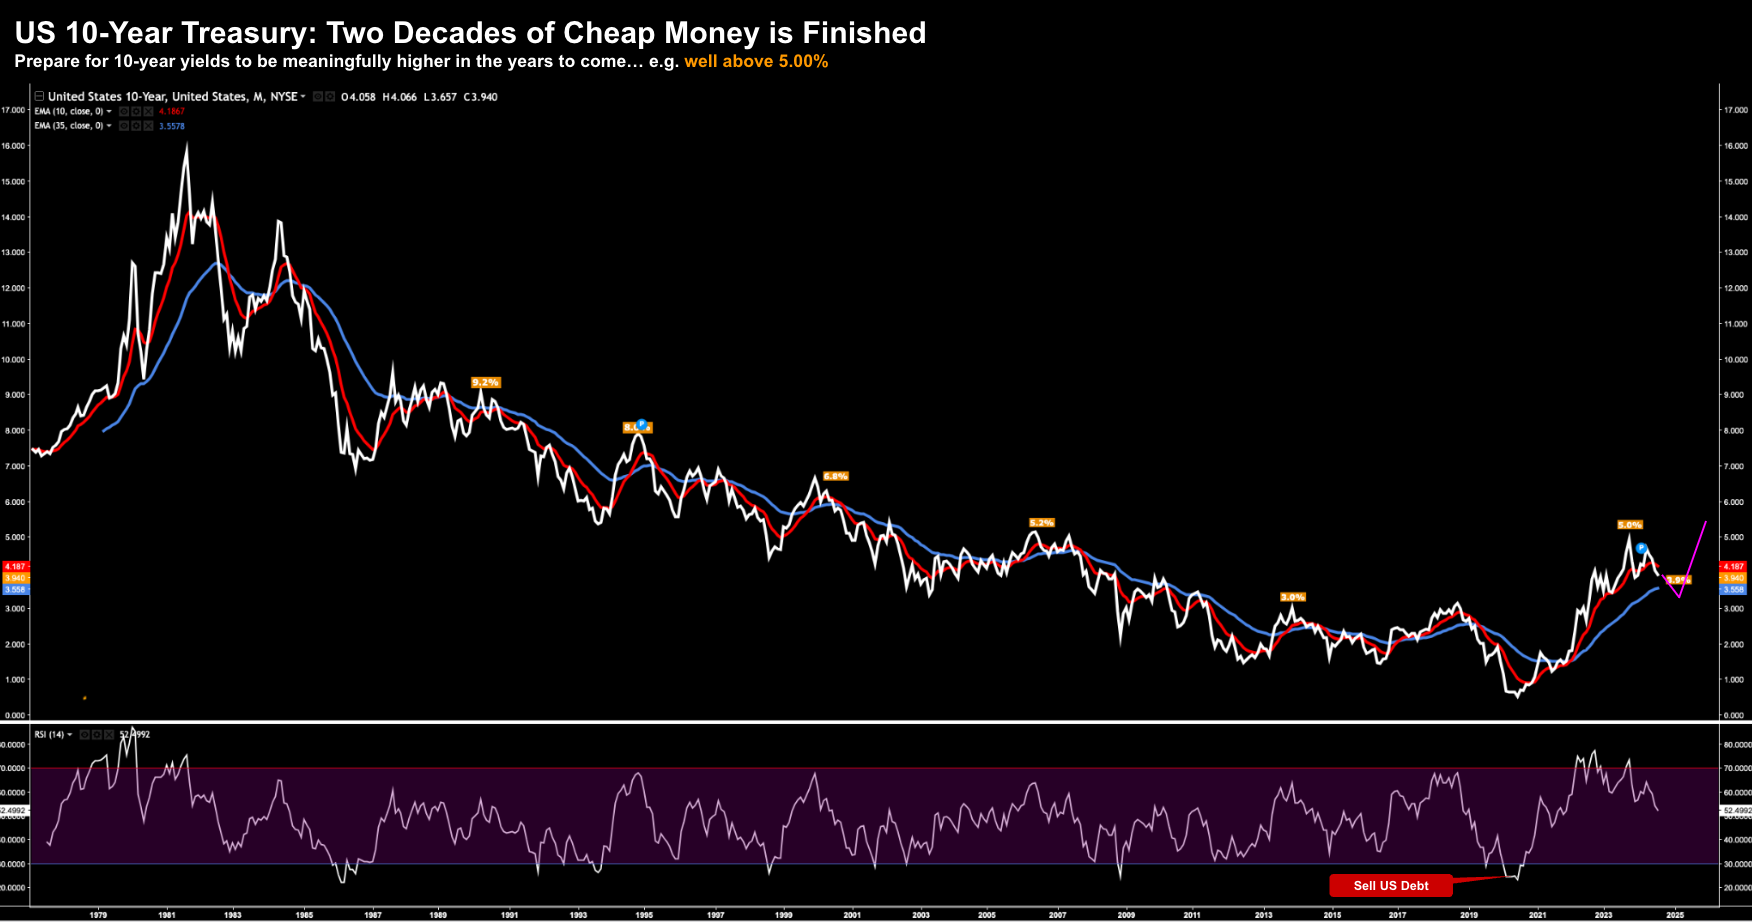
In addition, they’re also starting to accept the days of US 10-year trading well below 3.0% are behind us.
The days of cheap money are over.
And as I posited at the beginning of the year – what worked the past 20 years is unlikely to work for the next 20.
It’s a time of transition.
However, the adjustment won’t be smooth as traders reposition.
This week could be a preview of what’s to come.
Profound Change
Anyone who has only traded post the year 2000 – only really knows a near zero interest rate policy (ZIRP) environment.
From their lens, watching the US 10-year trade has as high as 5.00% (which translates to 30-year mortgage rate at 7.50%) is unprecedented.
By way of example, when I bought from my first house in 1996 – I borrowed money at ~8.00% – and thought that was a great deal.
For example, only a year prior to 1996 – I saw rates trading much higher. In 1995, the US 10-year traded with an 8-handle…. meaning consumers were paying in excess of 10% for average 5-7 year term mortgages.
And that was considered normal…
However, what’s not normal is a mortgage rate below 5.0%. That’s something you may only see once in a generation (if you are lucky).
When examined over the past 50 years (see below) ~5.00% for the 10-year is lower than the long-term average.
But the transition away from ‘ultra easy money’ is underway…
Aug 9 2024
The longer-term chart offers us much needed perspective.
For example, when I said the other day it’s quite feasile we see the US 10-year at 6.0% at some point over the next few years – one reader replied “I hope not – the world is not ready for that”
He’s right – they are not – not with the amount of leverage now in the system.
For example, leverage in the public sector (unnessarily exaggerated due to COVID); leverage against homes in the form of mortgages; leverage against business; and in some cases – leverage against stocks.
Over the past several decades – the trend for interest rates has been one low followed by another.
However, falling rates were also the nitrogen which powered speculative assets.
The 10-year yield (and rates) bottomed during the height of the pandemic (mid 2020) – at close to 0.50%
Since then we’ve watched rates start to normalize.
The Fed (finally) extracted themselves from bond market intervention (i.e., quantitative tightening) – allowing for market forces to determine the rate for debt.
And as we’ve seen – it turns out market forces decided that rate is a lot higher.
And it makes sense. Investors who are willing to forgo capital for lengthy periods deserve compensation.
However, that was not the case the past twenty years – where it favoured asset speculators.
Combined with the Fed raising their effective funds rate (i.e., the short-term rate banks lend to each other) by 500 bps – this saw yields rise across the curve.
But what this long-term chart tells us is the leverage we enjoyed over the two decades is now working its way out of the system.
That’s the transition in play. That’s the adjustment.
Again, what we saw on Monday (late Sunday) with the Yen carry trade starting to unwind (with the stronger Yen) was an example.
For example, I read this week the carry-trade is estimated to be the tune of almost $20 Trillion.
But how much of that is leveraged?
That would be good to understand but difficult to estimate with an accuracy.
However, this week saw some of that leverage coming out of the system.
And areas which have benefited from excessive (speculator) leverage are starting to work through adjustment.
That’s what lies ahead…
And whilst stocks enjoyed a nice recovery the past few days (more on that shortly when I share the chart) – a 20-year old carry trade doesn’t simply unwind in just one session.
Some traders might think “we dodged that bullet” – as the S&P 500 reversed its earlier losses.
But it’s too soon to make that claim. There are likely to be more days like Monday.
Whether the asset class is large cap tech, commodities, private credit or oil markets – take your pick – we’re going to see periods of sharp adjustment.
But there’s good news…
As we work through this transition – clearing the excess leverage – financial markets will be a better for it.
They will be stronger.
It’s not going to happen fast… and it may take a couple of years.
However, we should expect many more weeks like the one we just had.
Whilst we can’t predict – we can always plan. And from mine – this is not reason to panic – it spells opportunity.
What I’m Watching Next Week
The other day I shared a few leading indicators which will help us to see what’s happening with the consumer and the economy.
My preferred three indicators are:
- YoY Change in Quarterly Real PCE;
- YoY Change in Quarterly Real Wages; and
- Credit Spreads (as a measure of the financial system)
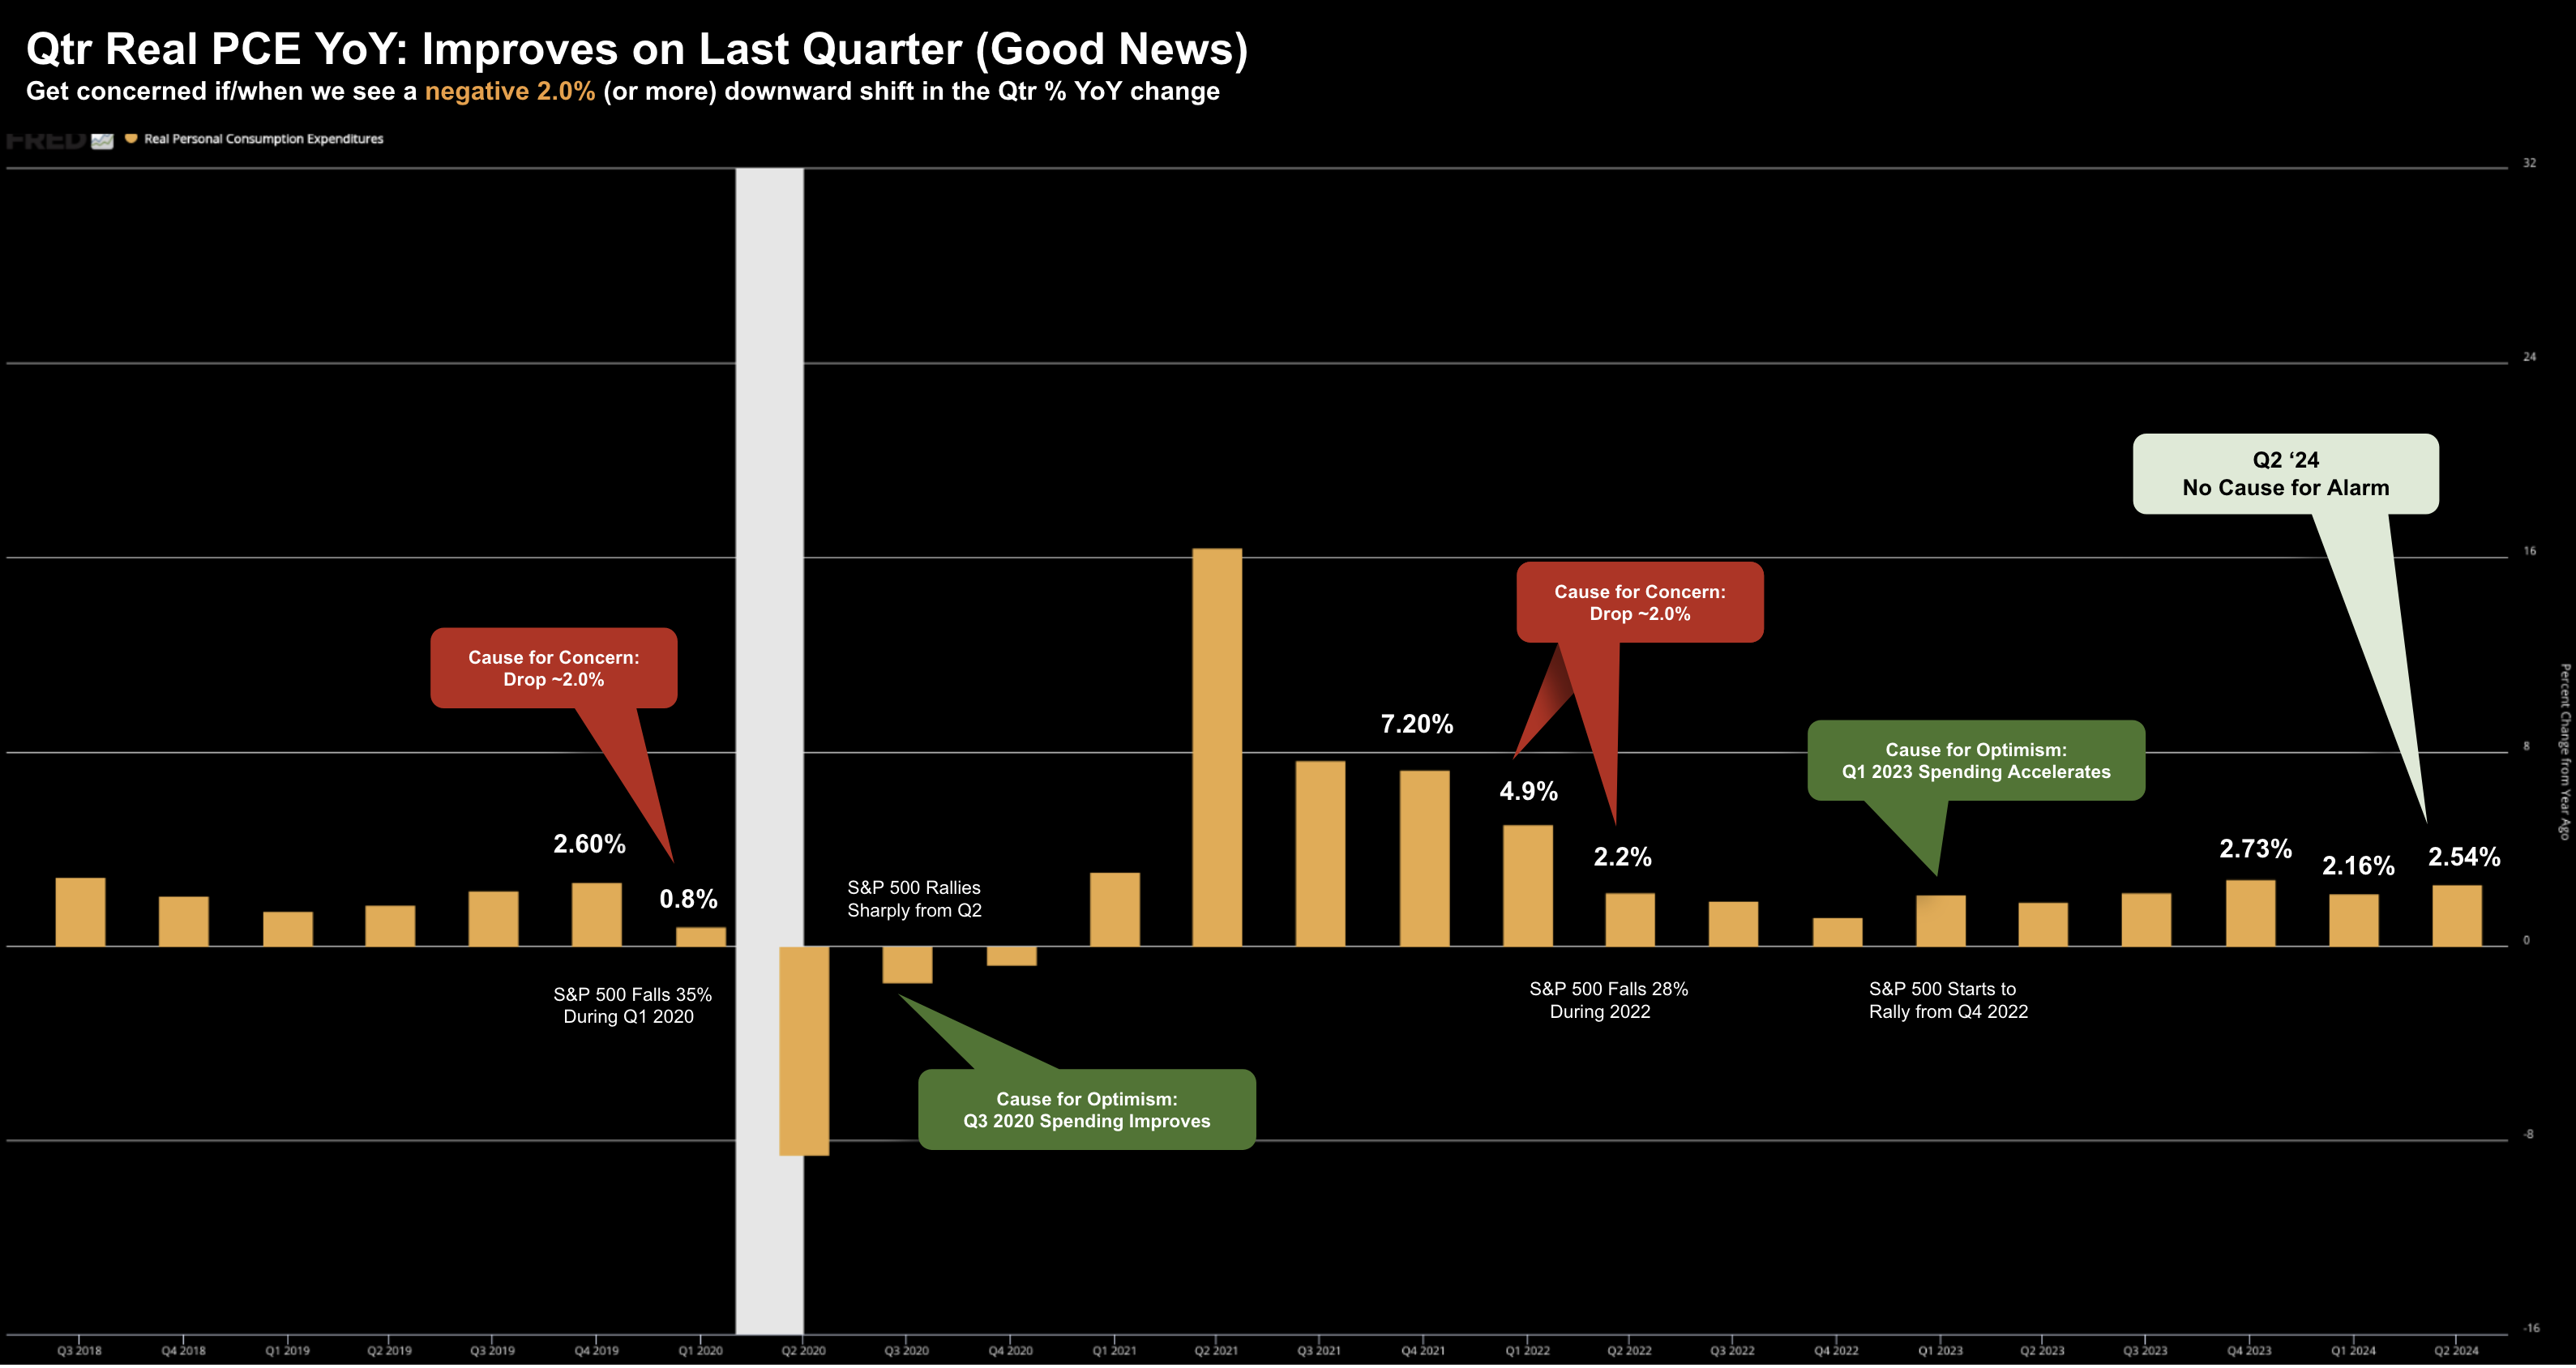
With respect to Real PCE – this is 70% of GDP.
This is a proven, consistent leading indicator in terms of both the health of the economy and the direction of the stock market.
For now, consumers continue spend:
And as we continue to get monthly PCE prints (consumption and expenditures) – I will update the quarterly year-over-year chart.
Now next week (August 15th) we get a very important print: monthly retail sales.
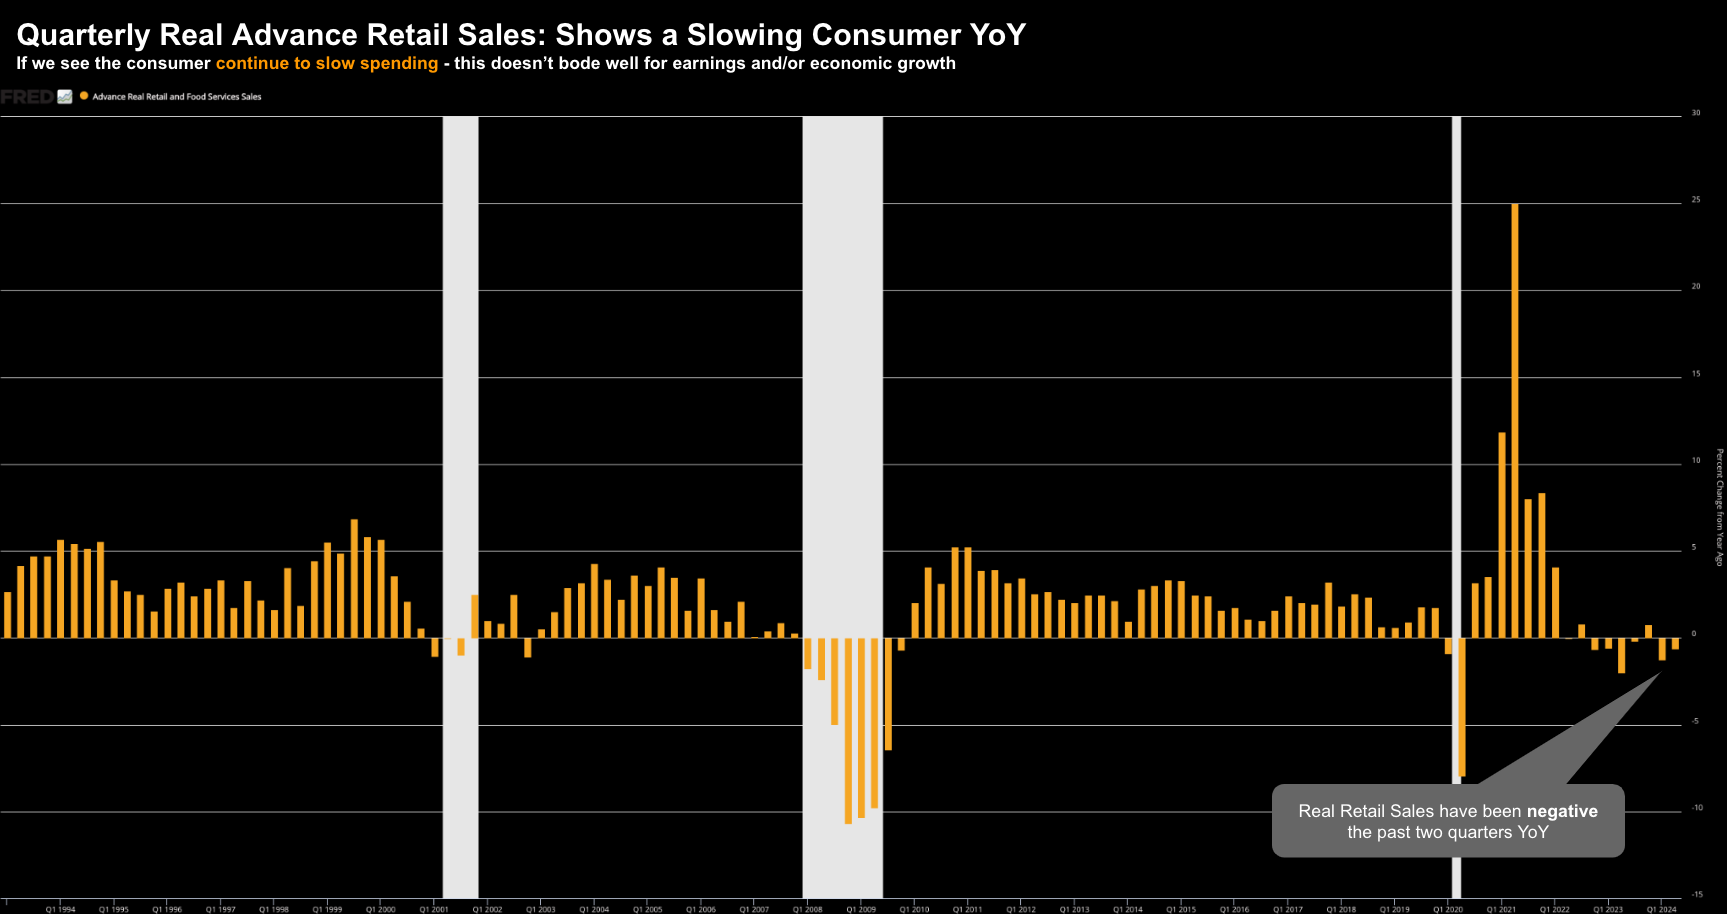
Below is the quarterly year-over-year change in real retail sales; i.e., those adjusted for inflation.
As I highlighted last month – in real terms they are negative.
This is why we’re seeing sales (and margin) warnings from the likes of discretionary companies such as Nike, Lululemon, Starbucks, McDonalds and many more.
Slow consumer spend impacts corporate profits – which impacts investment – which impacts employment.
The only retailers doing well are those who offer non-discretionary (like food).
Given food inflation continues to be high (in excess of 3-4%) – this is why these companies are outperforming their (discretionary) peers.
For example, whilst a retailer like Walmart might show 3-4% sales growth, that’s a nominal figure (i.e., driven mostly by food inflation)
When adjusted for inflation – their sales would be largely flat.
As an aside, we get earnings from Walmart and Home Depot next week – this will give as a read on the consumer.
Let’s turn to inflation…
July Consumer Price Inflation
Next Wednesday we also get Consumer Price Inflation (CPI)
As readers will know, I feel this is now less important (its last year’s story).
The market sees CPI coming in at a month-over-month increase of 0.2% – with a year-over-year number just below 3.0%
If these expectations are met – it will help build the case for the Fed to cut rates in September (where excessive inflation is no longer a risk)
However, if CPI were surprise to the upside (e.g., a MoM number perhaps closer to 0.4% – it’s possible markets will dial back their expectations for more than three rate cuts this year)
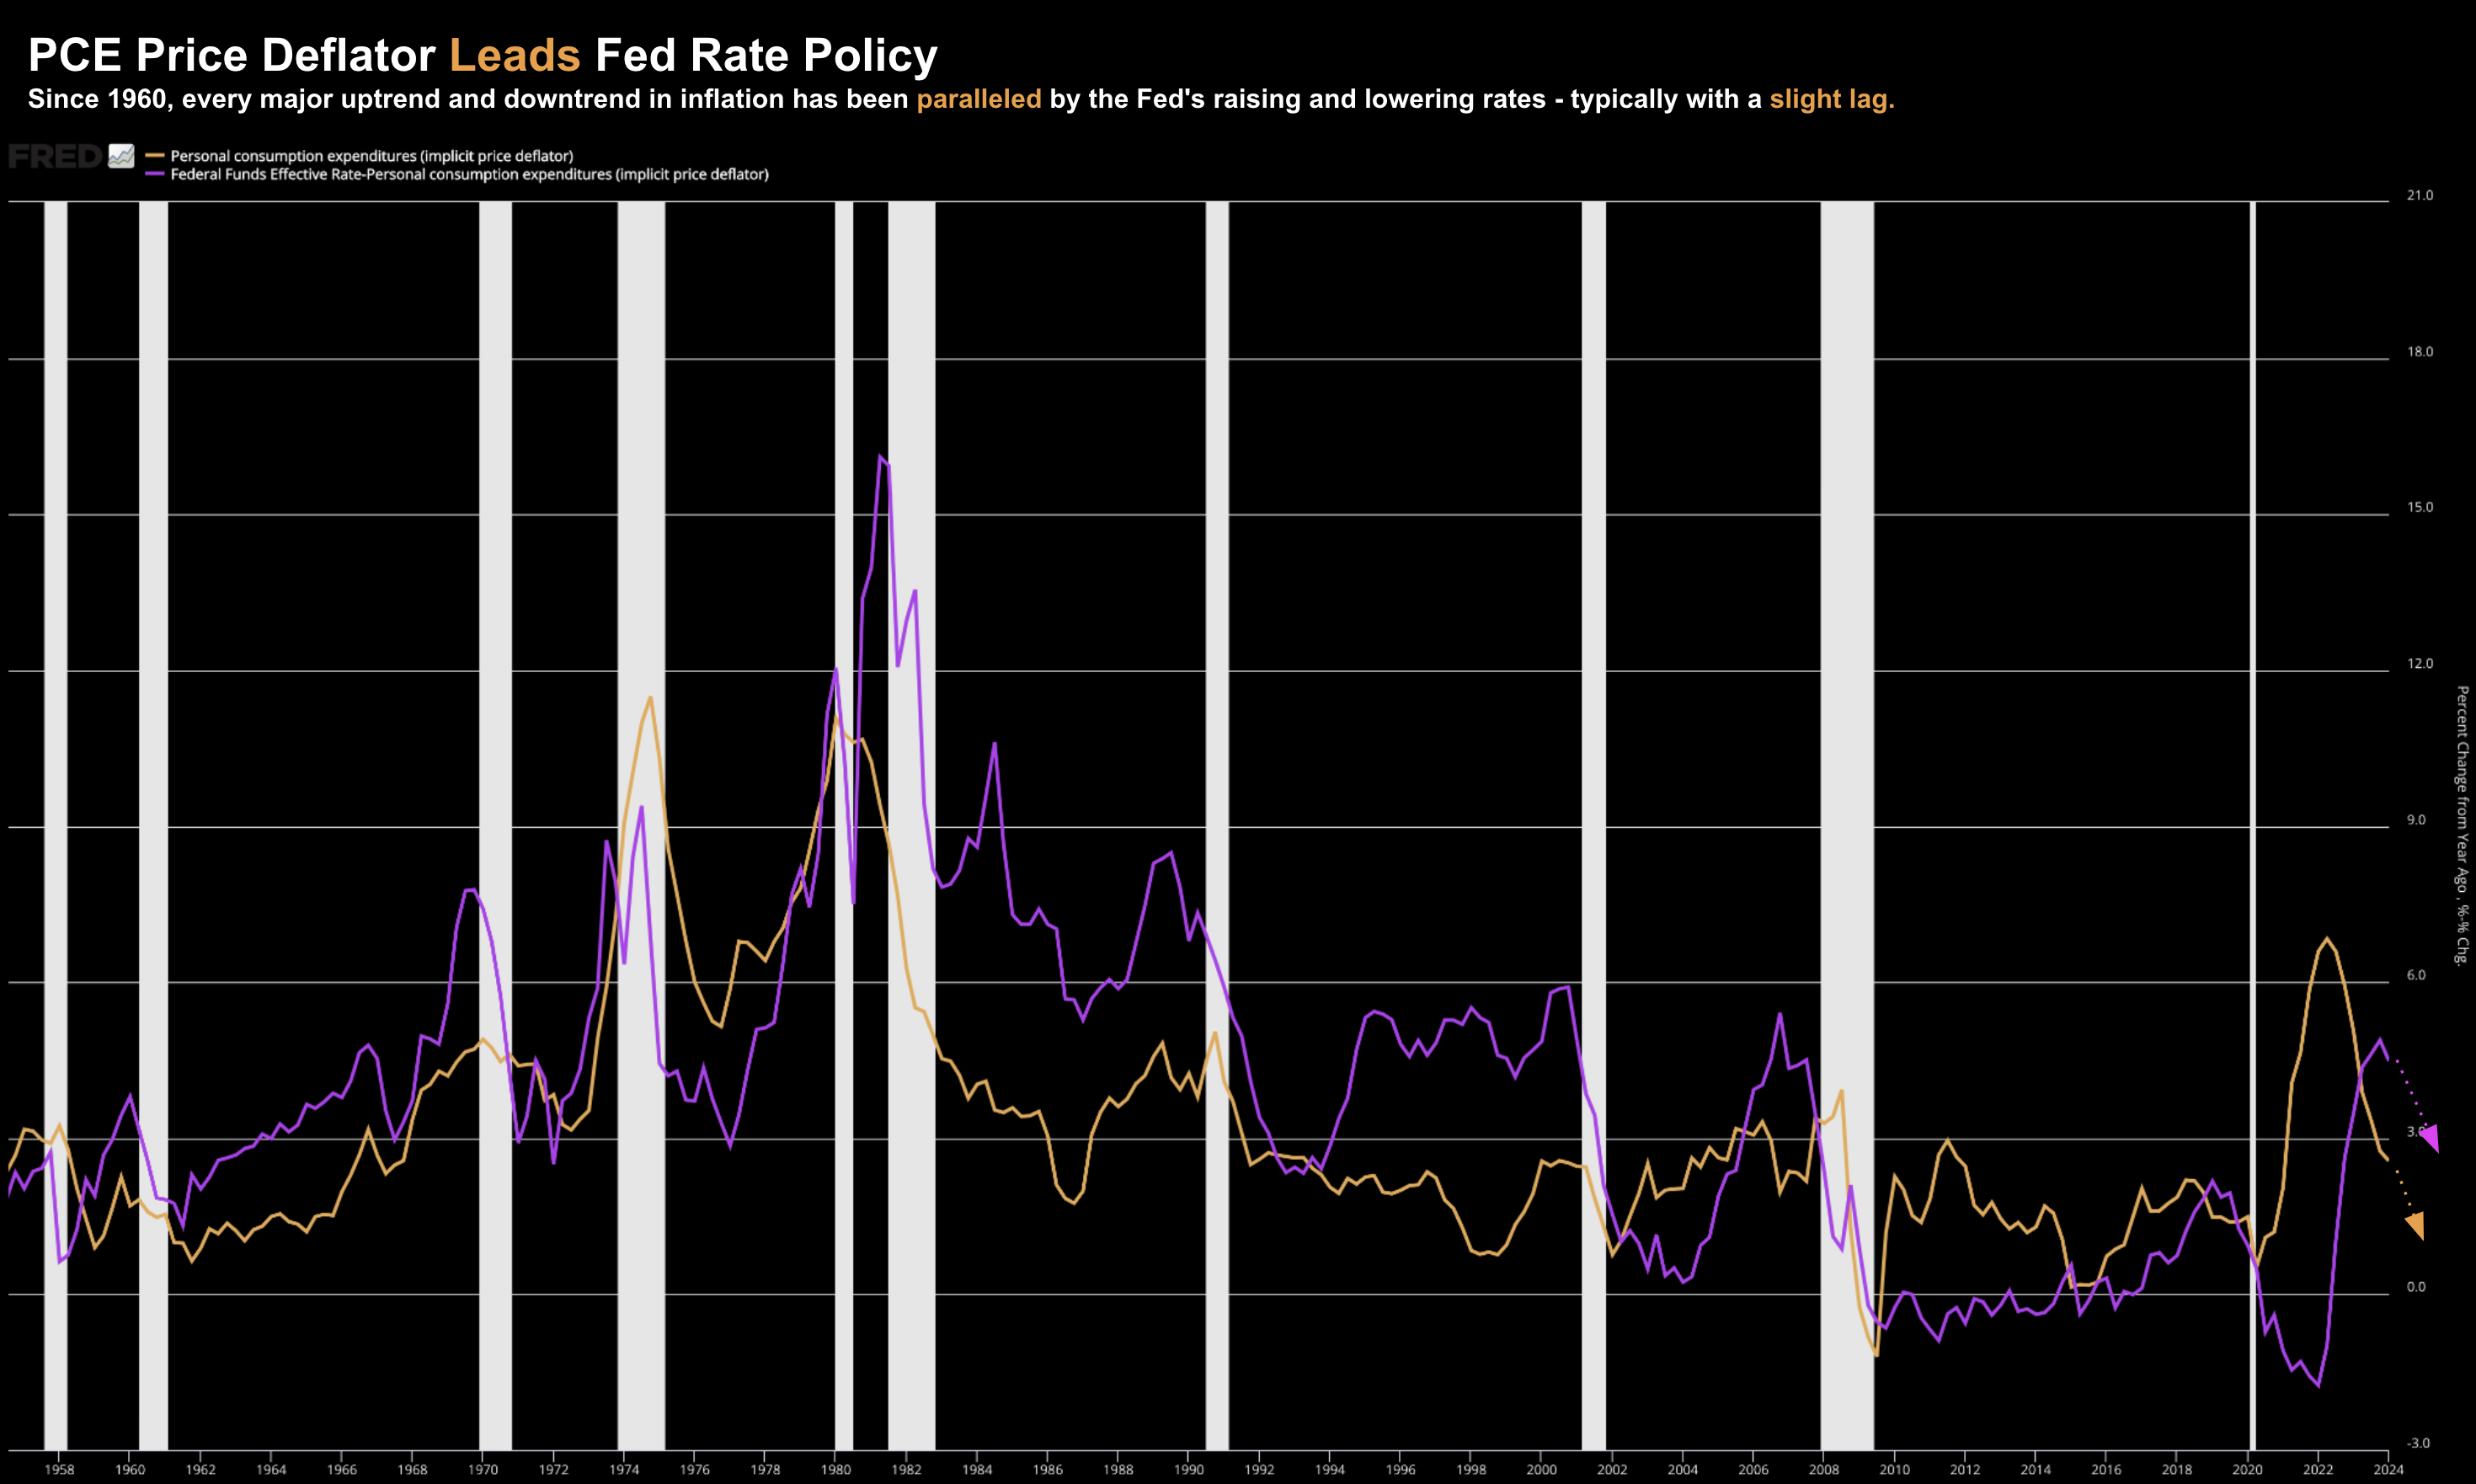
As I demonstrated last month – the trend in inflation (orange line) will typically force the Fed’s hand lower.
Inflation leads Fed policy – not the other way around.
And from that lens, the Fed will most likely cut rates three times this year – as they try to “save” a soft-landing.
Question is – will “25, 50 or 75” bps rate cuts make any material difference to what consumers spend on discretionary goods (which are generally not financed)?
Probably not.
Volatility Signals Transition
After going 357 days without a single day moving more than 2% – this week saw the best and worst days since 2022.
Welcome back volatility – I’ve missed you!
Here’s how things ended (using the weekly timeframe):
Aug 9 2024
If you happened to be relaxing on the beach all week – enjoying a cold adult beverage – only to check markets the following Friday – you would have concluded “not much happened”
We closed at 5346 last week; and 5344 this week.
No big deal…
But the large green candle tells the story…
The markets opened the week sharply lower – pretty much at the 35-week EMA.
As the week moved on – the market began to claw back its steep losses – closing the week at its high.
For those less familiar – a red candle is where the market opens the week higher than it closes.
And whilst the 2 point change doesn’t seem like much – the price action tells us a lot.
From mine, the most notable takeaway is the extreme move in the VIX (e.g., grey shaded area below the price chart – left-hand axis)
Monday this hit a level not seen since 2020 – trading as high as 60 for a moment in time.
That is representative of the adjustment associated with transition.
It settled around 20 – a lot higher than the average value of 12 we saw from May through July.
12 is an overly complacent market.
A VIX at 20+ tells me there is still a lot of unease in the market (despite the rally to close the week).
Monday’s selling is unlikely a “one and done” event.
Further to my preface – when we get extreme volatility – it’s the market expressing uncertainty. It’s what comes with transition.
Now here’s what’s important:
Monday is not reason for panic. As I expressed at the time, there will be terrific opportunities for savvy traders to capitalize on entries in quality stocks.
Use this time of heightened volatility to get your Christmas shopping list ready.
And whilst you will likely wear some pain in the near-term (e.g., 20% or more – as we work through transition) – there will be quality assets at reasonable valuations which will serve you well over the next 3+ years.
But you have to be okay owning these as they potentially work their way lower.
For example, given we cannot forecast a bottom, consider taking a half position initially (1-2% of your total capital).
From there, should volatility see the stock plunge another 10% to 20% – consider making it a full position in your portfolio (2-5%).
Tip: avoid making any stock more than 20% of your total holdings. For me, that’s far too much concentration risk.
And from there, settle in for the next 3+ years and allow the trade (and business cycle) to work.
Quality business at fair valuations typically do very well over time.
And whilst they can move around violently in the short term (e.g., where short term is 1-2 years) – if they’re strong cash producing machines – with strong balance sheets and competitive moats – their prices are likely to reflect this.
Putting it All Together
A highly volatile market is often one in transition.
It’s adjustment to a new era.
We’re just start to work our way through the end of (ultra) cheap money.
For me, the unwinding of a 20-year carry trade is unlikely to happen in one trading session.
This will take place over time – where traders should expect for more days like Monday.
But it’s not reason to panic… it’s simply part of the process.
And whilst I don’t pretend to know how low the market could go (note – I think 4500 is a decent area to get long the S&P 500 Index) – there will be ample opportunity for traders who:
(a) have kept some powder dry; and
(b) know what specific assets to target.
This will be a market for stock pickers.


