- More on why investors should ask valuation questions
- Price-to-Sales ratios parallels to CSCO from ~25 years ago
- AI will be truly transformative – but that’s not the debate investors should be having
This is a follow up to the post I issued yesterday.
As context, I questioned the price-to-sales multiple for some of the semiconductor stocks which have soared the past 6 months (specifically Nvidia)
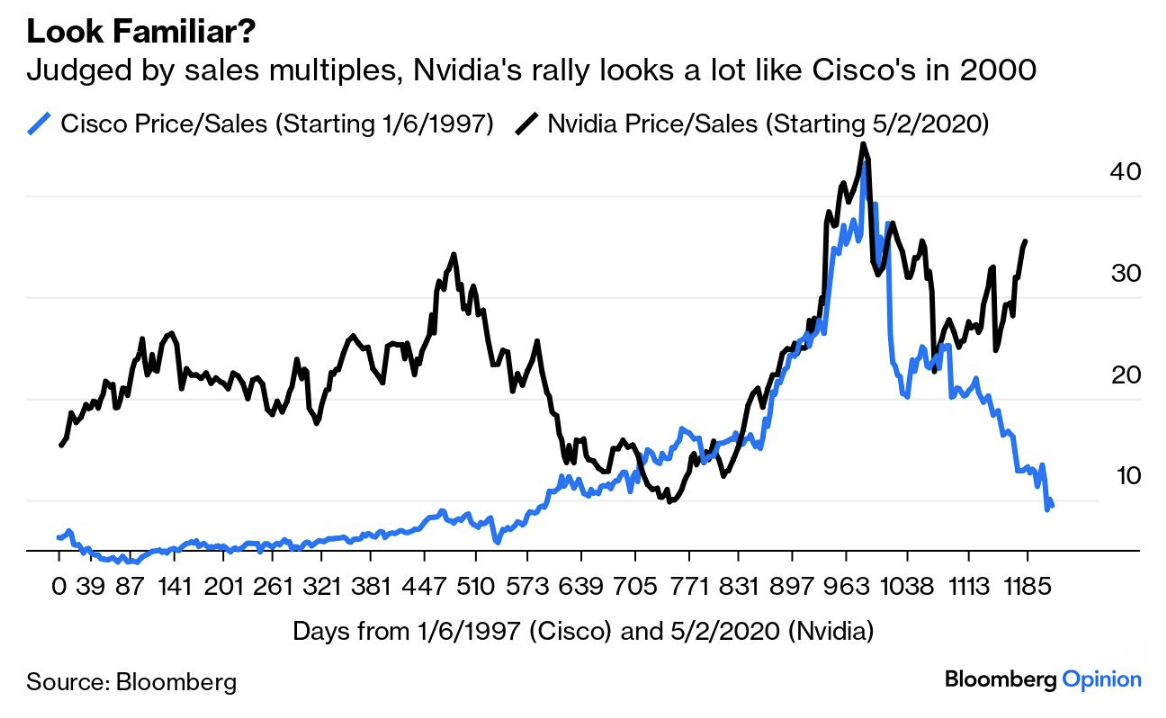
Not only does the price action look technically extended – Nvidia (NVDA) carries a 35x price-to-sales multiple.
For those less familiar – that assumes a very high (sustained) growth rate.
Question is whether we can make that assumption?
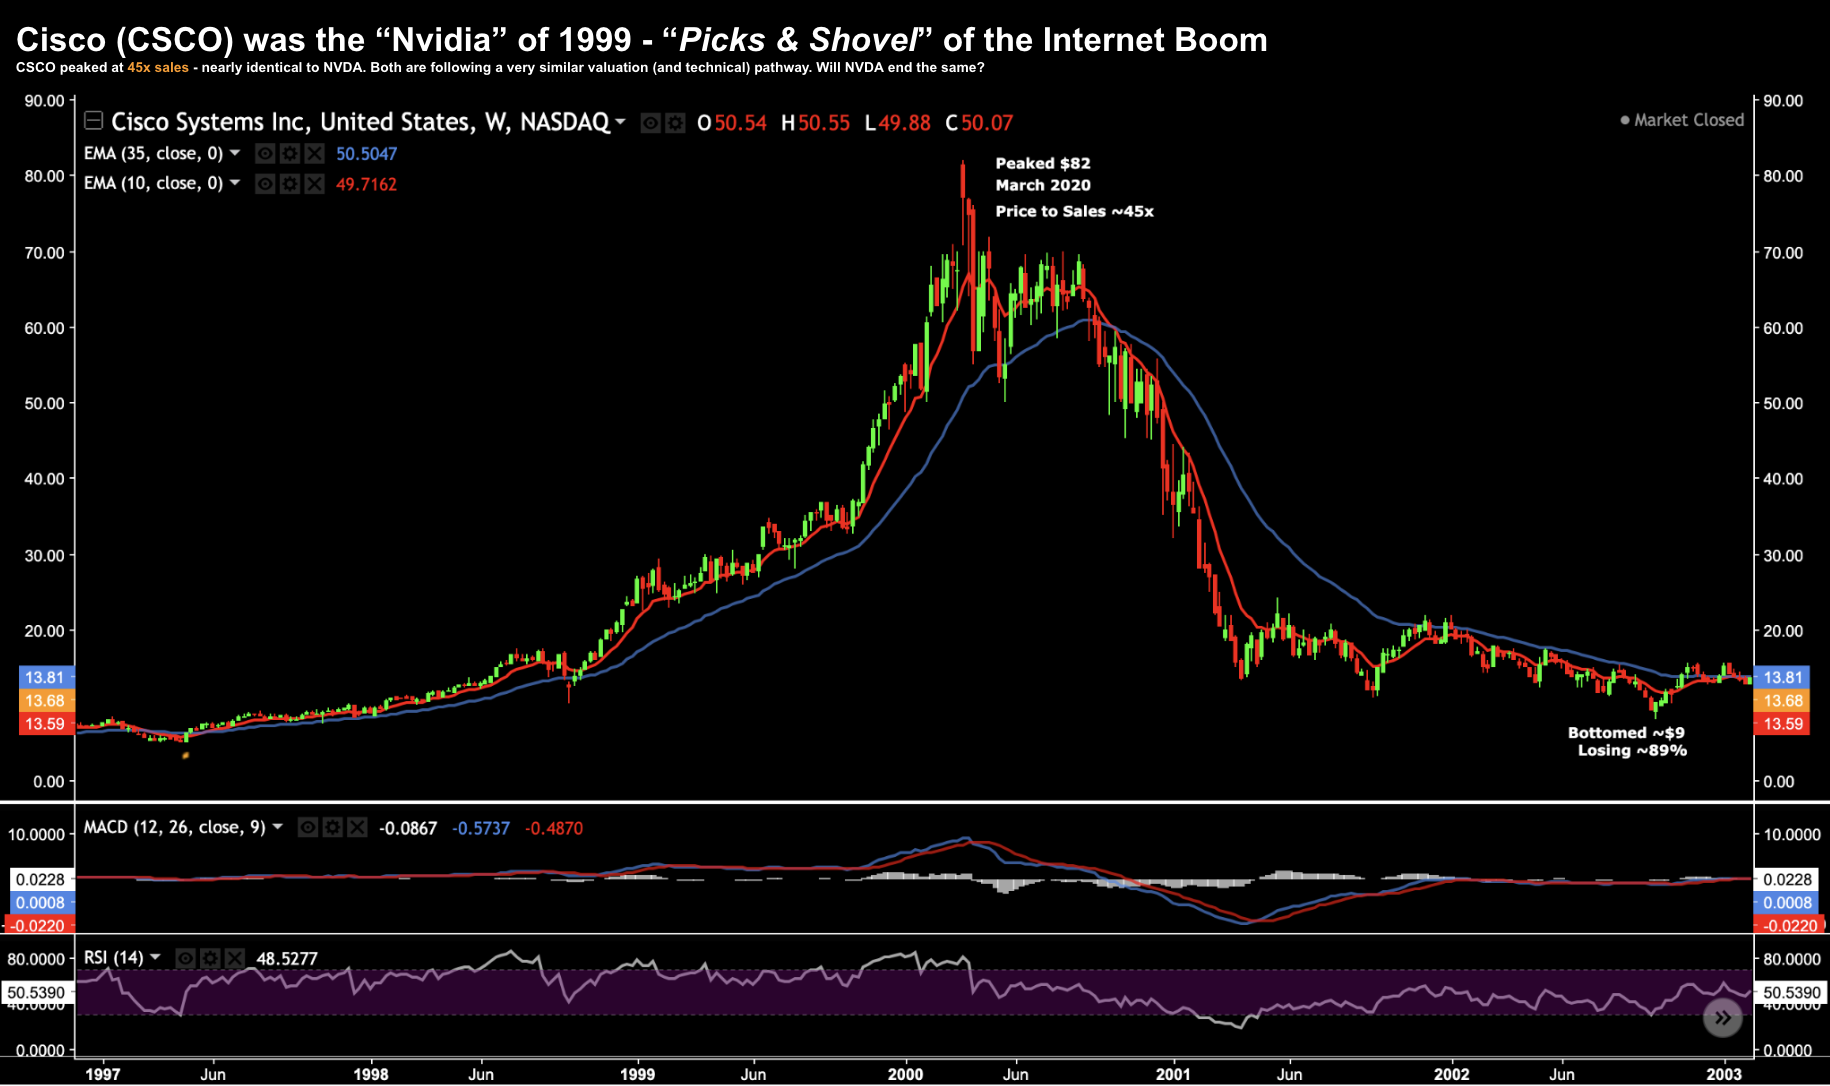
As I’ll explore below – we saw something very similar with Cisco’s (CSCO) valuation during the dot.com bubble.
Below is how the networking stock traded pre and post the 2000/01 bubble.
March 12 2024
Today, CSCO and NVDA are not only charting a similar technical patterns – there are also similarities with valuation metrics.
But what we don’t know is if they’ll end the same way (where CSCO lost ~89% of its value two years later).
Shortly after I published my thoughts – Bloomberg’s John Authers echoed my concerns – furnishing us with some useful comparison charts.
His insights (and charts) are worth sharing.
Is this Sustainable?
Investment bubbles are generally about crowd behavior and over-enthusiasm, so you can trace them in valuations and price action; but it’s important to understand that some bubbles can be driven by the fundamentals of the companies themselves.
The bubble of over-enthusiasm comes from people buying their products and the prices they’ll pay, rather than from overheated behavior in the market, but the results can be similar.
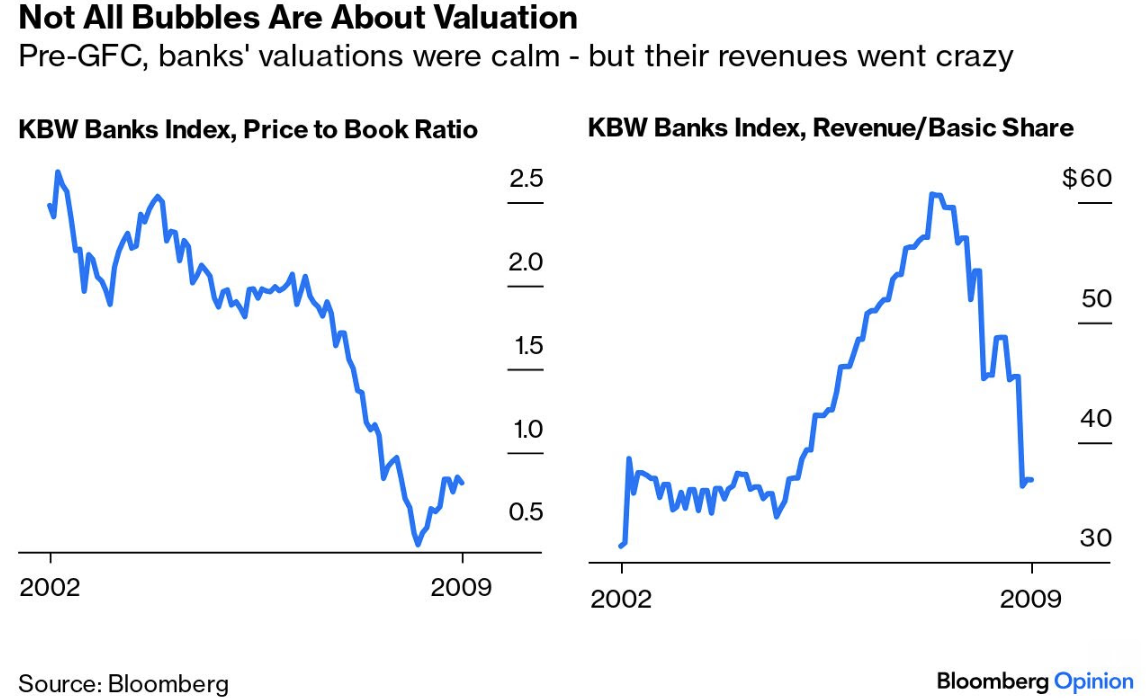
In this case, he begins with an illustration of the “revenue bubble” US banks enjoyed in the lead up to the 2008 financial crisis.
At the time, bank stock valuations were high (about 2.5x tangible book) but not considered extreme.
What’s more, the melt up in valuations for banks was orderly.
Now prior to the ’08 credit crisis – banks valuations were starting to cool – falling back to around 2.0x book (as the chart on the left shows below)
However, what’s worthwhile observing is the highly unusual revenues they were making (right hand side) up until the point of the crisis:
Banks doubled their revenues in three years – not something typical of a bank.
Banking is typically a slower (growth) business – where they are rewarded for not losing money.
Put another way – the quality of the loans matters (not simply making a poor loan to hit a pre-determined growth target)
In hindsight, it’s easy to see that this kind of loan growth was never sustainable (a point I will come back to in a moment).
It only took a couple of years for bank loan growth (and revenue) to revert to the mean – bringing valuations down with it (i.e., below 1.0x book value – which is a fair price to pay for a quality bank)
Authers compares the unusual surge in revenue enjoying by banks with the tech sector today – citing research from ProShares’ Simeon Hyman.
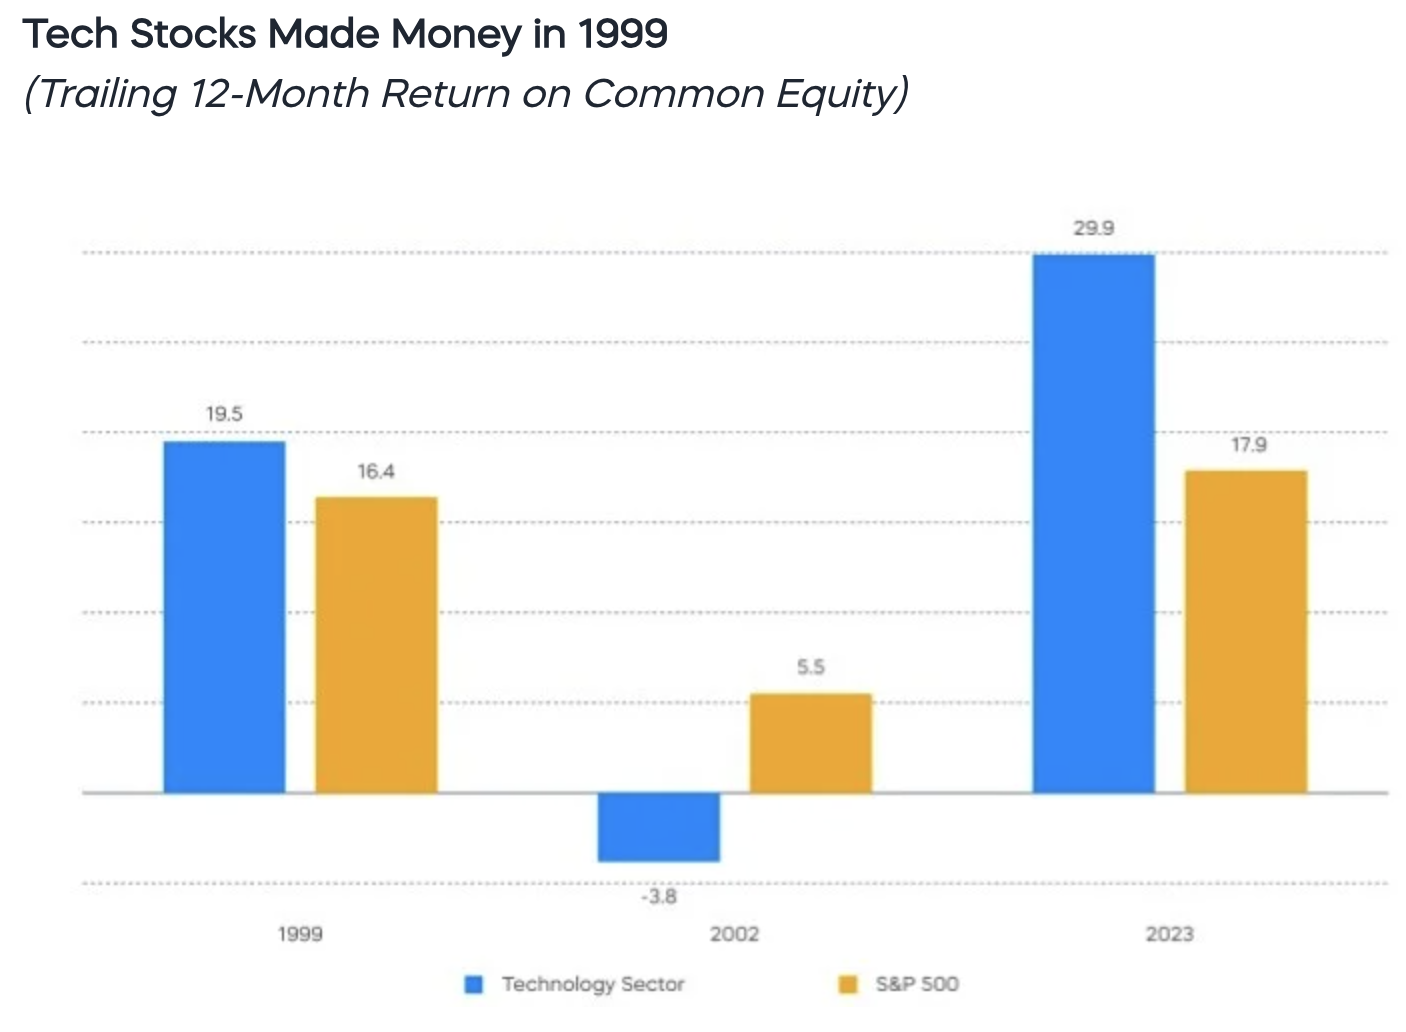
Hyman issued a post titled “Tech is Different This Time, Right?” – which looks at return on common equity, based on the return companies made in terms of their profits (vs just their share price gains)
There were plenty of tech stocks that were making money in 1999: Microsoft, Cisco, Intel, Nokia, Oracle, HP, Dell, etc. And collectively, they exhibited signs of quality.
The return on equity of the S&P 500 tech sector was generally higher than the broad S&P 500.
By 2002, however, that relationship had reversed, with the tech sector’s return on equity heading into negative territory.
The “bubble” in tech stocks turned out to be not just a stock price bubble, but also a “bubble” in fundamental performance.
Can it be different this time?
It can be, but nobody knows for certain. The current gap between S&P 500 technology sector’s return on equity and that of the S&P 500 is even wider than it was in 1999.
And perhaps the economy will avoid the recession that afflicted the United States in 2001.
Still, it doesn’t take a particularly ‘deep dive’ into the so-called “tech wreck” to see that complacency in the face of the tech sector’s profitability is not without risk.
Moreover, the identification of quality companies that are built to last may require looking beyond last quarter’s earnings.
Amen!
As Hyman says – this gap isn’t without risk. However, investors are complacent.
Today the equivalent of a “Cisco, Intel, Nokia, Oracle” etc from 1999/2000 are the likes of NVDA, AMD et al (and some large cap tech names).
This where Authers draws a compelling comparison (and not just on price action).
He references two valuations metrics for both NVDA and CSCO:
- Trailing PE Ratios; and the
- Price-to-Sales multiple
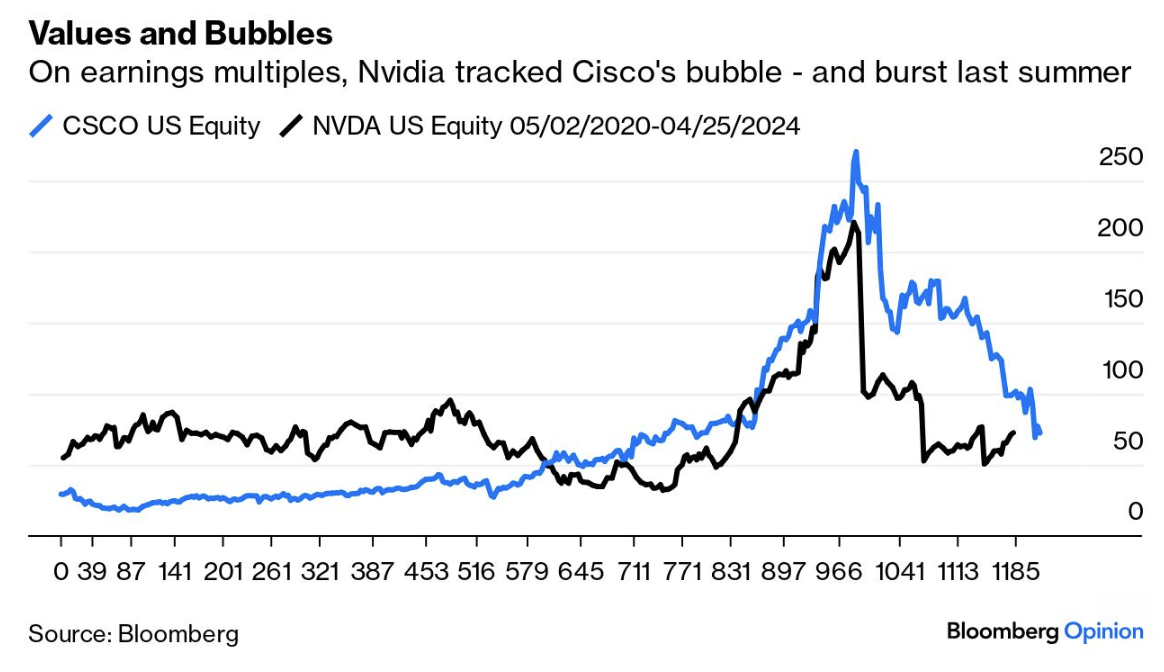
With respect to PE – NVDA’s multiple peaked mid-last year in much the same way that CSCO’s did.
Below we see how both CSCO and NVDA have largely tracked respective PE’s:
And on the basis that NVDA can sustain its earnings growth (which is likely in the near-term) – a forward PE of 35x is not excessive (vs almost 100x less than a year ago)
That part of the valuation equation is fine (as I said yesterday).
But things get more interesting when we look at the relative comparison with price-to-sales:
This is the chart which resonates most for me.
Up until recently – the price-to-sales multiple for CSCO and NVDA mirrored each other.
For example, both ripped to above 40x sales and then pulled back to ~20x. However, NVDA has reaccelerated (back up to 35x).
When we look at CSCO – the stock saw resistance around 25x sales – then worked its way back to 10x as margins (and sales) growth declined (with the stock losing around 89% of its value).
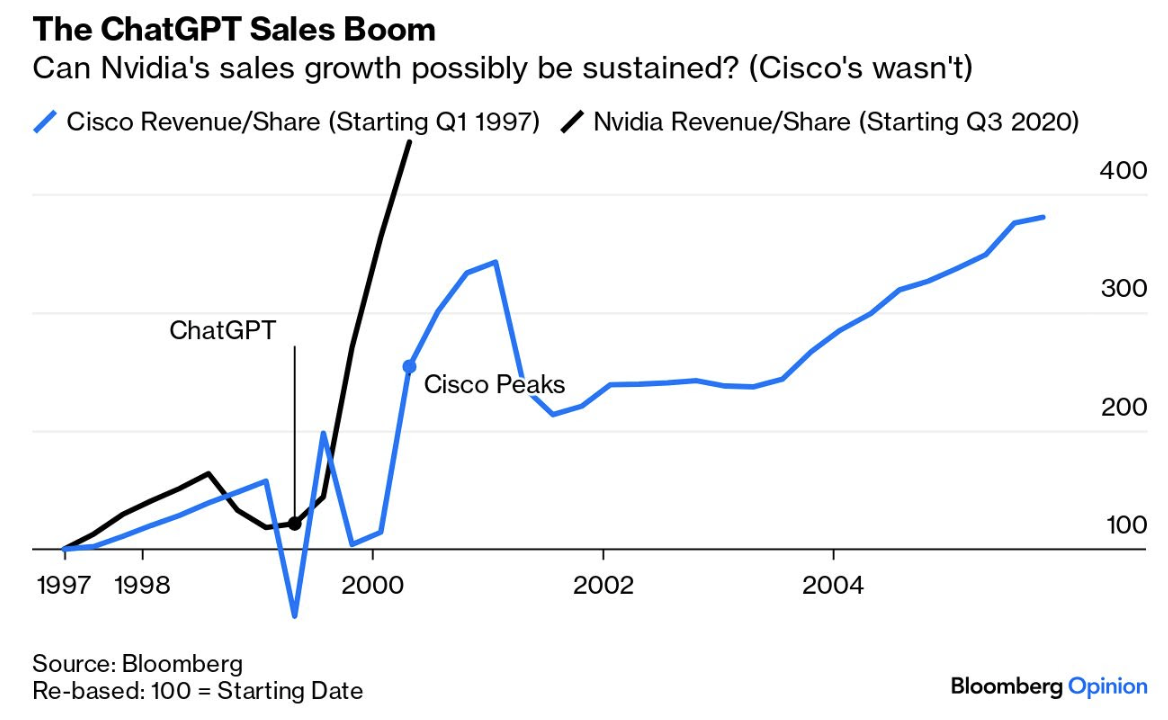
Authers also questions whether this kind of (stellar) revenue growth can be sustained. I quote:
What’s just happened to Nvidia’s sales is extraordinary, and yet shares are being priced on the assumption that they’re sustainable.
In the decade after 2000, as the internet took over all our lives, revenue growth for Cisco was unspectacular:
If NVDA’s largest customers are scaling investment into their own AI chips – what will that do to their demand in subsequent years? If nothing else, it makes me question whether you should pay 35x sales revenue.
In addition, it begs the question whether this is a longer-term cyclical or secular story?
From mine, it could end up being the former. And if that’s true, it means margins (and earnings) will come down. Then we need to question the “E” in PE and its assumed rate of growth.
But for now…. investors are pricing NVDA and AMD as a secular play. And that’s reasonable as AI chips are not (yet) commoditized (as chipmakers cannot keep up with demand)
However, will that be the case in say 2-3 years (or less)?
As I did, Authers stresses that companies (like NVDA) are doing something special and sell real products to real businesses who need them.
That’s not what we are debating.
From mine, this is the early innings of a major paradigm shift in computing (not unlike the advent of the Mainframe, PC, Internet and Smartphone).
We’re effectively rewiring technology – accelerating human ingenuity. However we are still yet to fully understand the new “superpowers” we will give users.
But it’s unlikely this kind of growth in (commodity) type chips will be sustained long-term (which is what investors today are paying for).
That’s the debatable point.
Again, quoting Authers: “... it’s impossible to see growth like this being sustained, and difficult to envisage sales even continuing at their current level”
Yep.
Putting it All Together
When I read Authers post – it brought a wry smile.
In this case, we’re viewing NVDA through the same lens. Whether that’s the right lens – I don’t know?
One last point on investor risk from Ian Harnett (cited in Authers’ article):
The risk is that the market is engaging in its own Generative-AI ‘hallucination’ about how long these AI-related supra-normal sales and earnings can persist.
US Tech earnings already account for 23% of US earnings. In the past 50 years, only Energy (1980), Healthcare (1992) and Consumer Discretionary stocks (1978 & 2017) briefly managed to sustain 20%+ shares of total US earnings.
Once a sector reaches this scale, the issue is ‘where/how can you generate incremental EPS growth?’
Again I agree.
Personally (and speaking as someone who has been working in the realm of AI for the past ~8 years) – the issue of sustained “20%+” type growth is going to pressure all large-cap tech over the next few years.
The challenge is always how we can generate this incremental EPS growth?
And whilst quality tech companies will continue to generate strong free cash flow and profits (and why you should maintain some exposure) – they’re not immune from being mis-priced.
Investors become complacent around the multiples they are paying and assumptions being made.
For example, when I see a stock (any stock) commanding a price-to-sales ratio of 35x – you need to challenge how sustainable that is.
For myself, my level of scrutiny is increased at anything above 10x sales (note: a useful benchmark if you’re ever considering private equity investment or participating in an IPO).
Again, this isn’t a debate about how a tool like Gen-AI will transform many of the things we do today (not unlike the way the PC, Internet and Smartphone did).
It will in ways we’re still yet to understand.
But what deserves debate is what investors are prepared to pay for (potential) long-term revenue (and earnings) growth?
Based on experience alone – paying 35x sales is typically very high risk. And if I were to bet – NVDA will likely face very strong competition for its AI chips in the coming years.
Not only will that come from other chip manufacturers (such as INTC, TMC, ASML, AMD and many more) – but it will also come from some of their largest customers.

