- S&P 500 finds expected resistance
- Why I’m not reading too much into MSFT’s profit warning
- Lock in the next two 50 bps hikes… but don’t lock in Sept yet
As each day passes – we hear another note of caution.
For example, first it was Snap’s CEO – Evan Spiegel – saying things have taken a turn lower – where the company expects significantly lower advertising revenue and earnings. The stock lost 50% – where I called it a broader “red-flag”.
Second, it was Jamie Dimon – JPMorgan’s CEO – telling folks to “brace for an economic hurricane” .
Third, we heard from Microsoft.
MSFT revised down both their Q2 revenue and earnings estimates. The enterprise cloud leader cited foreign exchange (i.e. stronger dollar) headwinds – which is to be expected. More on this in a moment when I look at what the stock is still a buy in any meaningful dip…
And last, it was Elon Musk’s turn…
The outspoken Tesla CEO not only sent this email to staff about a 10% headcount reduction; he also told executives that he has a “super bad feeling” about the economy (spoken like a true Silicon Valley CEO!)
Here’s the Washington Post’s take:
Tesla may have specific reasons for cutting jobs. For one thing, its workforce has more than doubled in the past three years to around 100,000. While revenue has risen 36% a year, compounded, in that time, the rate per employee is 7%.
Both of those numbers are respectable, but maybe not $800 billion worth of respect?
With respect to Jamie Dimon – take his ‘hurricane’ comment with a grain of salt.
For example, Dimon is a banker. He will say whatever is in the best interests of JPMorgan Chase.
To that end, you might even suggest the ‘hurricane’ remarks were carefully scripted… it would not surprise me.
And whilst I recognize there are meaningful headwinds (where economic growth is slowing) – he is also speaking indirectly to the Fed – warning against hiking too fast given what we see.
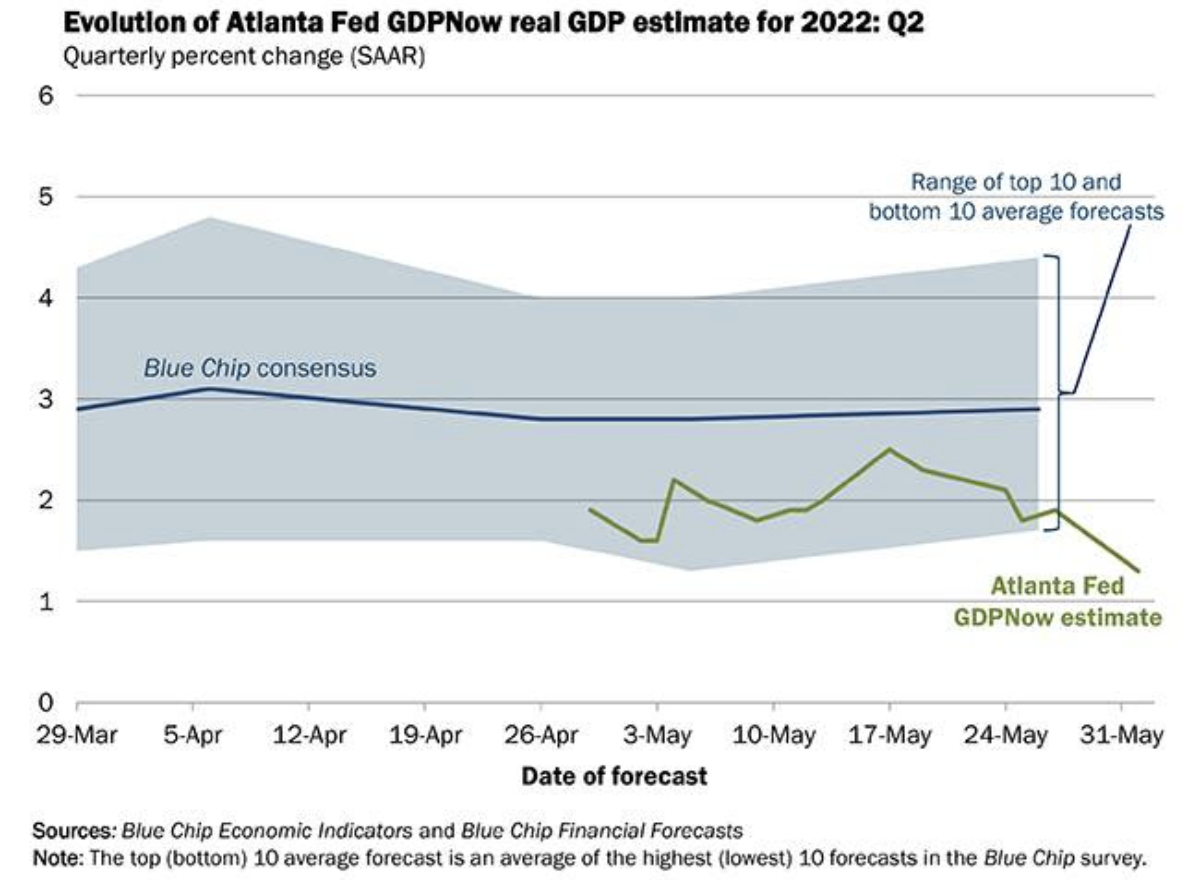
Consider the latest estimate from the Federal Reserve Board of Atlanta – which estimates Q2 2022 growth at just 1.3%.
Now recall that Q1 GDP contracted by 1.4%.
Therefore, if the latest Fed snapshot is accurate, that represents zero or slightly negative growth so far this year (n.b., despite how “well” Joe Biden says the economy is doing) — and that’s before normalizing rates combined with quantitative tightening (which could equal as much as a 75-100 basis point tightening)
Question is – just how much (and how fast) will the Fed weigh these warnings – and what are we likely to expect?
50, 50 and then (maybe) 50
There is divided opinion on both the pace and size of the coming Fed rate hikes.
From mine, these decisions will largely depend on what we see with overall economic growth, employment, Core PCE (which slowed last month) and CPI (where we get the next monthly print July 13th)
My best guess is the Fed will stay the course on consecutive 50 basis point increments until at least September.
But the third consecutive 50 bps hike is perhaps a 20-30% probability.
Again, pending what we see with both Core PCE and CPI, this could shift higher or lower (my guess is lower)
A couple of things:
We know that relative year-on-year inflation comps are going to get easier as time goes on. For example, it’s unlikely we will see most goods and services accelerating at the same “10-20%” pace year after year.
As each month passes – the yearly comparison gets easier.
What’s more (and further to this missive) – prices of more ‘flexible’ items (e.g., used cars, hotel room, airfares etc) are already showing signs of cooling.
But…
Pressure remains in more stickier areas (like rent and labor).
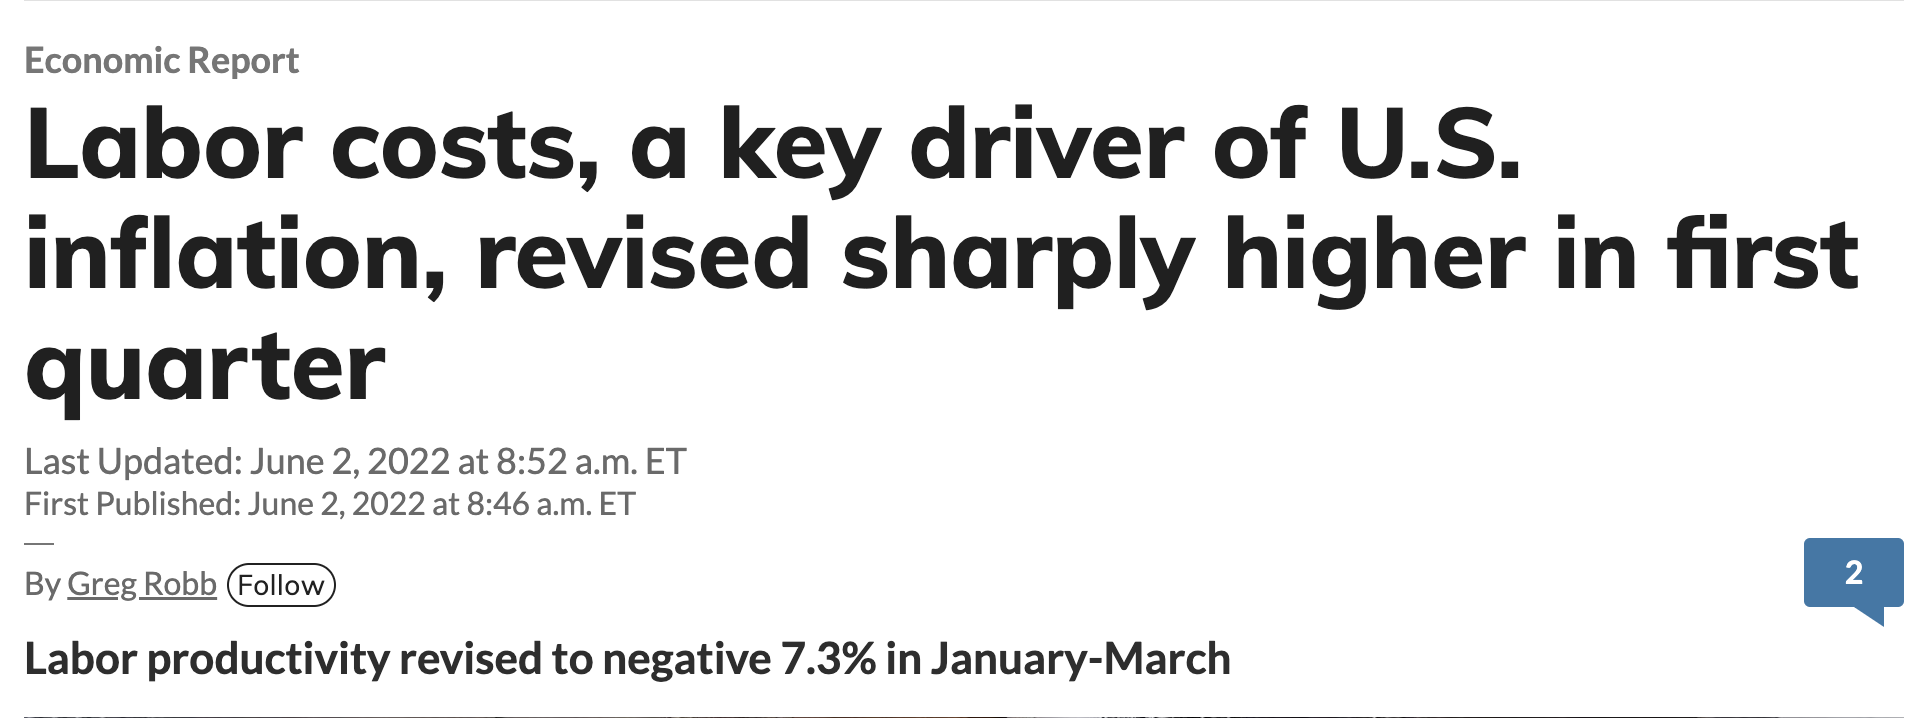
Unit-labor costs, a key measure of wage inflation, was revised up to a 12.6% gain in the first quarter from the initial estimate of an 11.6% gain.
And over the past year, labor costs are up 8.2%, the largest four-quarter gain since 1982.
That’s problematic.
However it potentially gets worse…
Whilst we are seeing 8.2% year on year wage growth – worker productivity is falling. For example, for Q1 it shrank 7.3% — the largest quarterly decline since the third quarter of 1947.
That’s a bad combination. Ideally, you get wage growth as a direct function of increased productivity. What you don’t want is wage growth exclusive of any productivity gain (e.g. simply raising a minimum wage as some politicians like to do)
In the absence of any increase in output – you will get inflation (where higher input costs are simply passed on).
But There’s Good News…
Now if we take a glass half-full lens – there are reasons to be more optimistic on growth.
For example, consumer demand is not falling off a cliff.
Take the ISM manufacturing numbers which handily beat expectations this week.
Here’s MarketWatch:
- ISM PMI, a closely followed index of U.S.-based manufacturing activity, rose to 56.1% in May from 55.4% in the prior month, the research group said Wednesday. Any number above 50% signifies growth.
- The index for new orders rose 1.6% to 55.1% in May. Employment slumped 1.3% to 49.6%. Prices fell 2.4% to 82.2%.
What’s more, Chicago PMI was also very good.
- Chicago PMI rose to 60.3 in May versus an expected drop to 55 from 56.4 in April.
- The latest numbers align with a gradually slowing, but still robust pace of growth in the US midway through the second quarter of 2022.
Put together – whilst things are slowing – consumer demand remains robust for now. As a result, I think any fears of a near-term (2022) ‘economic collapse’ are overblown.
However, there are some clouds brewing we need to be mindful of. Which brings us to the latest guides lower…
Microsoft Guides Lower
Microsoft (MSFT) is one of my core long-term holdings… a stock I’ve owned from 2013 (where I recommended it on the blog at ~$40 per share – citing its exceptional free cash flow yield).
And I continue to add to the name pending the opportunity / price.
This week MSFT guided lower citing US dollar headwinds. Here’s CNBC:
Microsoft lowered its fiscal fourth-quarter guidance, citing unfavorable foreign exchange rate movement.
It expects to report between $51.94 billion and $52.74 billion in revenue for the quarter. The company previously forecast fourth-quarter revenue in the range of $52.4 billion to $53.2 billion.
Microsoft also slightly cut its earnings forecast for the quarter, saying it now expects to report adjusted earnings per share in the range of $2.24 to $2.32. Previously, the company projected adjusted EPS between $2.28 and $2.35.
At the time of writing, MSFT trades ~28x forward earnings.
That’s not cheap.
However, the stock will always command a premium to any ‘average’ market multiple given:
- its strong (consistent) free cash flow (more on this below);
- balance sheet strength; and its
- leading (enterprise) cloud market position (i.e., its moat)
For example, MSFT trades with a free cash flow (FCF) yield of ~3.4%.
And whilst its lower than its all-time high of above ~5% – it’s strong vs the sector
As an aside, I consider FCF by far the most important financial health metric (even more so in today’s climate).
Now I say this because companies can easily pro-forma earnings (a method of calculating financial results using certain projections or presumptions).
But they cannot pro-forma cash.
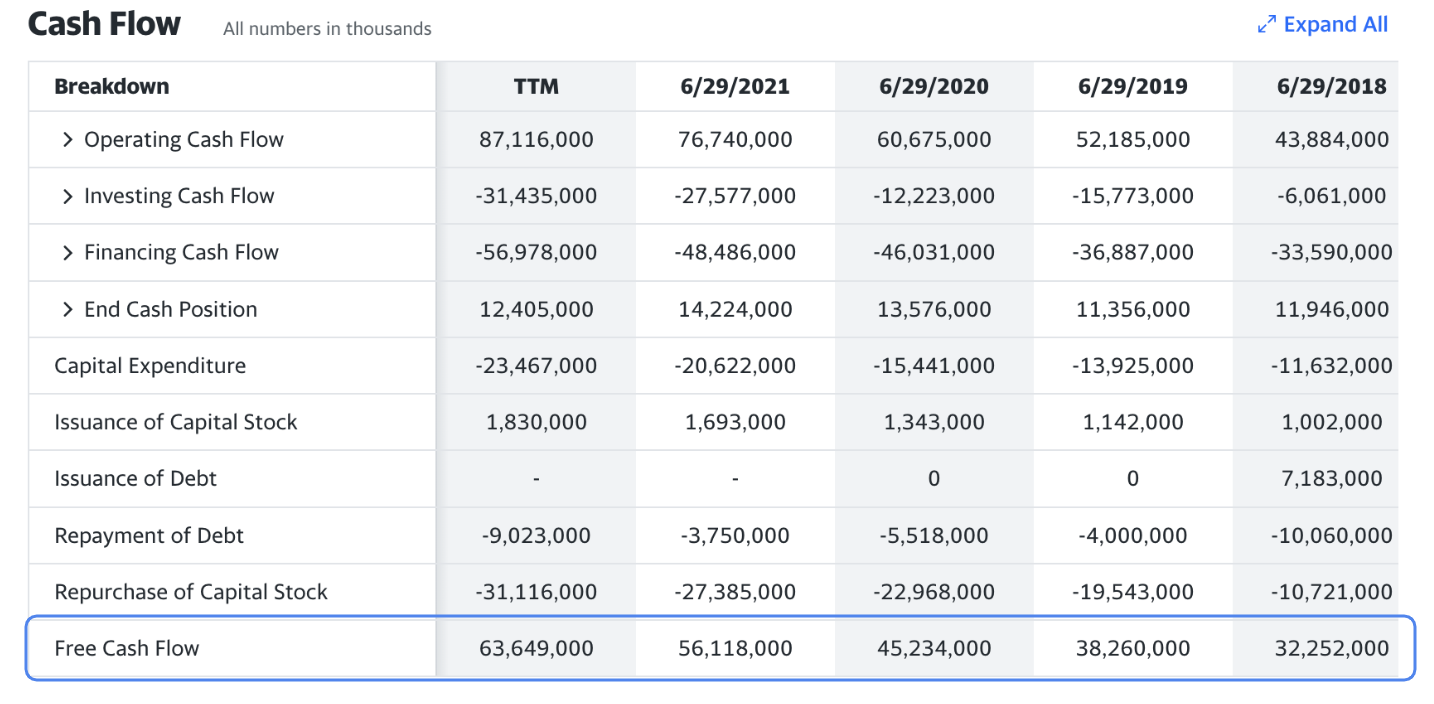
Put simply, FCF is the amount of cash flow from operations less all capital expenditure spending. You can obtain this easily from Yahoo!Finance under the tab ‘financials’ for any stock (MSFT below)
MSFT’s annualized FCF for 2022 is $63.65 Billion (last row).
Now if we consider their total revenue of $192.6B – that’s a whopping 33%.
And if we measure FCF as a function of their current $1.89 Trillion market cap – that represents 3.4%
When I read through their “guide lower” – I didn’t read too much into it.
Put another way, it did nothing to change my view on their cash flow generation; sales; or market position.
For example, MSFT are not saying ‘cloud growth is materially slowing from last quarter’s 46%’ or ‘we are losing market share’; or ‘enterprise cloud spend is falling’.
No.
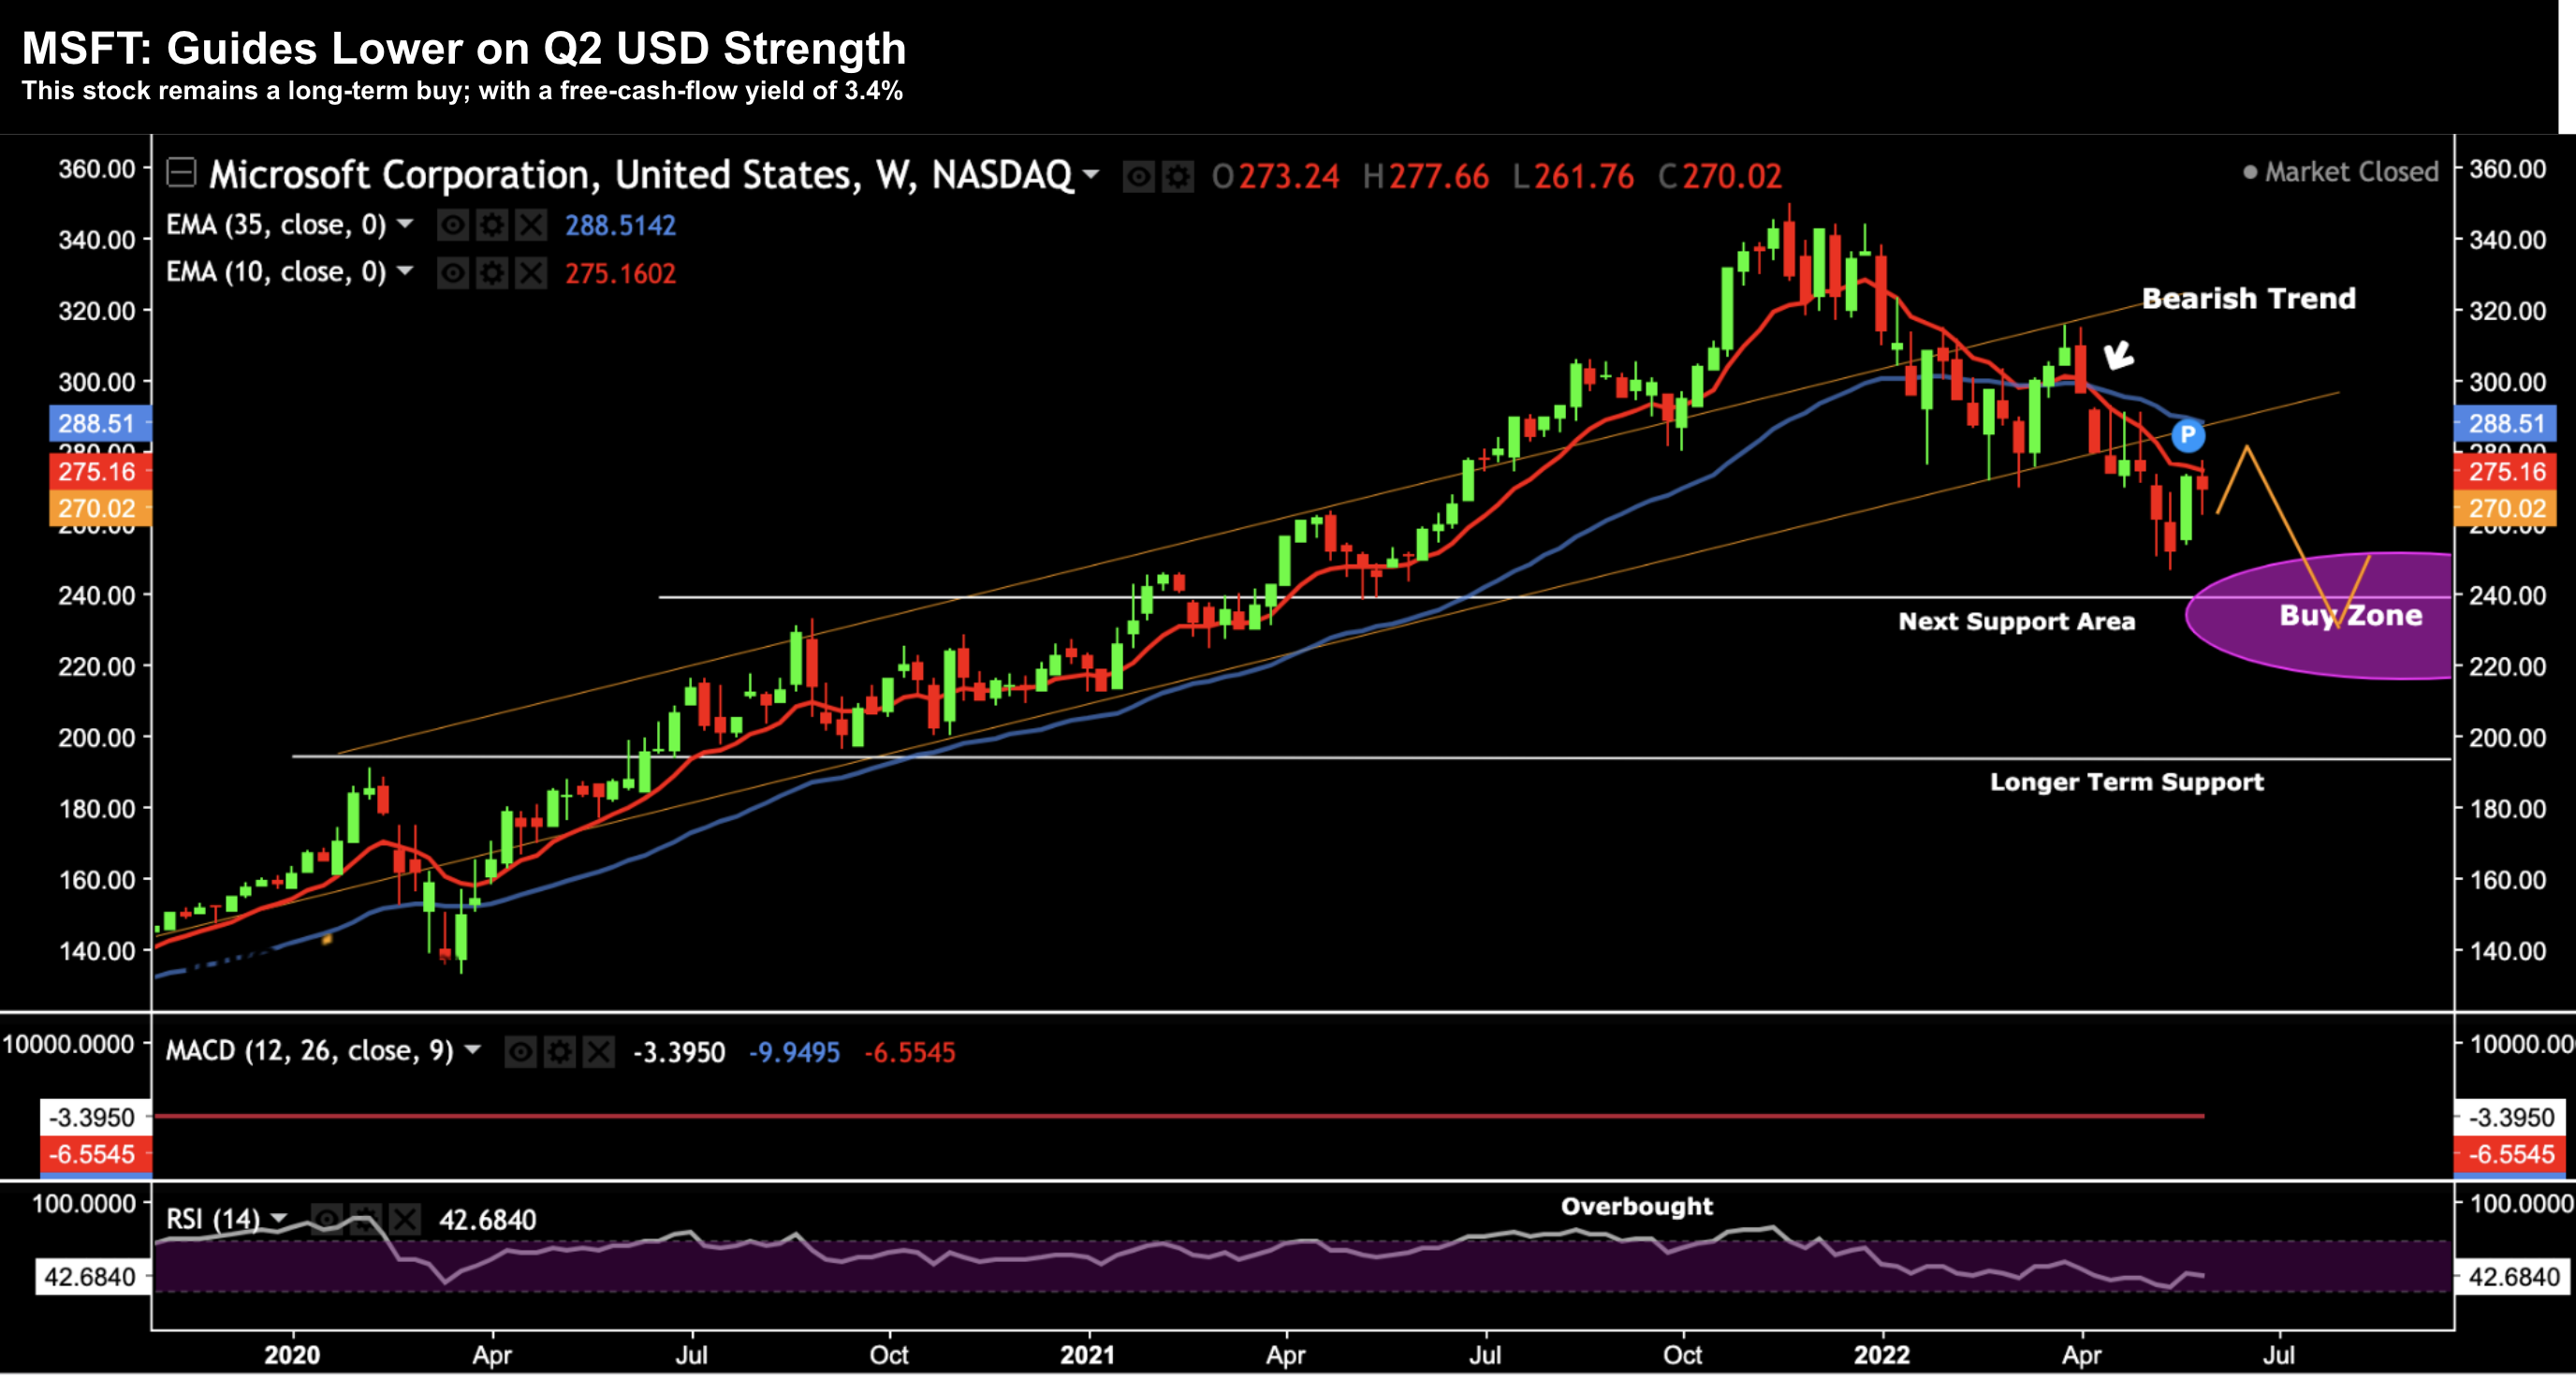
All they said is they expect a currency headwind opposite international revenue streams (which is to be expected). That said, the stock isn’t cheap and is likely to trade lower given its (weekly) bearish trend:
MSFT – June 4 2022
From mine, I think we see the stock test the next support zone of around $240 (~11% lower).
From an FCF yield perspective – that would see it closer to 3.9% (i.e., where its market cap would be around $1.68T).
And if you don’t own MSFT today – buying the stock at $240 is an excellent level to start adding to your exposure.
One final note:
At $240 for MSFT – you are gaining a solid risk/reward entry into the growth of cloud computing – set to deliver outstanding returns over the next few decades. Again, last quarter MSFT reported growth of 46% YoY for their platform Azure.
Note – only ~10% of all IT spending today is cloud-based. This market has a lot of headroom to grow – at incredible margins – where MSFT is positioned as well as any.
S&P 500 – Pauses at 10-Wk EMA
Last week the market staged an impressive relief rally.
I asked the question:
“Is this a technical relief rally; or have we put in a longer-term market bottom?”
My answer was the former unless proven otherwise.
And whilst we may have made “a” bottom; I felt it was unlikely “the” bottom.
This week added some weight to that conclusion.
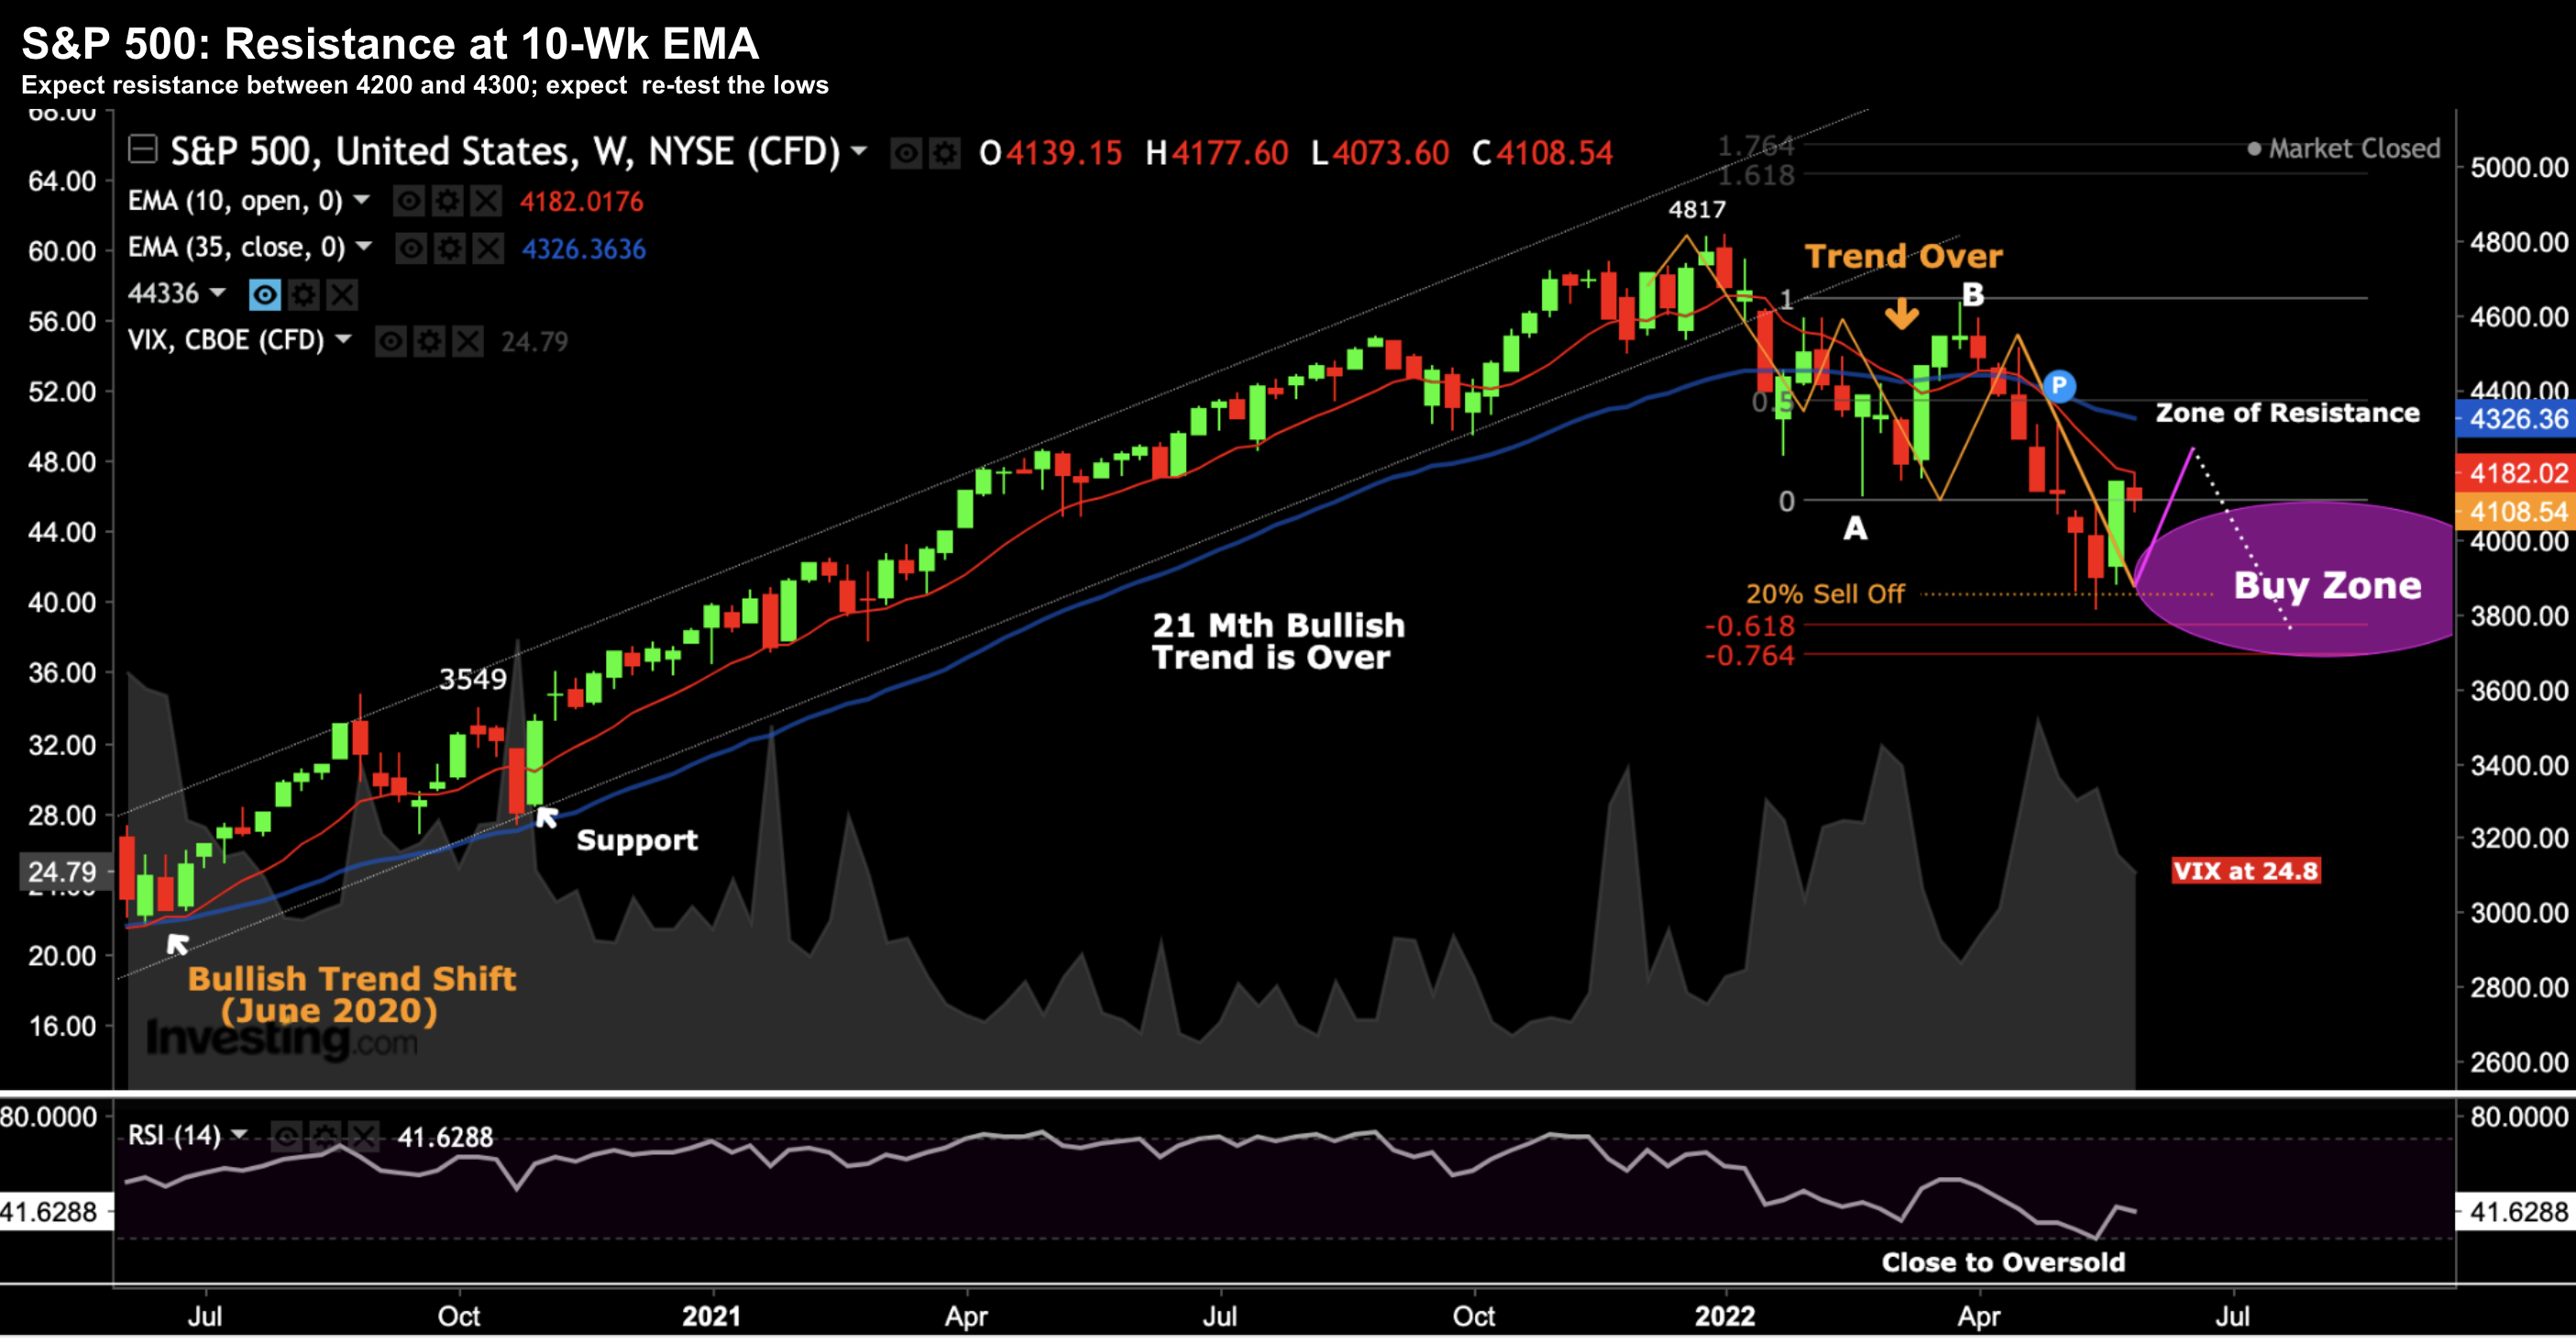
Let’s update the weekly chart for the S&P 500:
June 4 2022
For the most part, things continue to trade per the script.
We found support in the 61.8% zone (i.e. around 3800) and then rallied to the 10-week EMA.
This is the zone (i.e. between the 10-35 Week EMAs) where I felt we could see selling pressure.
That’s not to say the market cannot continue to rally from here – it can.
However, I see strength being sold.
What’s more, when companies like Tesla, Microsoft, Snap, Restoration Hardware and JPMorgan are all singing from the “glass half empty” hymn sheet – it weighs on market sentiment.
Look for more guides lower over the coming weeks. For example, I think by the end of June we will see more “8-Ks” from companies – where the guide is lower – not higher.
Putting it All Together
The narrative for the market has changed materially the past four weeks.
There is a clear shift in sentiment – supported by the tape.
For example, even if I were to ignore fundamentals (e.g., free cash flow, forward earnings, price-to-growth ratios etc) – we see the bearish sentiment based on price action.
And it’s been that way since early March… and arguably sooner (e.g., if you look at things like negative convergence with the MACD – as I cited in Q4 2021)
Now one reader reached out this week asking what my exposure was to the market given I lean bearish.
Today I’m 65% long / 35% cash.
As I shared in this post – my year-to-date performance is down around 5.7% – which is about 9% better than the S&P 500.
My Top 4 holdings in Google, Apple, Microsoft and Amazon have dragged it lower (note: I added to both Amazon (at $2,100) and Apple (at $141) recently
That said, I improved my returns by selling covered calls against these positions. For example, I sold 60-day $190 strike calls on Apple for a yield of ~4% on the basis I expected the stock to remain under pressure.
Now if we see the S&P 500 trade down to levels of around 3500 (which implies a forward multiple around 15x) – I will be a buyer with “both hands” for the long-term.
In other words, I will be closer to 90% long (not 65%). From mine, that represents an excellent long-term risk/reward entry point.

