Words: 1,655 Time: 7 Minutes
- How about no rate cuts for 2025?
- 256,000 jobs added is misleading
- S&P 500 has lost all momentum…
A few months ago Jay Powell claimed victory.
Last September he said words to the effect of “the time has come to start easing rates”
He initially cut rates by 50 points — followed by two more cuts of 25 basis points.
Markets were thrilled – more cheap money was on the way – pricing in as many as 6 or 7 rate cuts over the next 12 months – with the market ripping to 6,100 early December.
At the time I asked why the need to cut?
The data simply didn’t support it. For example. employment was full. GDP was expanding at a reasonable clip (almost 3.0%). Consumers were spending. Corporate earnings were strong – with net profits around 12% (a record high)
Whilst the Fed was busy high fiving each other – the bond market was less convinced.
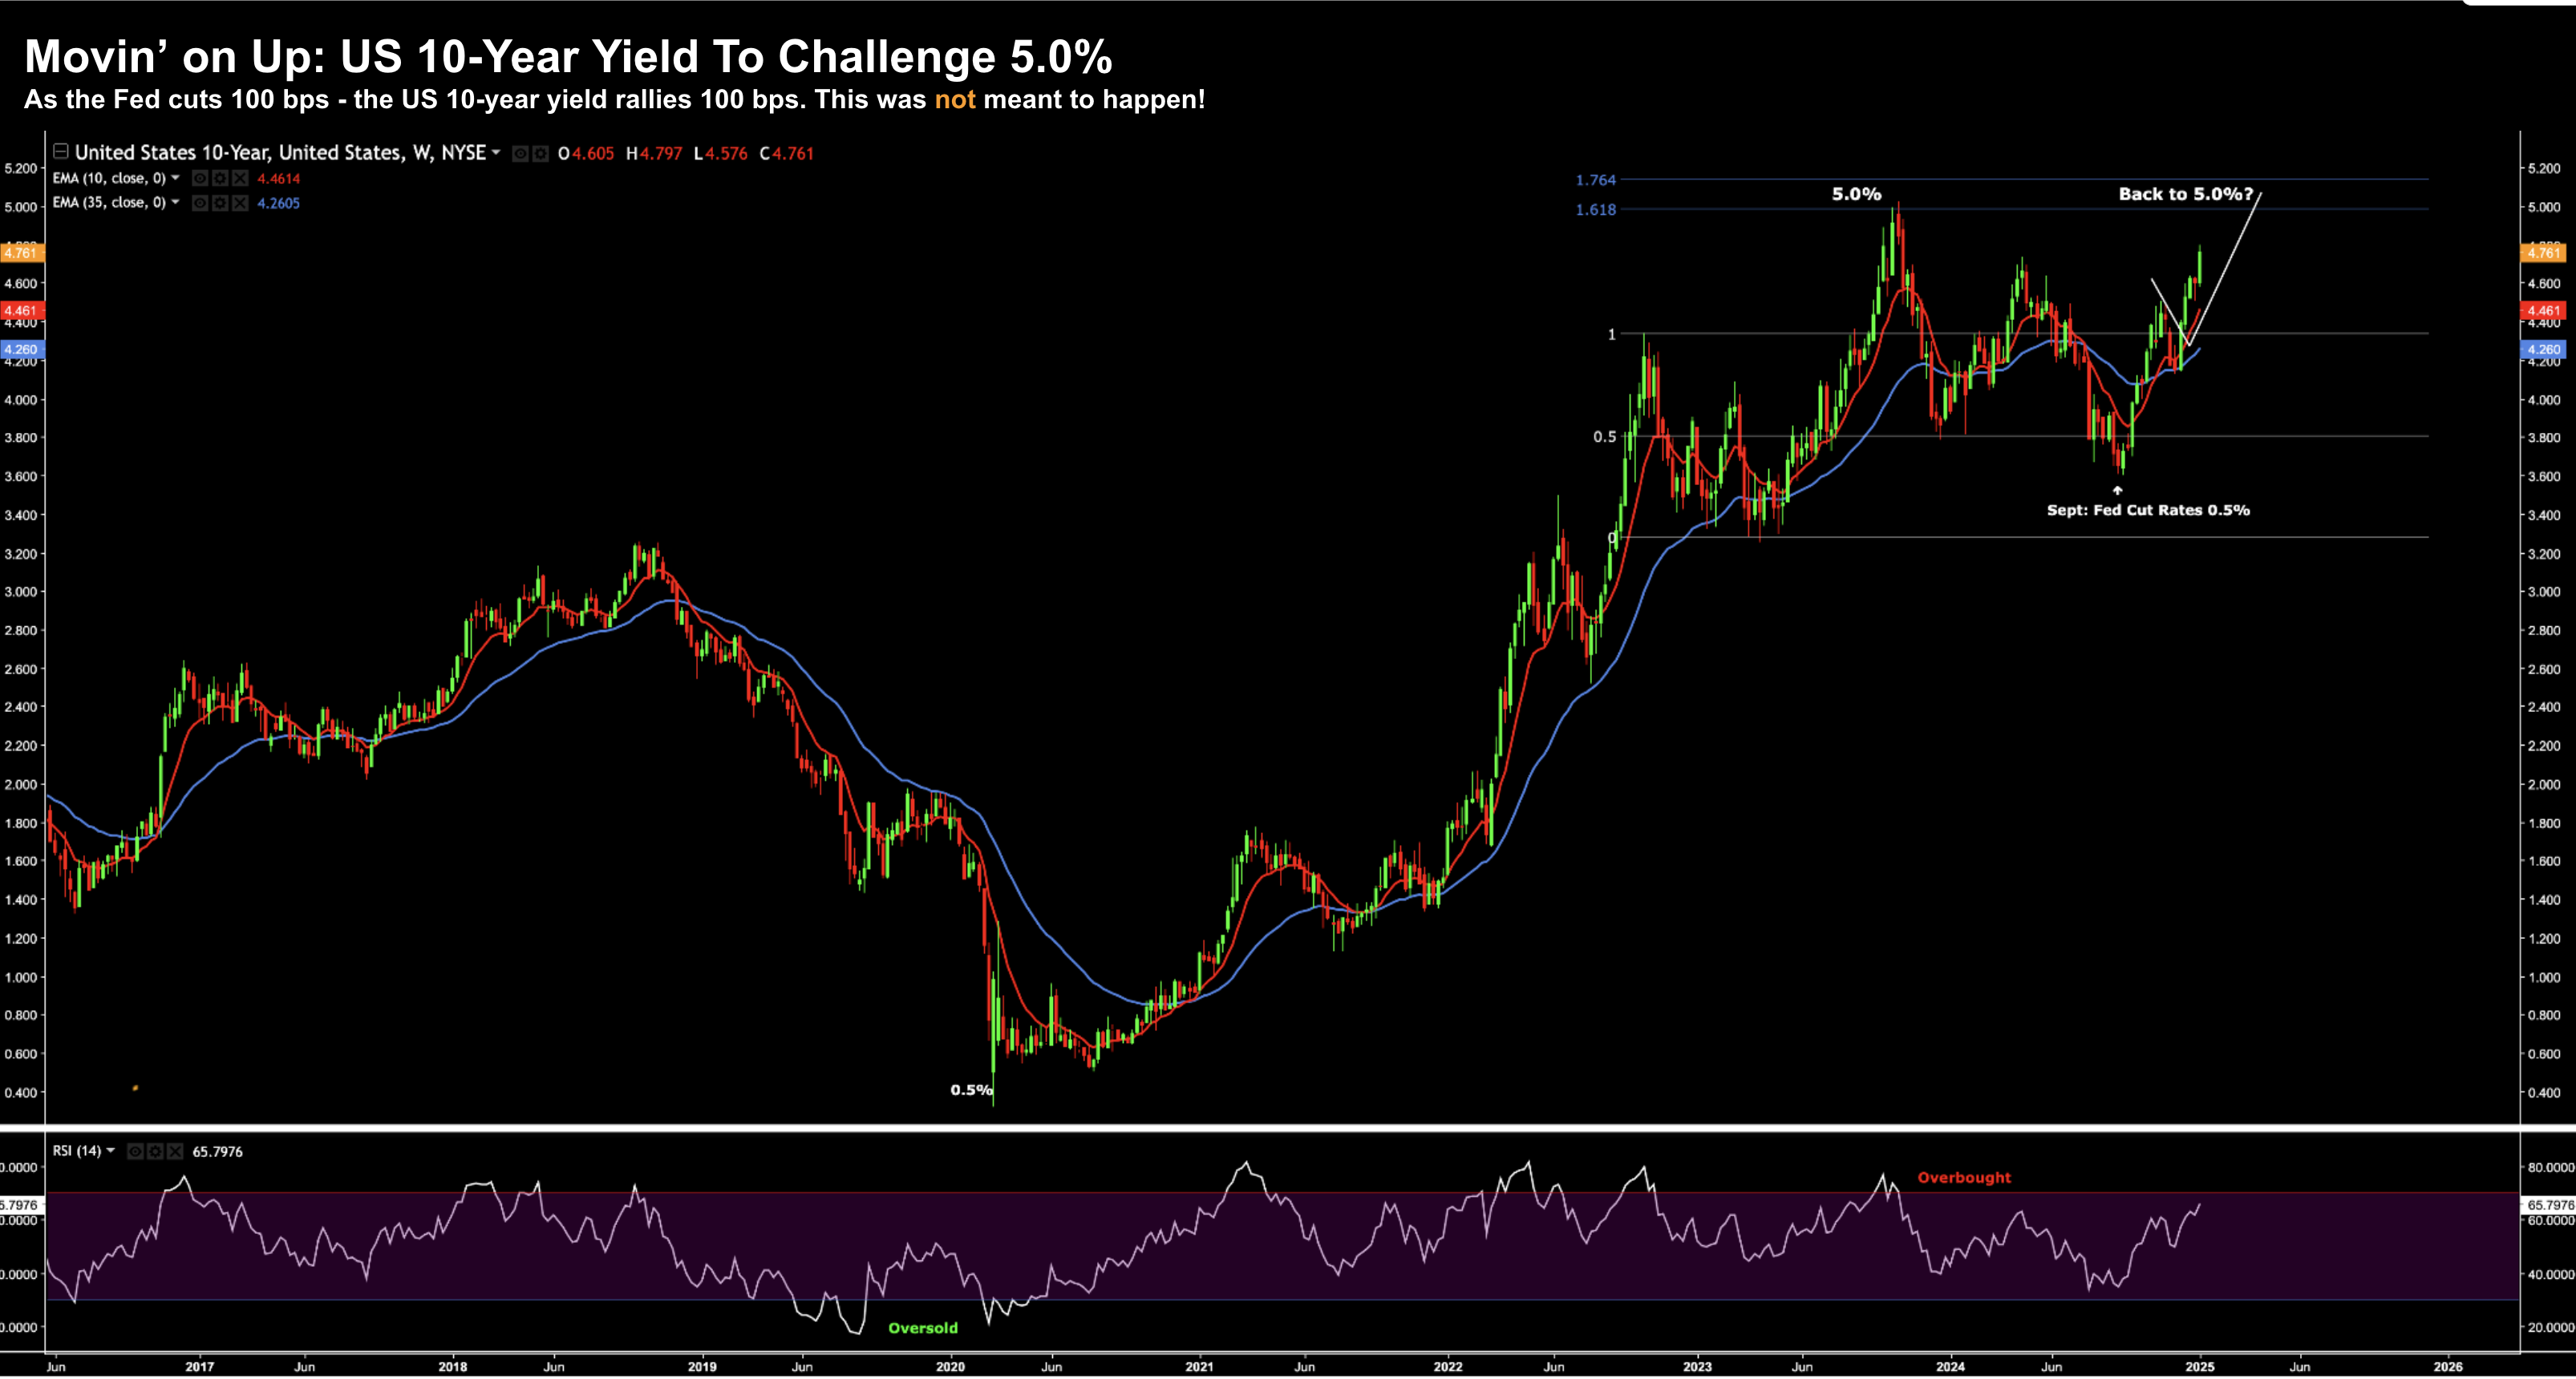
The US 10-year yield went the other direction — and appears likely to retest 5.0% in the next few months (more on this in a moment)
Now my last point was titled “What Could Possibly Go Wrong?”
I cited the US 10-year yields as just one of the major risks – which also included a stronger US dollar.
Equities however didn’t notice.
What risks? Where? 10-year yield at 5.0% – who cares?
The “experts” expect the S&P 500 to trade at a forward multiple of 25x by the end of next year.
This average 2025 S&P 500 target from the street is 6,600 – with earnings expected to grow to ~$268 per share.
| Institution | 2025 | EPS | Fwd P/E |
|---|---|---|---|
| Oppenheimer | 7100 | 275 | 25.8 |
| Wells Fargo | 7007 | 274 | 25.6 |
| Deutsche Bank | 7000 | 282 | 24.8 |
| Soc. Gen | 6750 | 272 | 24.8 |
| BMO | 6700 | 275 | 24.4 |
| HSBC | 6700 | 268 | 25.0 |
| Bank of America | 6666 | 275 | 24.2 |
| ScotiaBank | 6650 | 255 | 26.1 |
| Barclays | 6600 | 271 | 24.4 |
| Evercore ISI | 6600 | 257 | 25.7 |
| Fundstrat | 6600 | 275 | 24.0 |
| Ned Davis Research | 6600 | 254 | 25.9 |
| RBC Capital Markets | 6600 | 271 | 24.3 |
| Citigroup | 6500 | 270 | 24.1 |
| Goldman Sachs | 6500 | 268 | 24.3 |
| JP Morgan | 6500 | 270 | 24.1 |
| Morgan Stanley | 6500 | 271 | 23.9 |
| UBS | 6400 | 257 | 24.9 |
| BNP Paribas | 6300 | 270 | 23.3 |
| Cantor Fitzgerald | 6000 | 267 | 22.5 |
| AVERAGE | 6617 | 268.0 | 24.6 |
Notice how everyone leans to the same side of the boat.
There’s not a single bear in the house.
Groupthink?
You bet! It’s how Wall Street functions. Lemmings.
But today a potential spanner was thrown in the works…
Jobs came in warmer than expected (headline at least); and inflation expectations have risen from 3.0% to 3.3%
Given this, what do the Lemmings see for:
(a) rate cuts over the next 12 months; and
(b) where do they see the US 10-year yield at the end of the year?
For example, what if the Fed did not implement a single cut in 2025?
Would that change the uber bullish targets?
And what if the US 10-year yield traded at 5.50% (which is not unrealistic) … what would that do the 25x multiple?
Remember:
It’s normal for the 10-year to trade ~1.25% higher than the Fed funds rate.
Now of the Fed cuts their rate to 4.0%… we could easily see the 10-year settle in above 5.0%.
Things which make you go hmmm….
Let’s start with a quick look at the jobs data… the market did not like it.
Jobs “Stronger” than Expected
Before I talk to the jobs report – I encourage you to read Mish’s blog for a full summary.
In short, Mish says whilst the headline was strong, there’s weakness below the surface.
Like everything – it’s all in the way it’s measured.
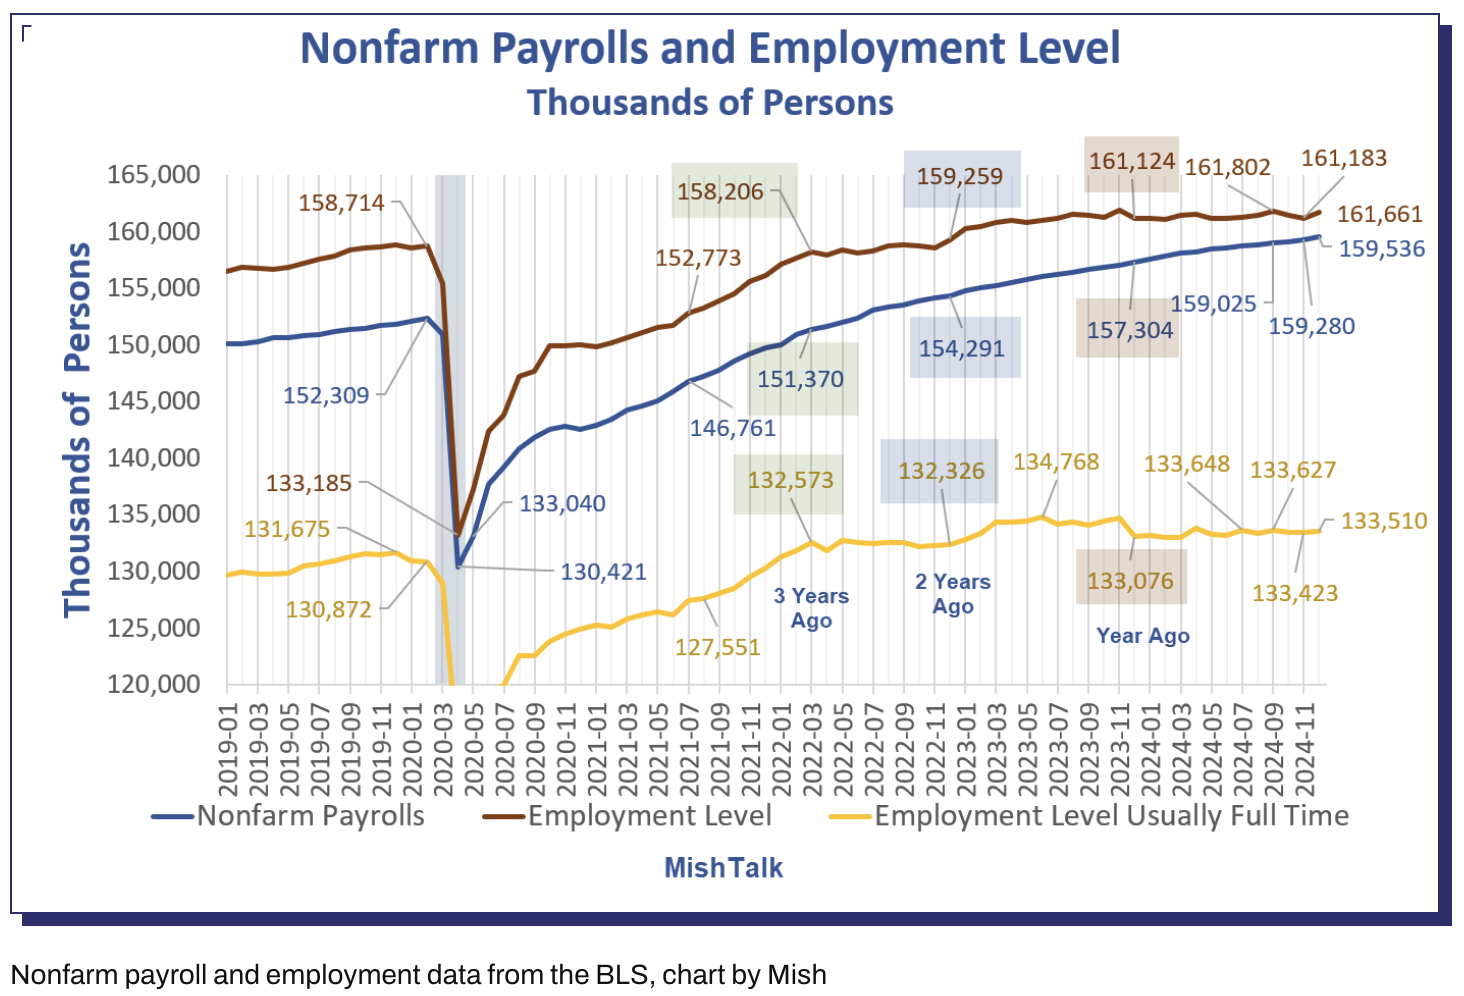
Mish first points out half of the jobs added came from education, health services, and government — adding 113,000 jobs in December.
I wonder if government job additions will be as strong under Trump?
We will see…
Retail was notably higher – but that’s the case every December – it’s highly seasonal. Expect retail jobs to fall over January.
Mish reminds us that full-time employment has been weak for three consecutive years.
For example, if you work one hour per week, you are employed.
Just one hour…
What’s more, if you don’t have a job and fail to look for one, you are not considered unemployed, rather, you drop out of the labor force.
And looking for job openings on Jooble or Monster or in the want ads does not count as “looking for a job”.
You need an actual interview or send out a resume.
So if you fail to do those things – then you are not considered unemployed.
These distortions artificially lower the unemployment rate, artificially boost full-time employment, and artificially increase the payroll jobs report every month.
But you won’t read that in the mainstream jobs report.
Work one hour per week – you are employed. Don’t look for work – you are also employed.
Consider this:
- Nonfarm Payrolls are up +8,166,000 from three years ago
- But employment is only up +2,232,000; and
- Full-time employment is only up 937,000.
That is a massive distortion between full time work and non-farm payrolls.
Since the peak in June of 2023, full-time employment is down by 258,000.
A Fed on Pause
Whatever the case, the market saw the headline jobs number of 256,000 jobs added as “strong”.
In combination with inflation expectations rising – the market is quickly dialing back its expectation for more cheap money.
Here’s Reuters on inflation:
U.S. consumers expect inflation to increase over the next 12 months and beyond, likely reflecting concerns that broad tariffs on imports pledged by President-elect Donald Trump’s incoming administration could raise prices for households.
The University of Michigan’s survey showed consumers’ one-year inflation expectations jumped to 3.3% in January, the highest level since May, from 2.8% in December. That raised the 12-month inflation expectations above the 2.3%-3.0% range seen in the two years prior to the COVID-19 pandemic.
Here’s a question:
Where are rate increases on investor’s radar?
They aren’t.
However, if these trends continue over the coming months, what position will that put the Fed in?
Now hindsight is a wonderful thing.
I can’t help but wonder with the benefit of hindsight – would Powell take back his decision to lower rates by 100 bps the past few months?
My guess is yes.
And that’s what the bond market has been telling him from the outset. Rates need to be higher.
Look at the US 10-year yield after the Fed first rate cuts…
January 10 2025
Bonds are playing chess… the Fed are playing checkers.
I have no clue what game equities are playing? Naughts and crosses?
As an aside, I penciled in this move higher in long-term rates here (December 13)
But higher 10-year yields were not meant to happen…
In fact, it’s highly unusual that when the Fed is slashing rates – the long end of the curve rallies.
This is called a “bear market steepening”… which typically does not bode well for markets.
Why?
- As long-term yields rise, borrowing costs increase for businesses and consumers. This can dampen economic activity by discouraging investment and spending
- Lower quality companies with high levels of debt face higher interest expenses, which reduces profitability (i.e. why we see small caps getting crushed).
- A higher longer-term rates will generally see valuations to drop for equities, especially growth stocks, as higher discount rates are applied to future cash flows
With respect to the last point – take a look at what we’ve seen with tech stocks.
Their future cash flows are being discounted.
From here, all eyes will turn to the CPI print next week.
What was previously expected to be a non-event – this could now be very important.
My expectations are that CPI will remain sticky…
And if that proves to be the case – the market will start pricing in the possibility of less than 1 rate cut in 2025.
But let’s not forget…
We have to model any potential inflationary risks opposite tariffs, restrictions on immigration with labor, and lowering corporate taxes to 15%.
All of these policies are inflationary.
As I said last week… “what could possibly go wrong?”
S&P 500 Loses All Momentum
Let’s close with quick look at the weekly chart for the S&P 500
January 10 2025
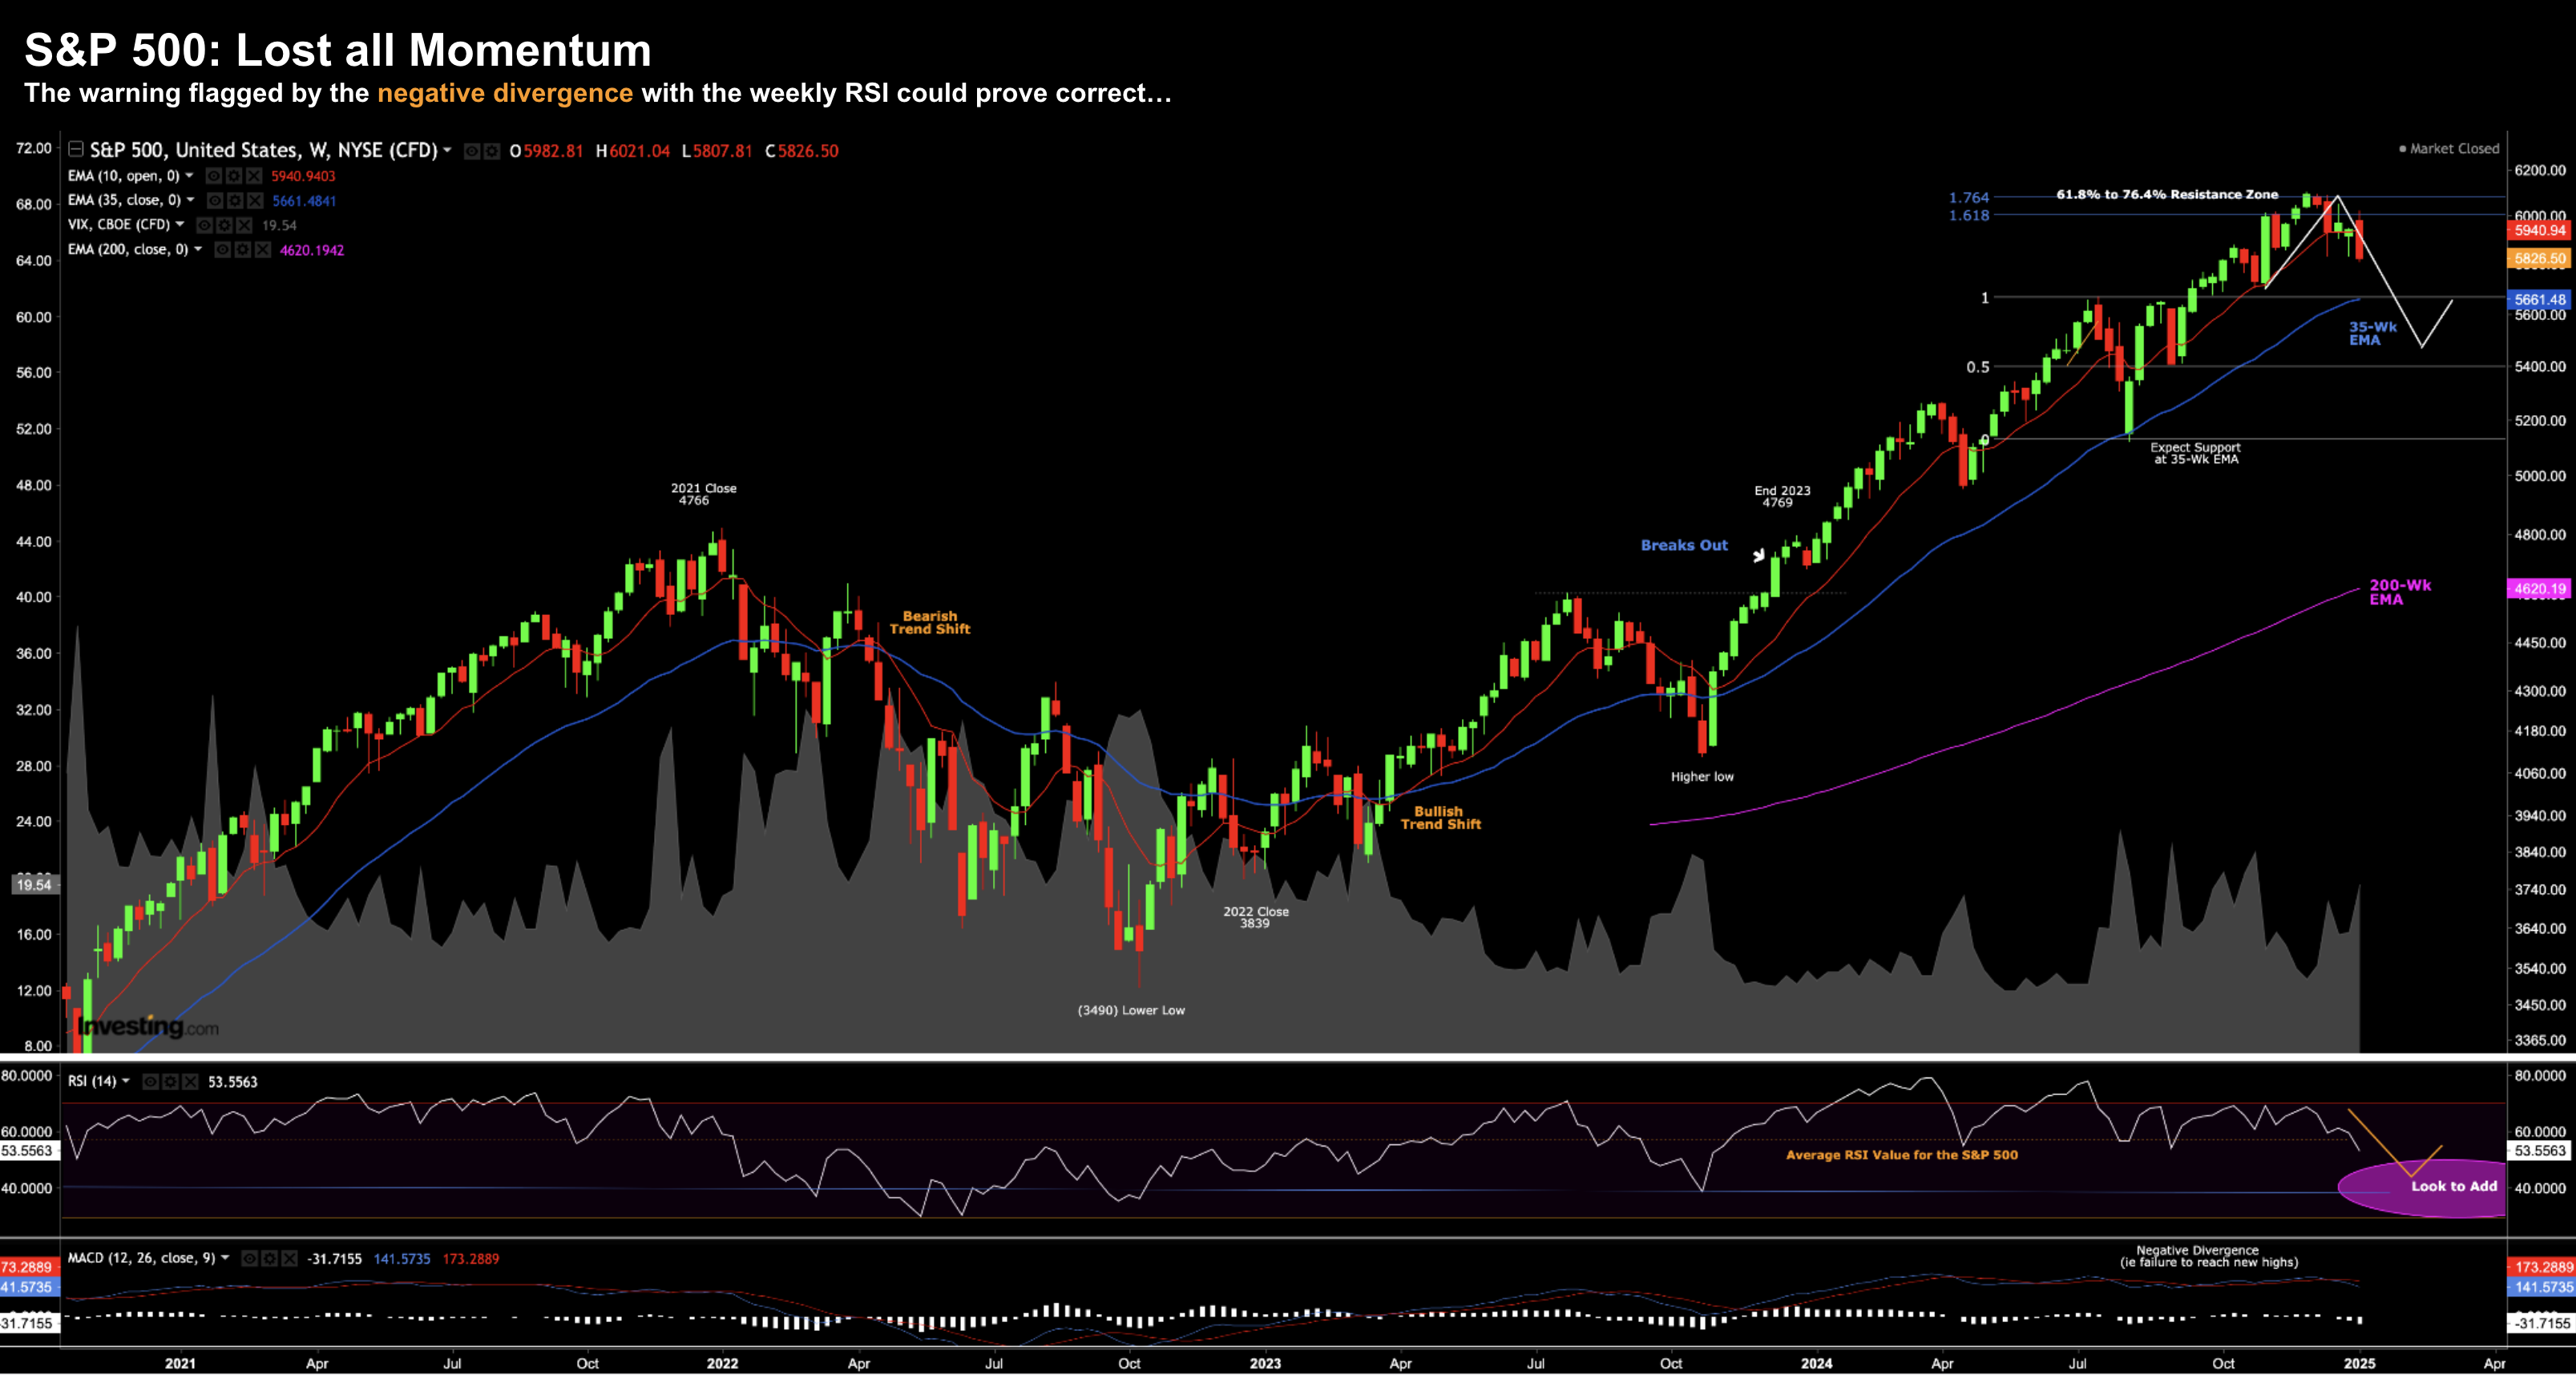
Not much to add from last week (or the previous 8 weeks!)
As an aside, if you read this post from Dec 7th – you can see where I said to expect resistance in this (6100) zone.
Therefore, you can say things continue to trade per the script:
- The Index rallied to the 6100 zone and was met with resistance
- The weekly MACD and RSI show strong negative divergence (i.e., not confirming the market highs)
- We are still extended from both the 35-week EMA (and 200-week)
- Risks remain to the downside
Perhaps the only change is the increase in the VIX.
It’s waking up (finally) and ticked up to 19.5… which tells me traders are a little more cautious.
My technical read is there is room for stocks to trade lower…
I think the first level of potential support will be around 5600 (i.e., the 35-week EMA)
Stocks may catch a technical bid here… however I will be looking for something closer to ~5400 before I start to sharpen my pencil.
Putting it All Together…
However, not just quality in popular areas.
For example, most people will be jumping into hyped-up names in areas such as AI, crypto, cyber security and quantum computing.
But I would tread carefully…
With the 10-year yield likely to trade above 5.0% – future cash flows from tech stocks (and expected growth rates) are going to be heavily discounted.
Therefore, I would look elsewhere.
For example, names with far lower multiples however also exhibit the qualities we look for.
Remember:
The risk is always what you pay. But knowing where to look will be key…
I’m often asked how I do this… and I plan to share more thoughts on that over the weekend.


