- CPI hits 41-Year High of 8.6% YoY for May
- Why the Fed Should Announce 75 bps next meeting; and
- Expect 3800 to break as support for the S&P 500
Unfortunately it was the opposite.
CPI hit a new 41-year record 8.6% YoY. From Yahoo!Finance:
The biggest contributors to the latest jump in inflation were shelter, gasoline, and food, according to the BLS.
The energy index rose 3.9% month-on-month in May, with the gasoline index rising 4.1%. Compared to the prior year, energy prices in May were up 34.6%, the most since September 2005.
Meanwhile, the food index rose 1.2% from April to May and 10.1% over the prior year, the largest jump since March 1981.
Shelter costs rose 5.5% over the prior year; or 0.6% month-on-month – the largest jump since March 2004.
Owners’ equivalent rent, a component of the shelter index, rose 0.6% in May, the most since August 1990
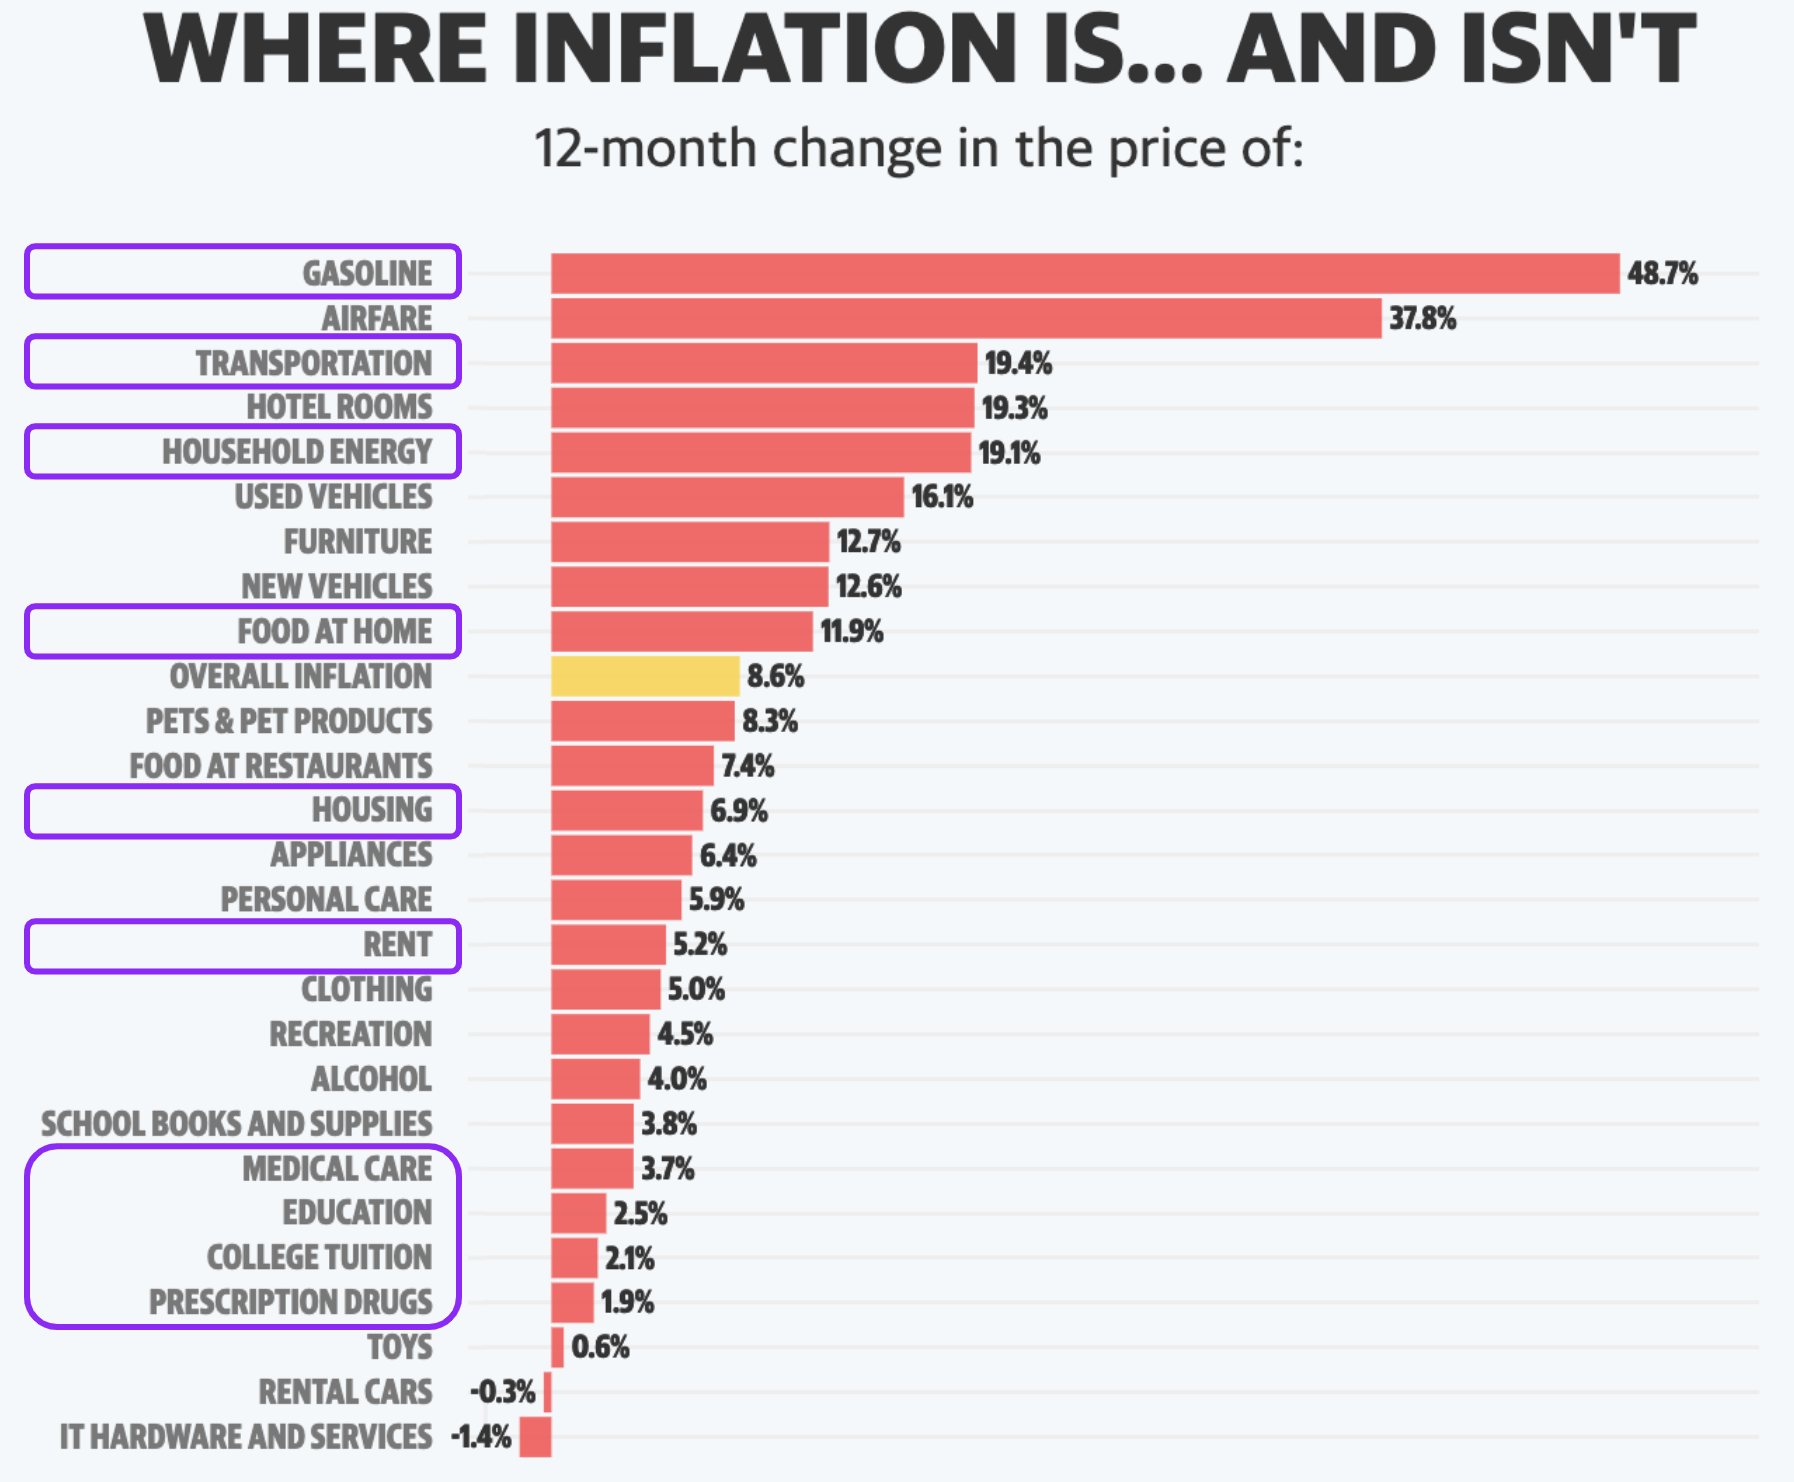
And that’s what counts (less so “rental cars”, “hotel rooms” and “used cars”)
Highlighted are items hitting household’s the hardest:
From mine, you don’t need a monthly government report to tell you prices were up “8.6%”…. you just need to fill up your car or buy a loaf of bread.
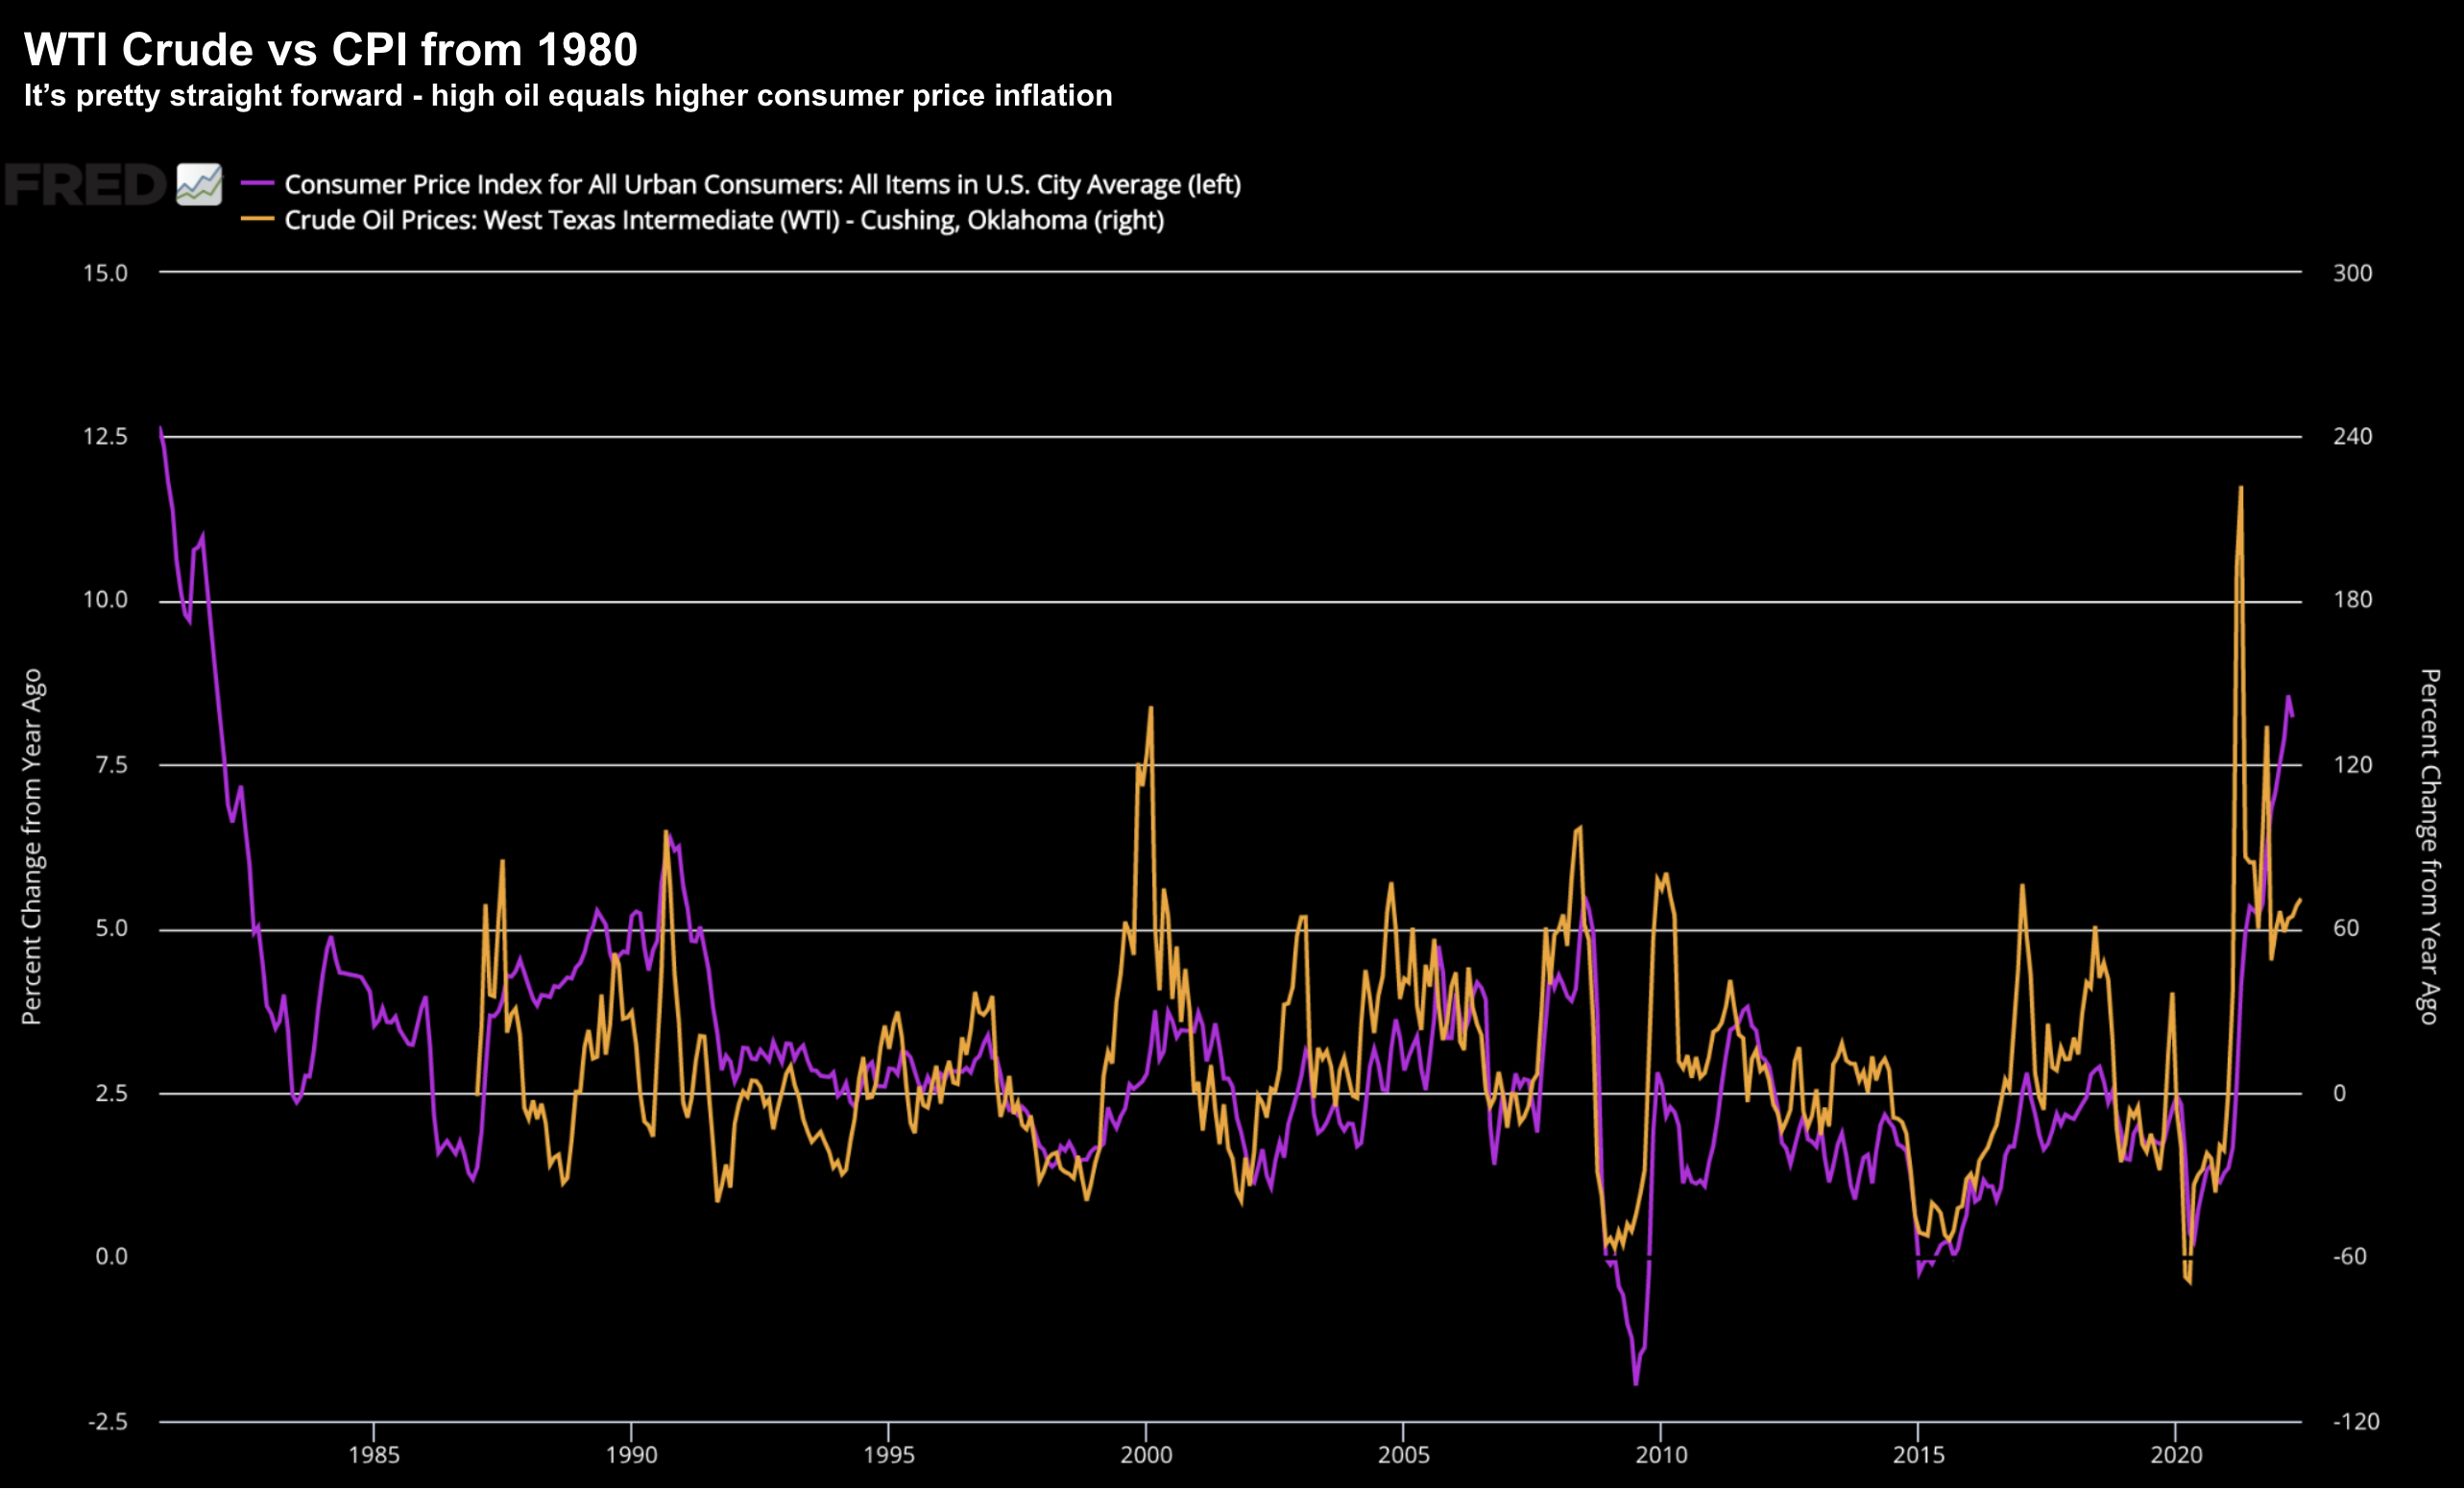
For example, I shared this chart yesterday showing the striking long-term correlation between WTI Crude (currently over US$120/b) and CPI from 1980:
But that feels unlikely given the situation in Ukraine and what we see with (anti fossil fuel) US energy policy. The market is severely supply constrained.
Expect CPI to finish 2022 with at least a 6-handle… despite the Fed’s measures.
Inflation Expectations Rise
As such, the only path to reducing unwanted inflation is:
- Taking money out of the economy (reducing its supply); and
- Ensure real rates are positive (improving the demand to hold money).
The engine slows to a grind.
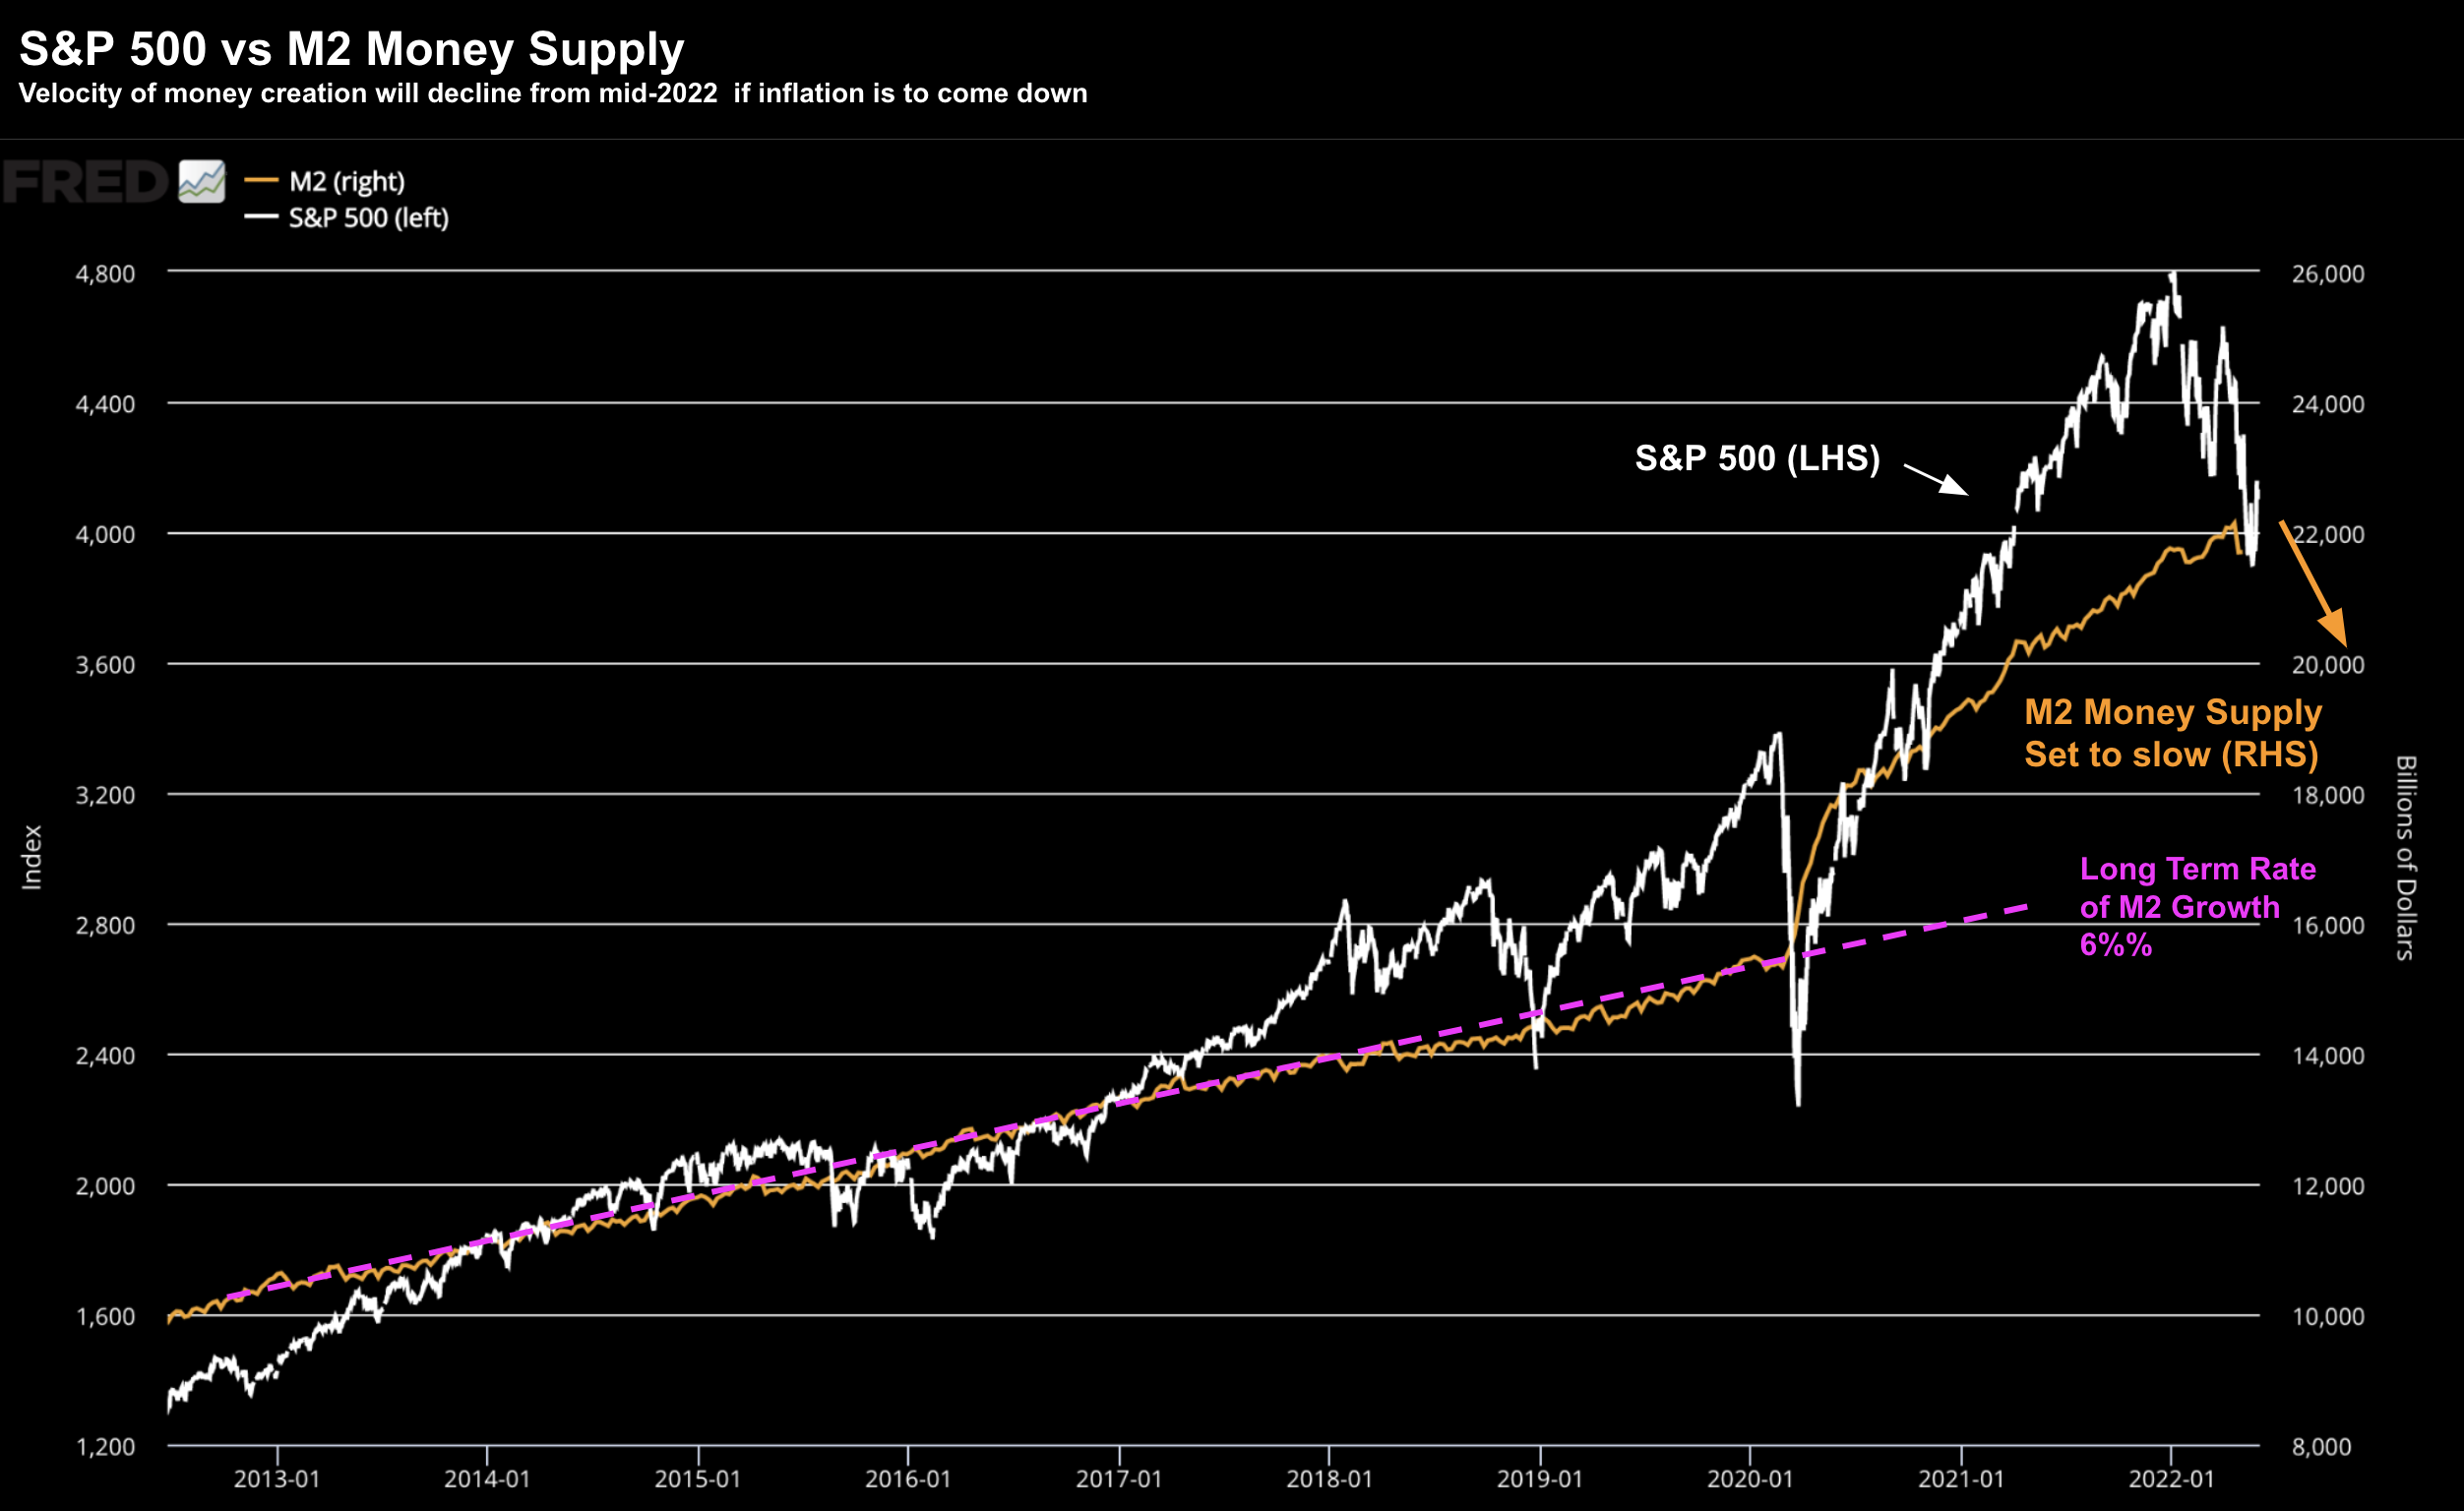
The ‘good news’ is the Fed is finally starting to slow M2 Money Supply.
For example, over the past 30 years money supply has averaged ~6% growth per year.
However, since the onset of the pandemic, growth in money supplied soared to 20%+ per year – giving rise to an excess of $4.2 Trillion in the system.
The Fed is now tasked with trying to take the (excess) out of the system with quantitative tightening (QT).
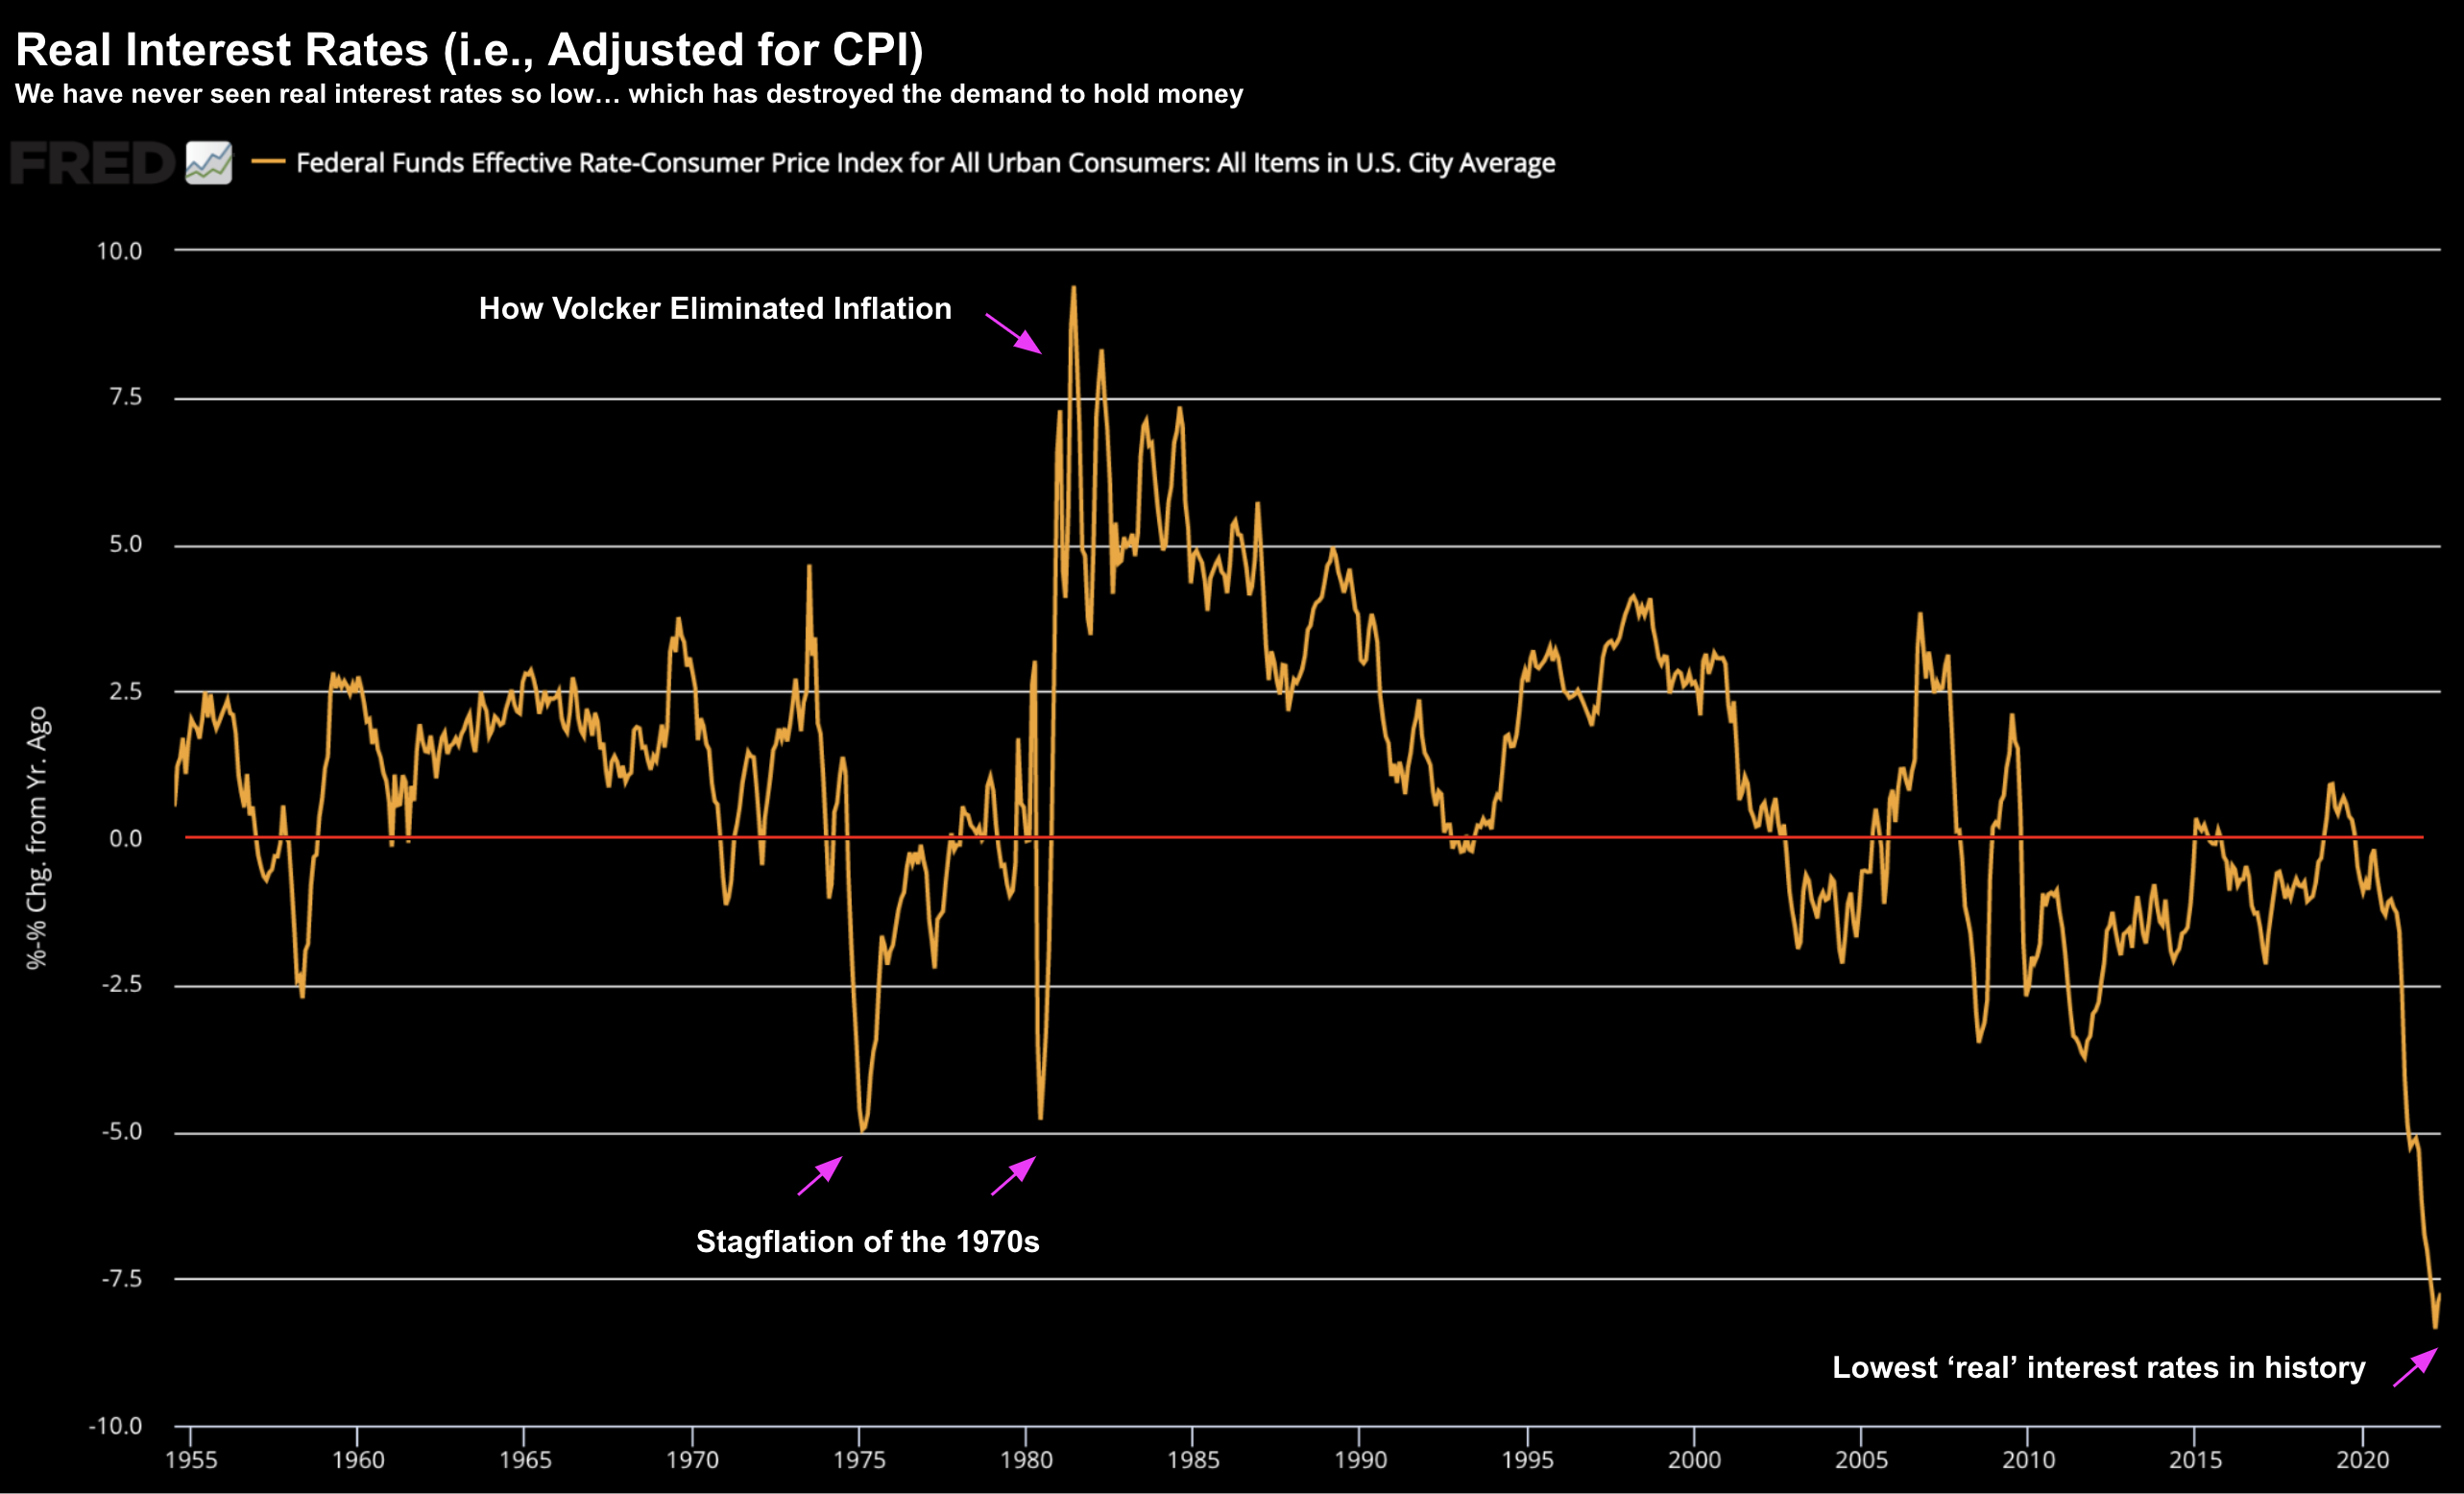
With respect to interest rates, the Fed still remains a long way behind the curve.
And on that basis – even with consecutive basis point rises of “50 + 50 + 50” – they will still be behind. However, they are trying to balance this with not completely crashing the economy.
But consider this chart for real rates (adjusted for CPI)
June 11 2022
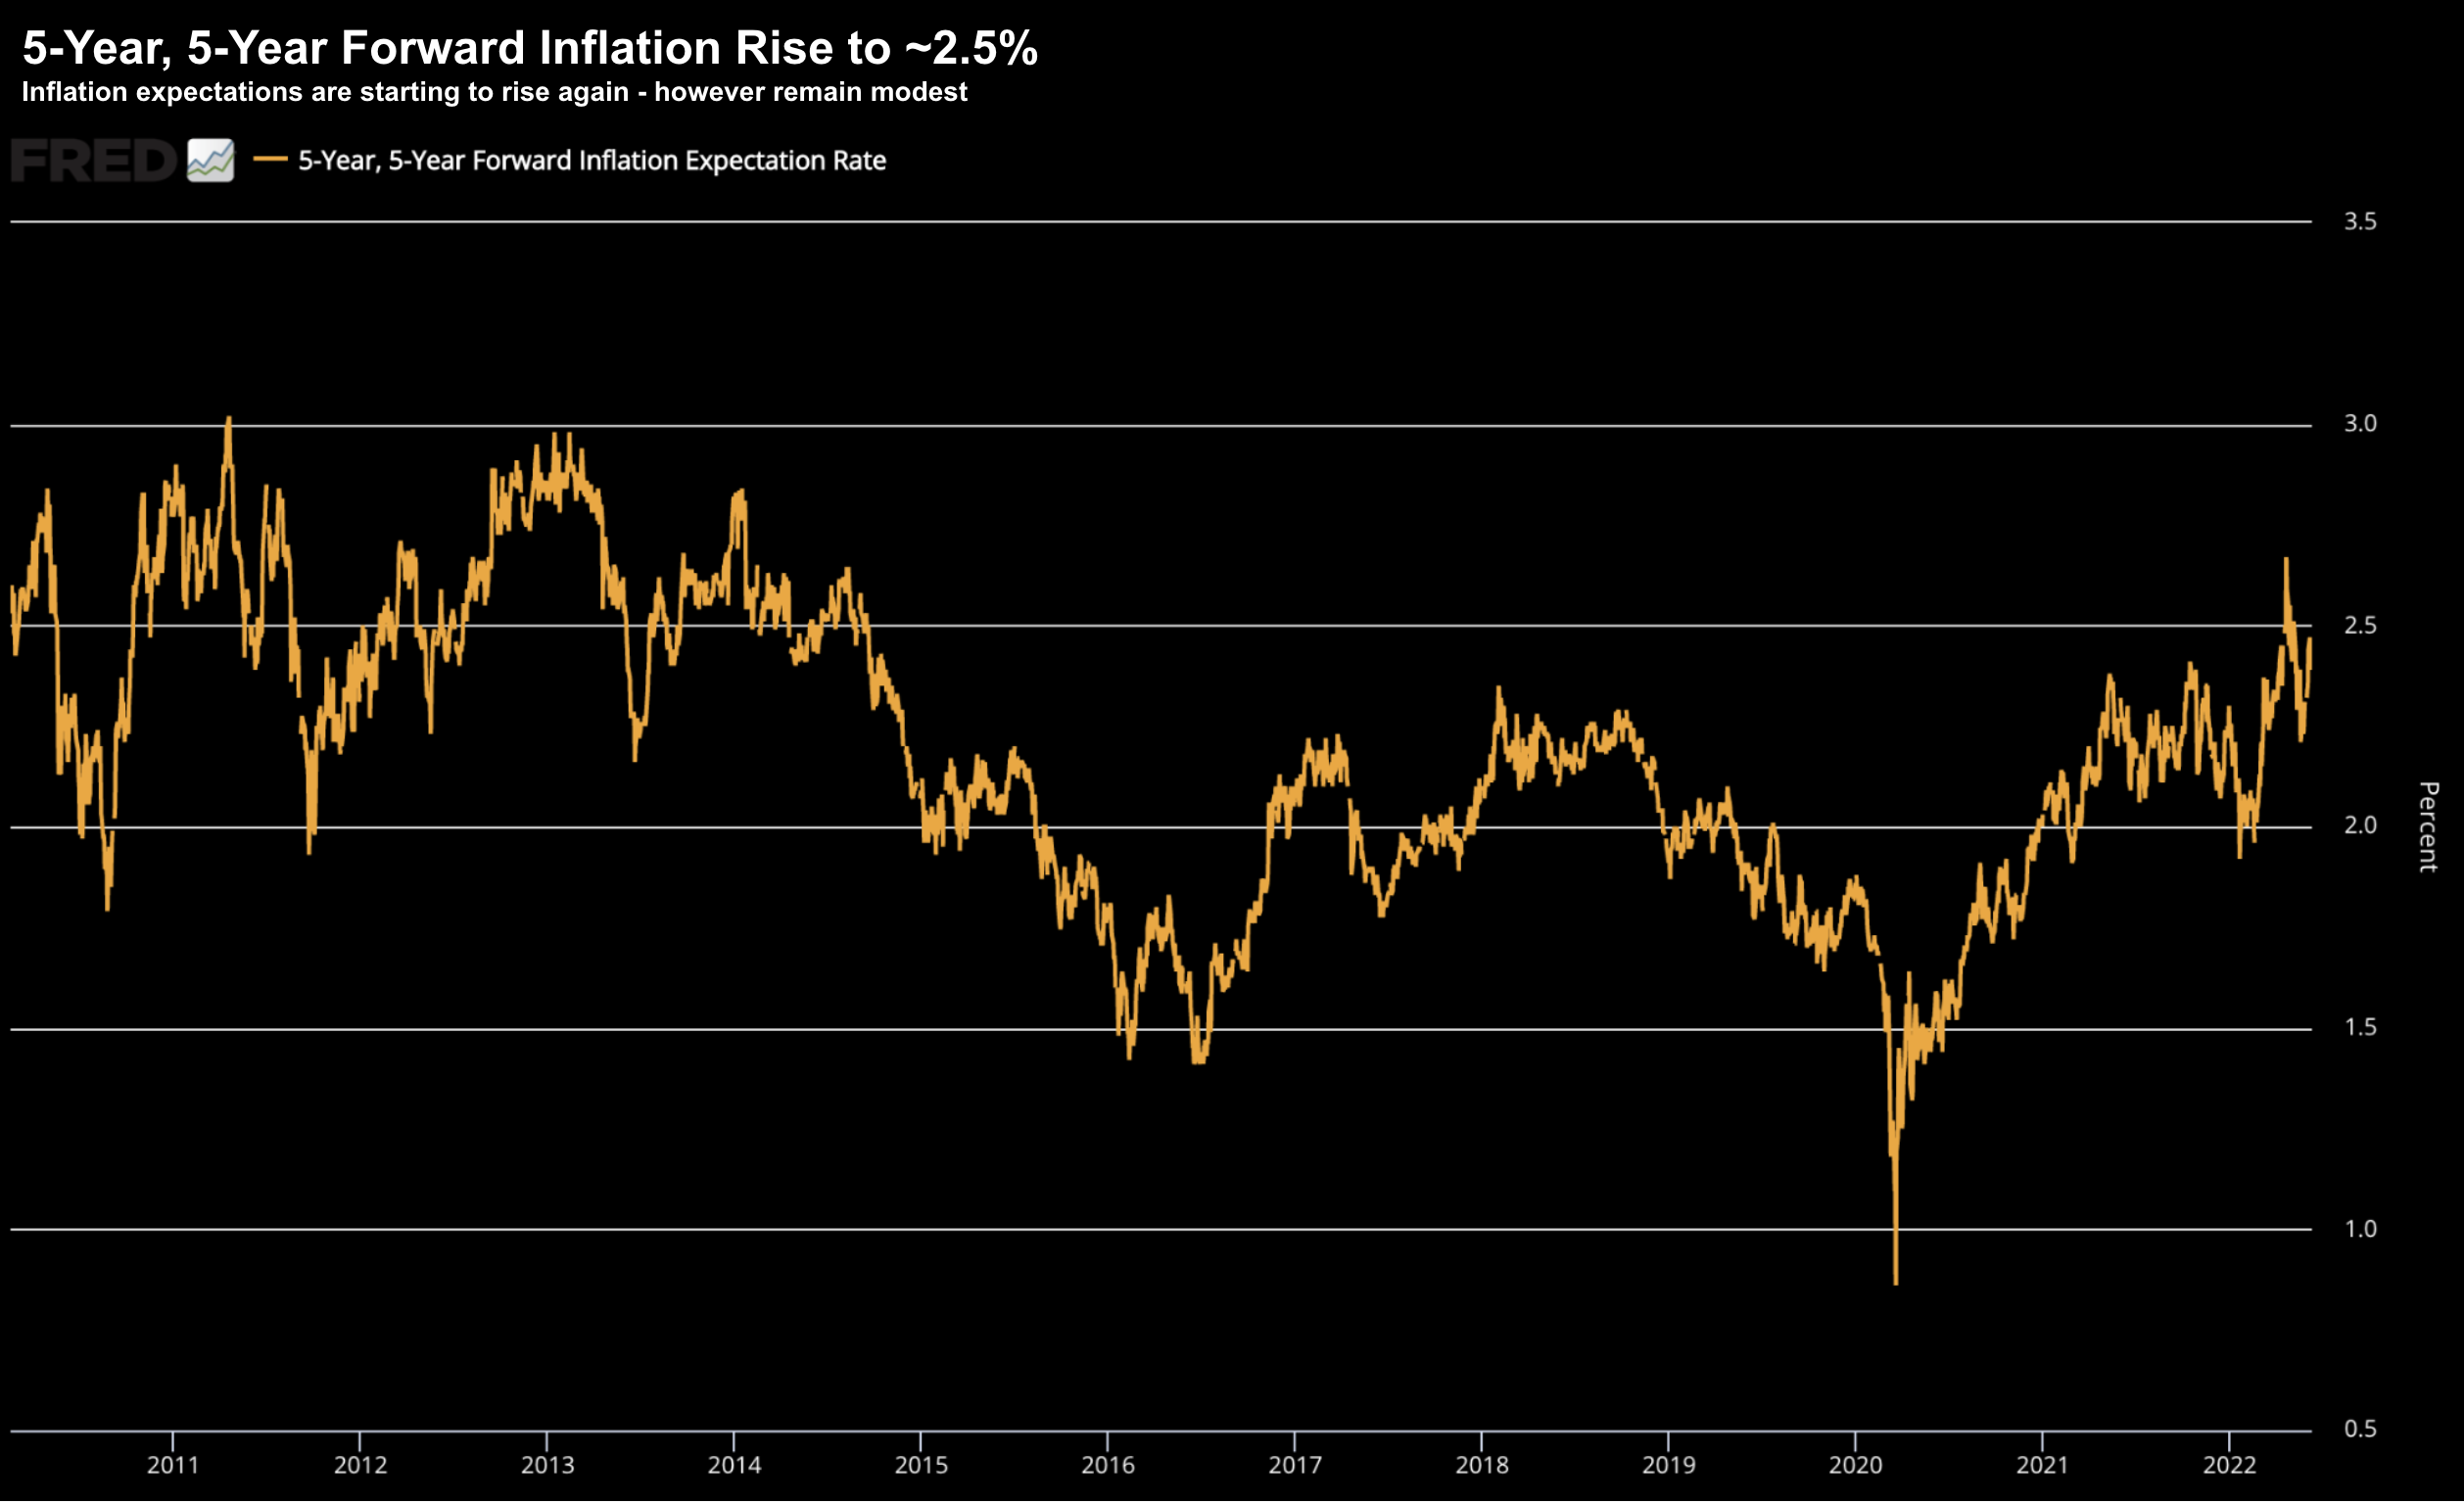
Now with respect to the 5-year / 5-year forward inflation expectation – it’s moving higher:
June 11 2022
And I think it will – but not before a recession with meaningful demand destruction.
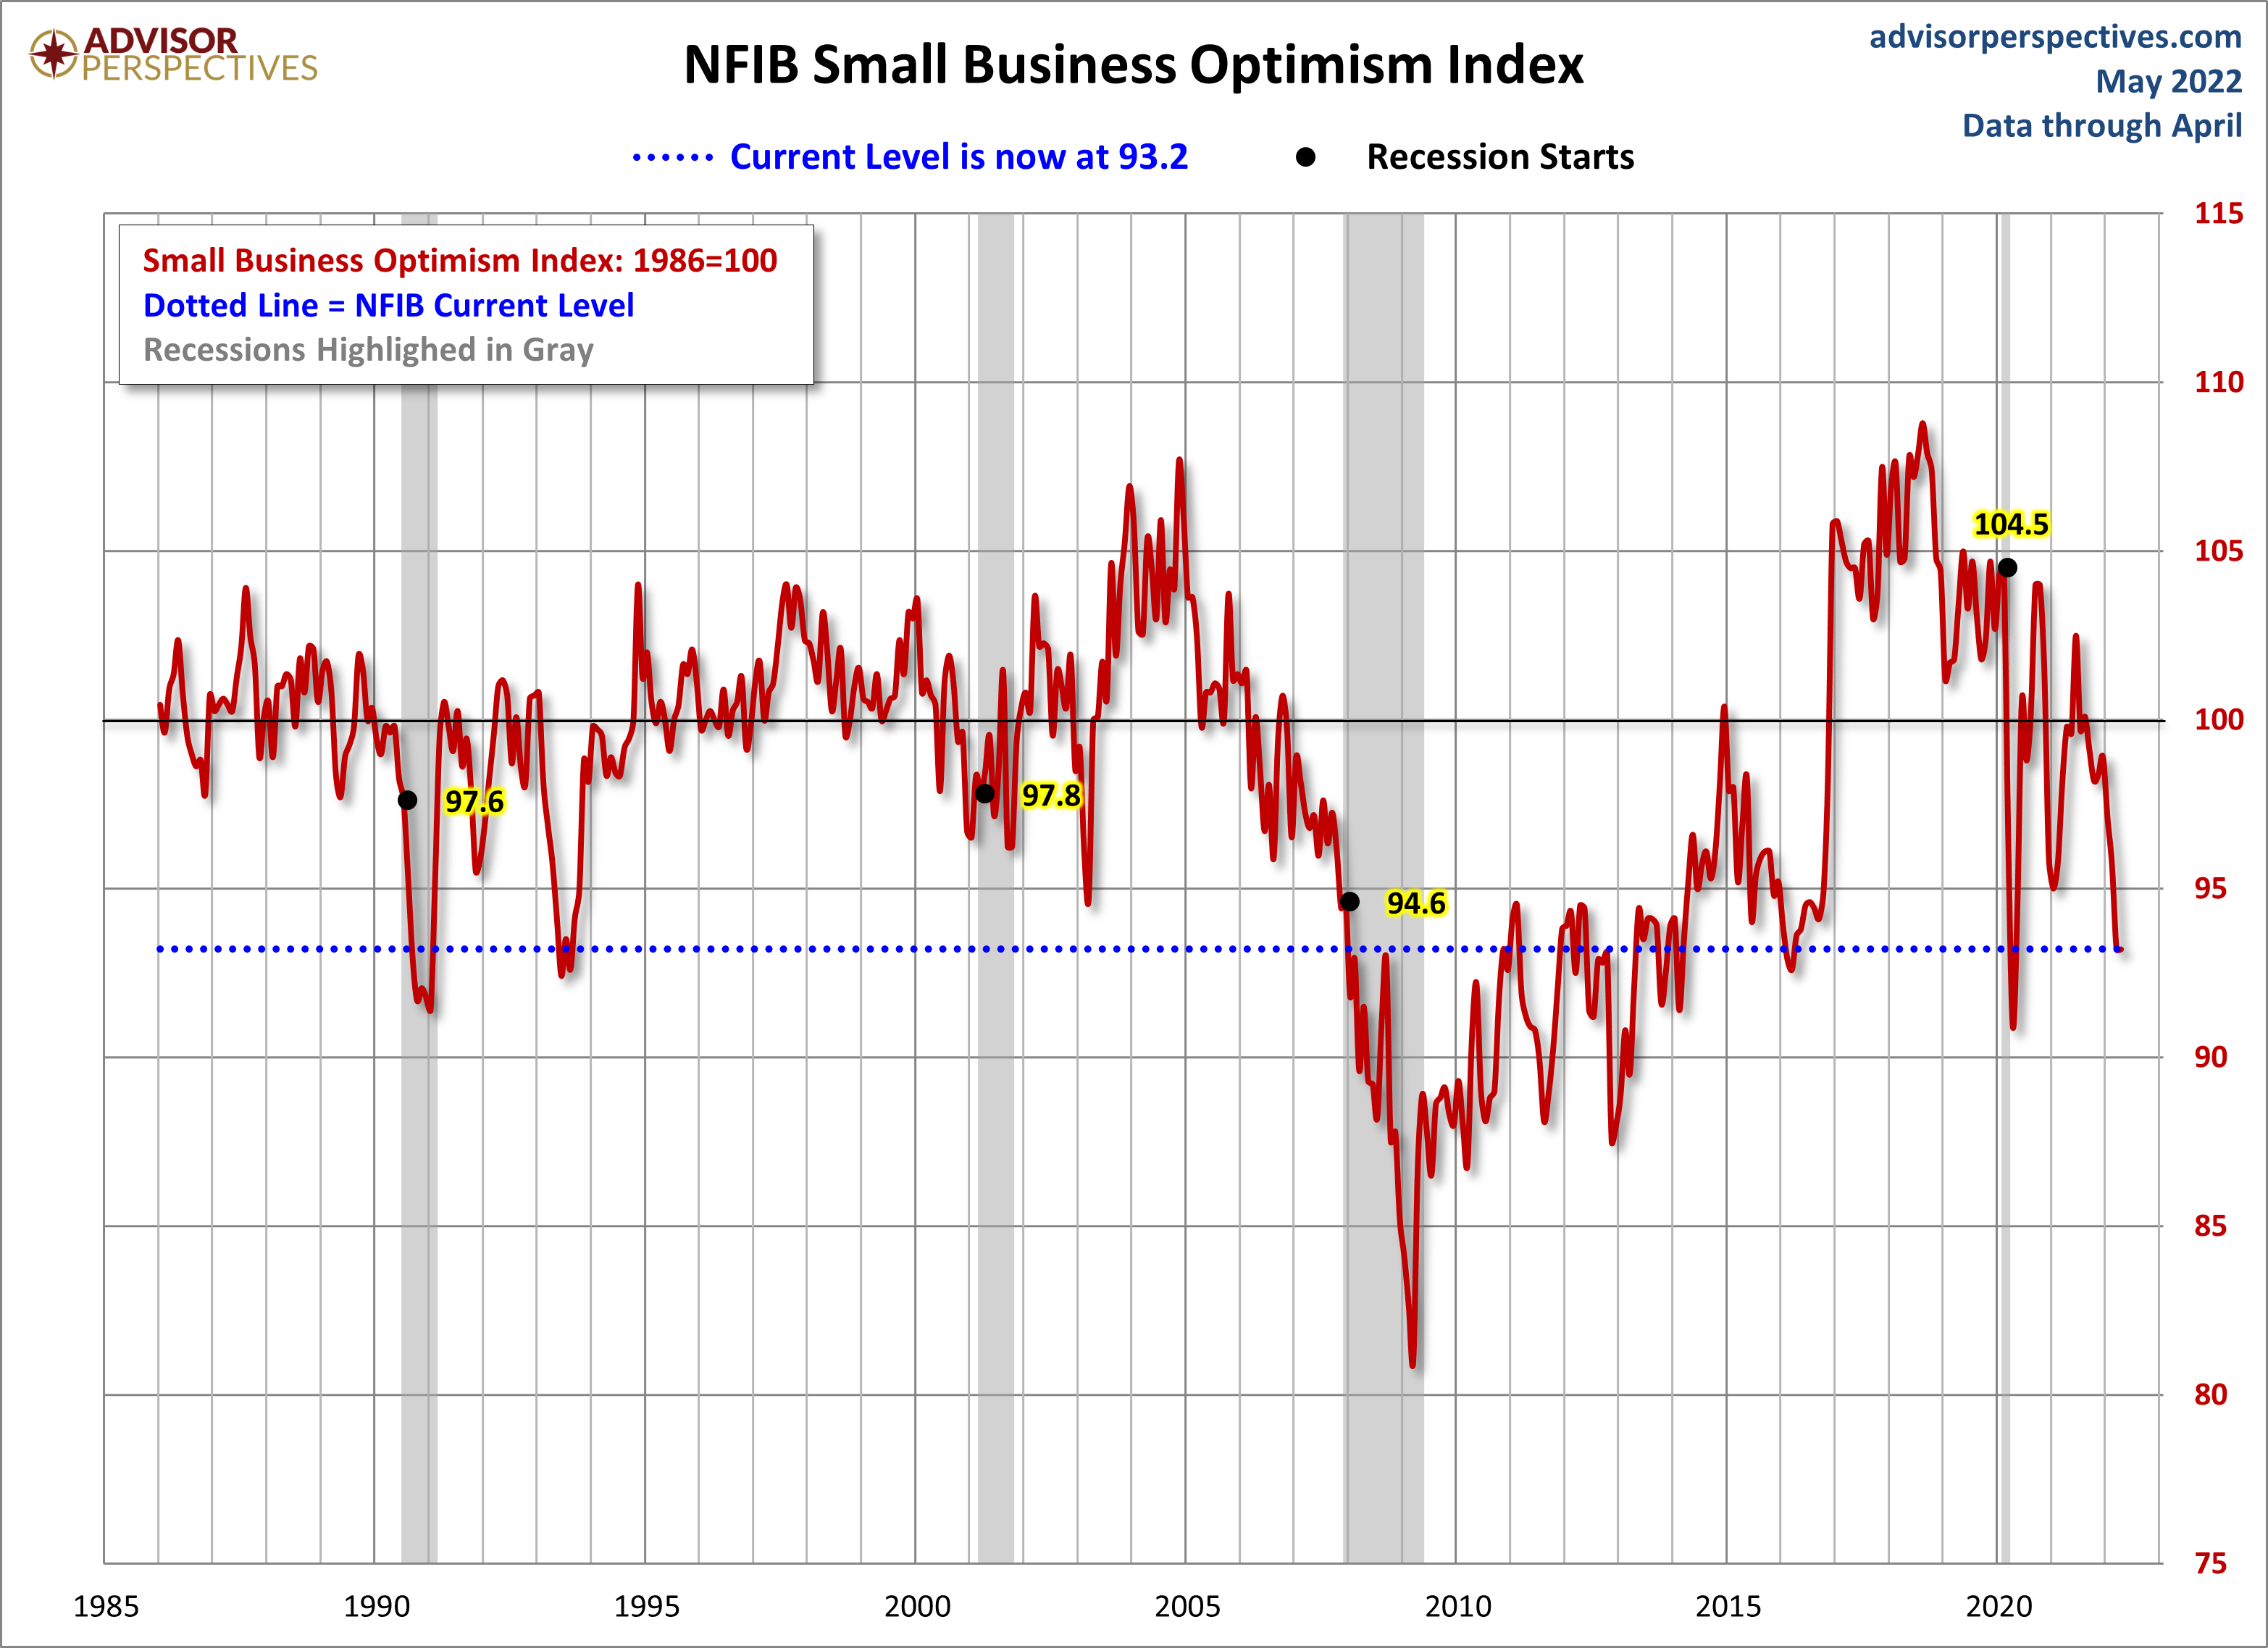
Consumer & Business Confidence Plummets
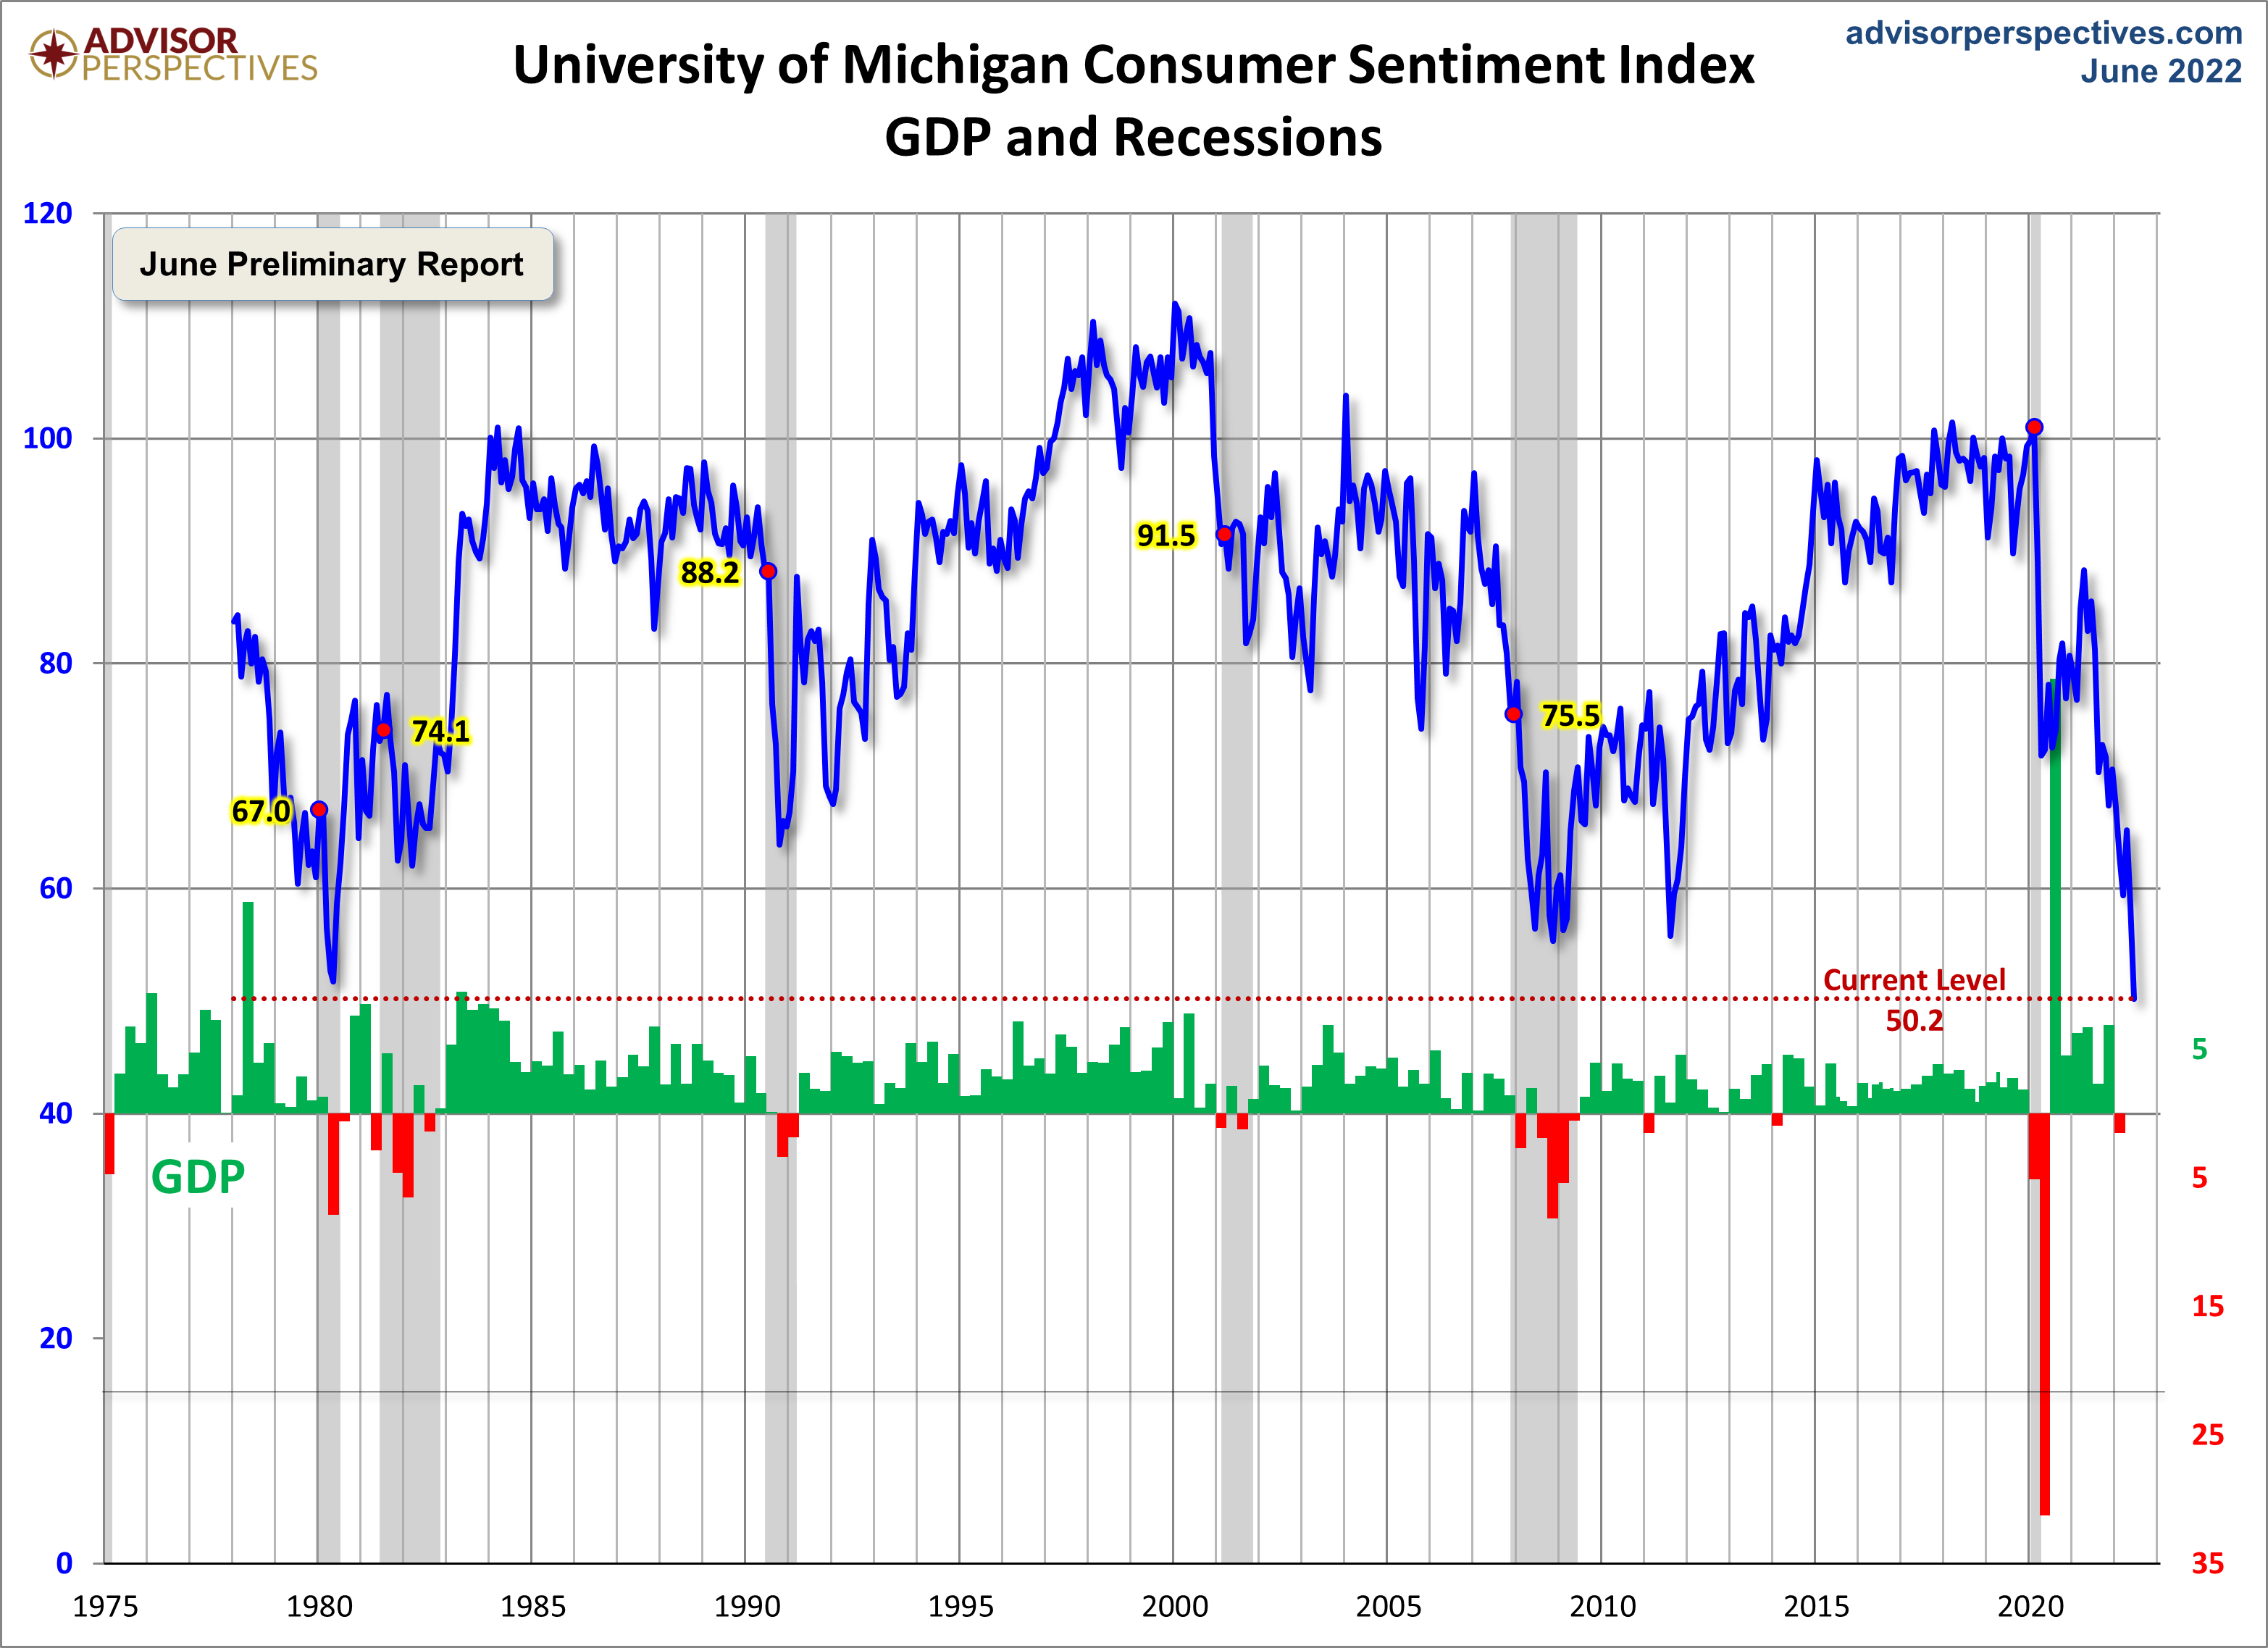
The University of Michigan’s gauge of consumer sentiment fell sharply to a record-low reading of 50.2, down from a May reading of 58.4.
Economists polled by the Wall Street Journal had expected a June reading of 59.
Now despite what are very low unemployment levels (below 4%) – consumer confidence is now comparable to the Jimmy Carter years.
It’s no coincidence that Carter also presided over a period of painfully high inflation with flat-to-negative growth (i.e., ‘stagflation’).
Rinse and repeat.
Americans’ expectations for overall inflation over the next year rose to 5.4% in June from 3.3% in May, while expectations for inflation over the next five years jumped to 3.3% from 3% in the prior month.
The share of consumers citing inflation as the biggest reason for their negative outlooks was the highest since 1981, said economists at Contingent Macro.
Today’s fiscal policy is more stick than carrot.
And these charts show the results.
There are (straight forward) fiscal measures which could see these charts sharply reverse course – but that’s not what we will see (not until at least 2024)
S&P 500 – Yet to See the Lows
For others – they are starting to lick their lips at the prospect of extremely compelling long-term opportunities.
I’m in the latter camp… staying patient and waiting for a true “market flush“.
As I have been saying – we are yet to see ‘panic selling’.
For example, the VIX sits at a modest 27. It’s high but not elevated.
When we see this move above 35 (ideally 45) – then I think we are getting closer to a flush.
For example, when names like Apple trade at ~$125; or Microsoft below $220; or Amazon below $100 (post their 20-1 split) – start to get excited.
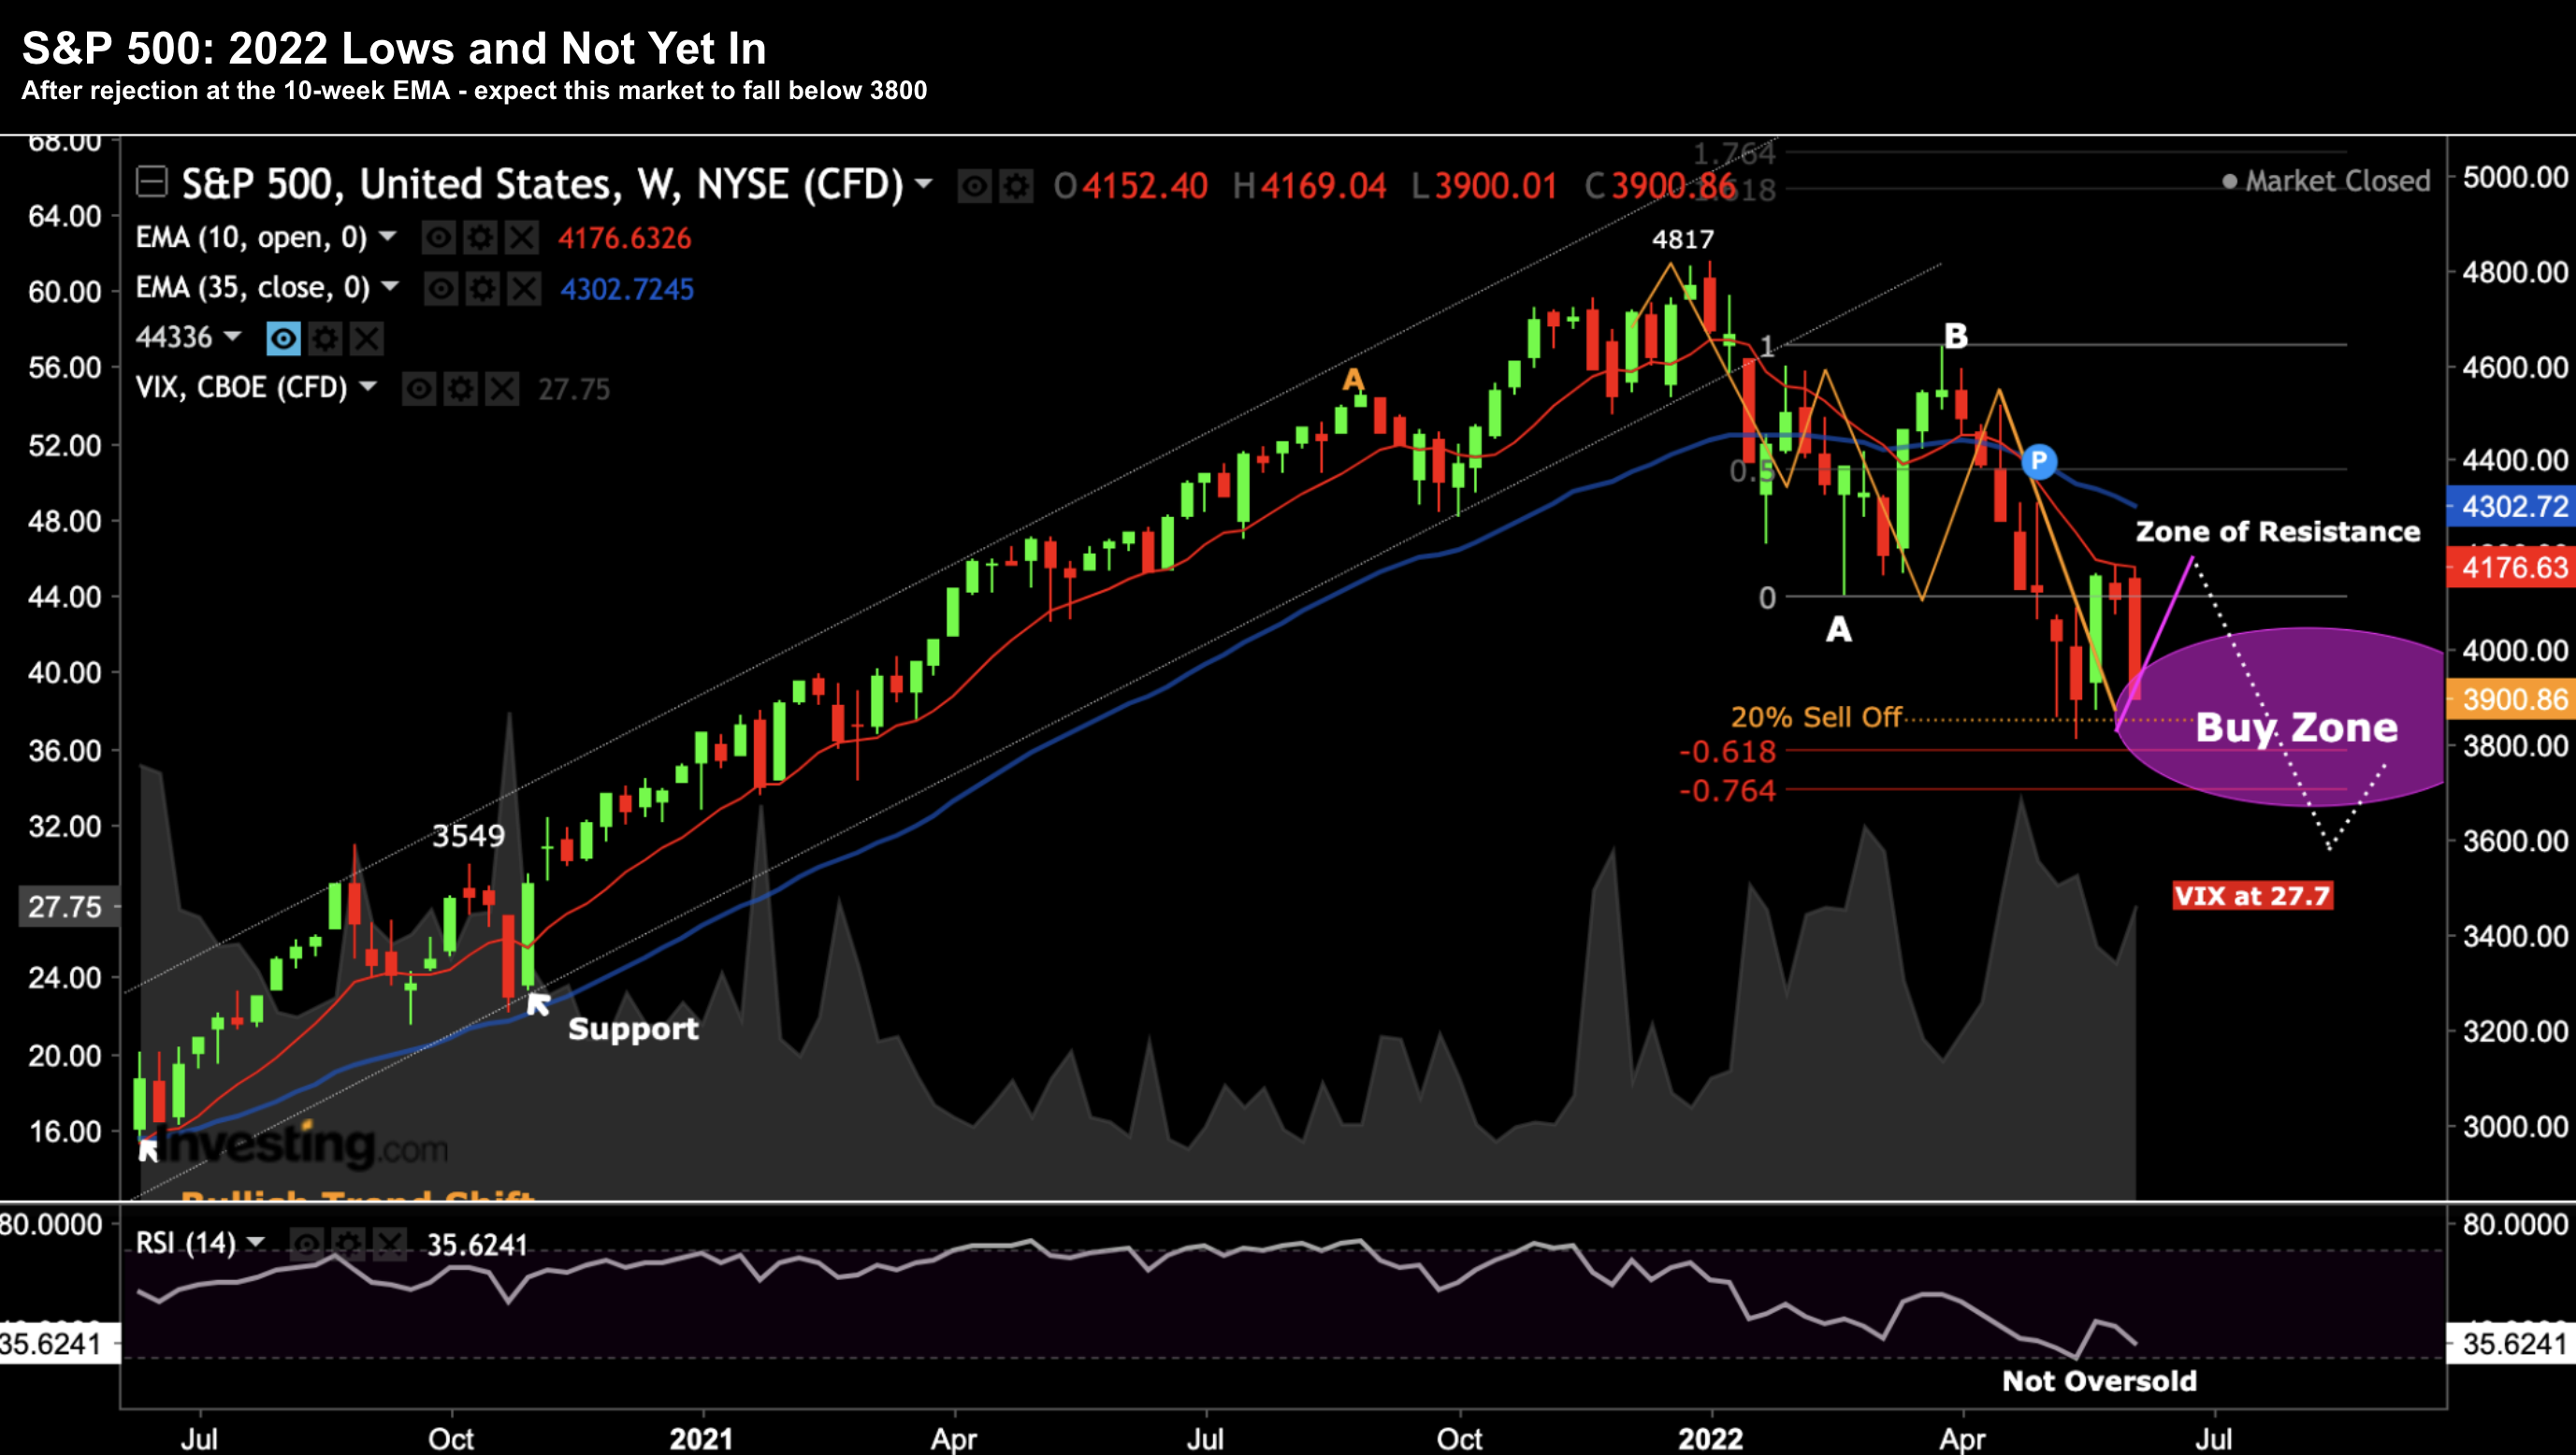
To the weekly chart – as things continue to trade per the script:
June 11 2022
If that breaks (and I suspect it will) – look for a test of around 3600.
I’ve nominated this level as it corresponds to the high made in August 2020.
Now I don’t pretend to know if that will be “the” bottom for 2022 (it could be much lower) – however I can say things are looking very attractive from a long-term (3-year) perspective.
As I’ve said in recent posts – a level of around 3600 will represent a forward PE of around 15x – pending what we see with earnings (this assumes $235 per share).
I also think if we see levels of 3600 or below – the VIX is also likely to be trading at or above 35 – which will be more representative of panic selling.
Finally, 3600 will be ~25% off the Jan market high of 4817.
Typically recession based retracements average something in the realm of ~30%.
Putting it All Together…
This effectively reminded participants that Fed hikes of “50, 50, 50″ are not off the table.
In fact, don’t rule out 75 bps at the next meeting. And it’s what the Fed should do until they get CPI back below 8%.
But that’s not what the Fed will do…
The second ‘domino’ to fall will be Q2 earnings revisions.
We have been given a glimpse into what Q2 looks like via Target, Restoration Hardware, Snap and Microsoft.
But there’s more to come…
And when analysts finally get around to revising down their lofty expectations for earnings – prices will come down further.
Only then will we get closer to the market putting in the lows for 2022.
The good news is we are almost there…

