- 10/2 Yr Yield Curve inverts briefly for first time since 2019
- This doesn’t mean stocks can’t rally the next 12+ months
- Not all yield curves are equal! Pay attention to real yields
The stock market is euphoric.
It’s rising faster than a 1999 internet stock!
The bond market however does not share its new-found enthusiasm.
It’s starting to dust off the “recession playbook”.
Too early?
Maybe… but I will get to that in a moment.
But it does remind me of an old Wall Street saying:
Bond markets are always early… and typically right.
Put another way, the ‘smart money’ (bond market) generally has a more ‘balanced’ lens when it comes to forecasting what’s ahead. However, it is also early with its signal.
And in the case of the 10/2 year curve – potentially up to two years early.
Now this curve inverted briefly today…
This part of the curve is viewed by many as a reliable signal that a recession is likely to follow within 1 to 2 years time.
And that may be true…
For clarity, an inversion refers to the yield of the shorter duration bond (e.g. 2-year) exceeding the duration of the longer-dated (e.g., 10-year) yield
However, it doesn’t mean investors should panic and sell stocks.
Quite the contrary…
History shows us that markets typically rally for several months after the yield curve inverts (as I’ve shown in previous posts). And those rallies can be meaningful (e.g. as much as 30% in some cases).
That’s a lot of money to leave on the table.
But…
The bond market is a strong sign that growth is slowing sharply. That much we should take away.
What’s more, it’s a strong indicator the Fed may have already made a policy mistake.
Not All Curves are Created Equal
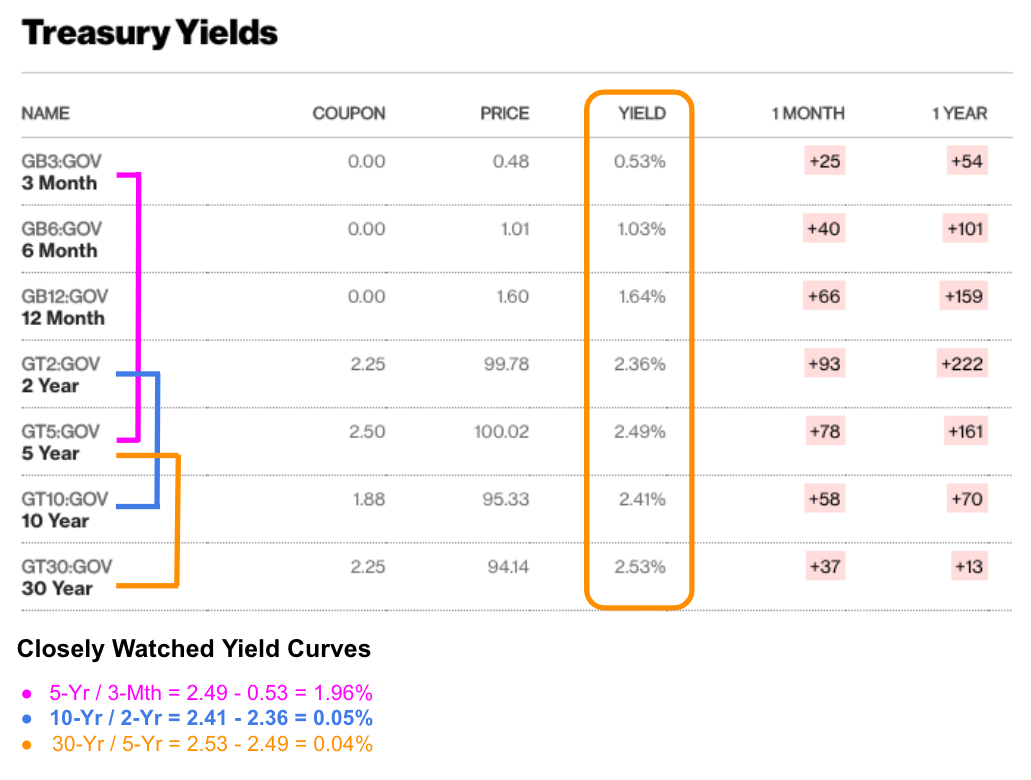
To set the scene – below is a table of US bond yields as it stands at the time of writing:
Three of the more widely cited ‘curves’ are:
- 5-Year / 3-Month;
- 10-Year / 2-Year; and
- 30-Year / 5-Year
Each of these differ in terms of their spread.
For example, the 10/2 year spread is now just 5 basis points (or 0.05%). However, the spread between the 5-Yr / 3-Mth is a (very steep) 196 basis points (i.e. 1.96%)
Both tell a different story. However, what’s worth asking is:
- Why does any of this matter? and
- What does it all mean?
A couple of things…
First up, it’s reasonable to assume we have a better visibility of the potential risks if the timeframe is short. However, if we extend that timeframe to the future (e.g. 10-years) – well that is very difficult to determine with any high degree of certainty.
Given we know less about the future – longer-duration bonds (e.g., 10 and 30-year) will typically command far higher yields to compensate for the greater risks involved in buying them.
But…
When the delta between short and long yields narrows – the yield curve is said to ‘flatten’. And should the short-end yield exceed that of the long-end (e.g. the 2-year is above that of the 10-year ) – we have an inversion.
This matters for two reasons:
- Yield curve inversions tend to be a strong warning that a recession (or at worst, very slow growth) is now within 1-2 years; and
- This can mean tougher going for banks – who traditionally make their money by buying short-term (through deposits) at low rates, and lending longer term at higher rates. The difference is their margin.
Banks typically don’t like buying a higher price than they are selling (in this case lending) – therefore credit growth slows.
Put together, this is the bond market telling the Fed to be careful with tightening… as the growth simply is not going to be there.
Which Yield Curve Should We Listen To?
As mentioned in the preface, there are a number of yield curves pending which two durations you choose.
For example, take the popular 10/2 Year Treasury.
The 10-year is perhaps the most important financial asset on the planet.
It underpins every financial vehicle; your mortgage; car loan; credit card loan; student loan… you name it.
Now, what the 10-year yield is telling us what kind of growth (or in this case – lack of growth) is coming down the pike.
At the other end, the 2-year is closely correlated to what we see from the Fed funds rate.
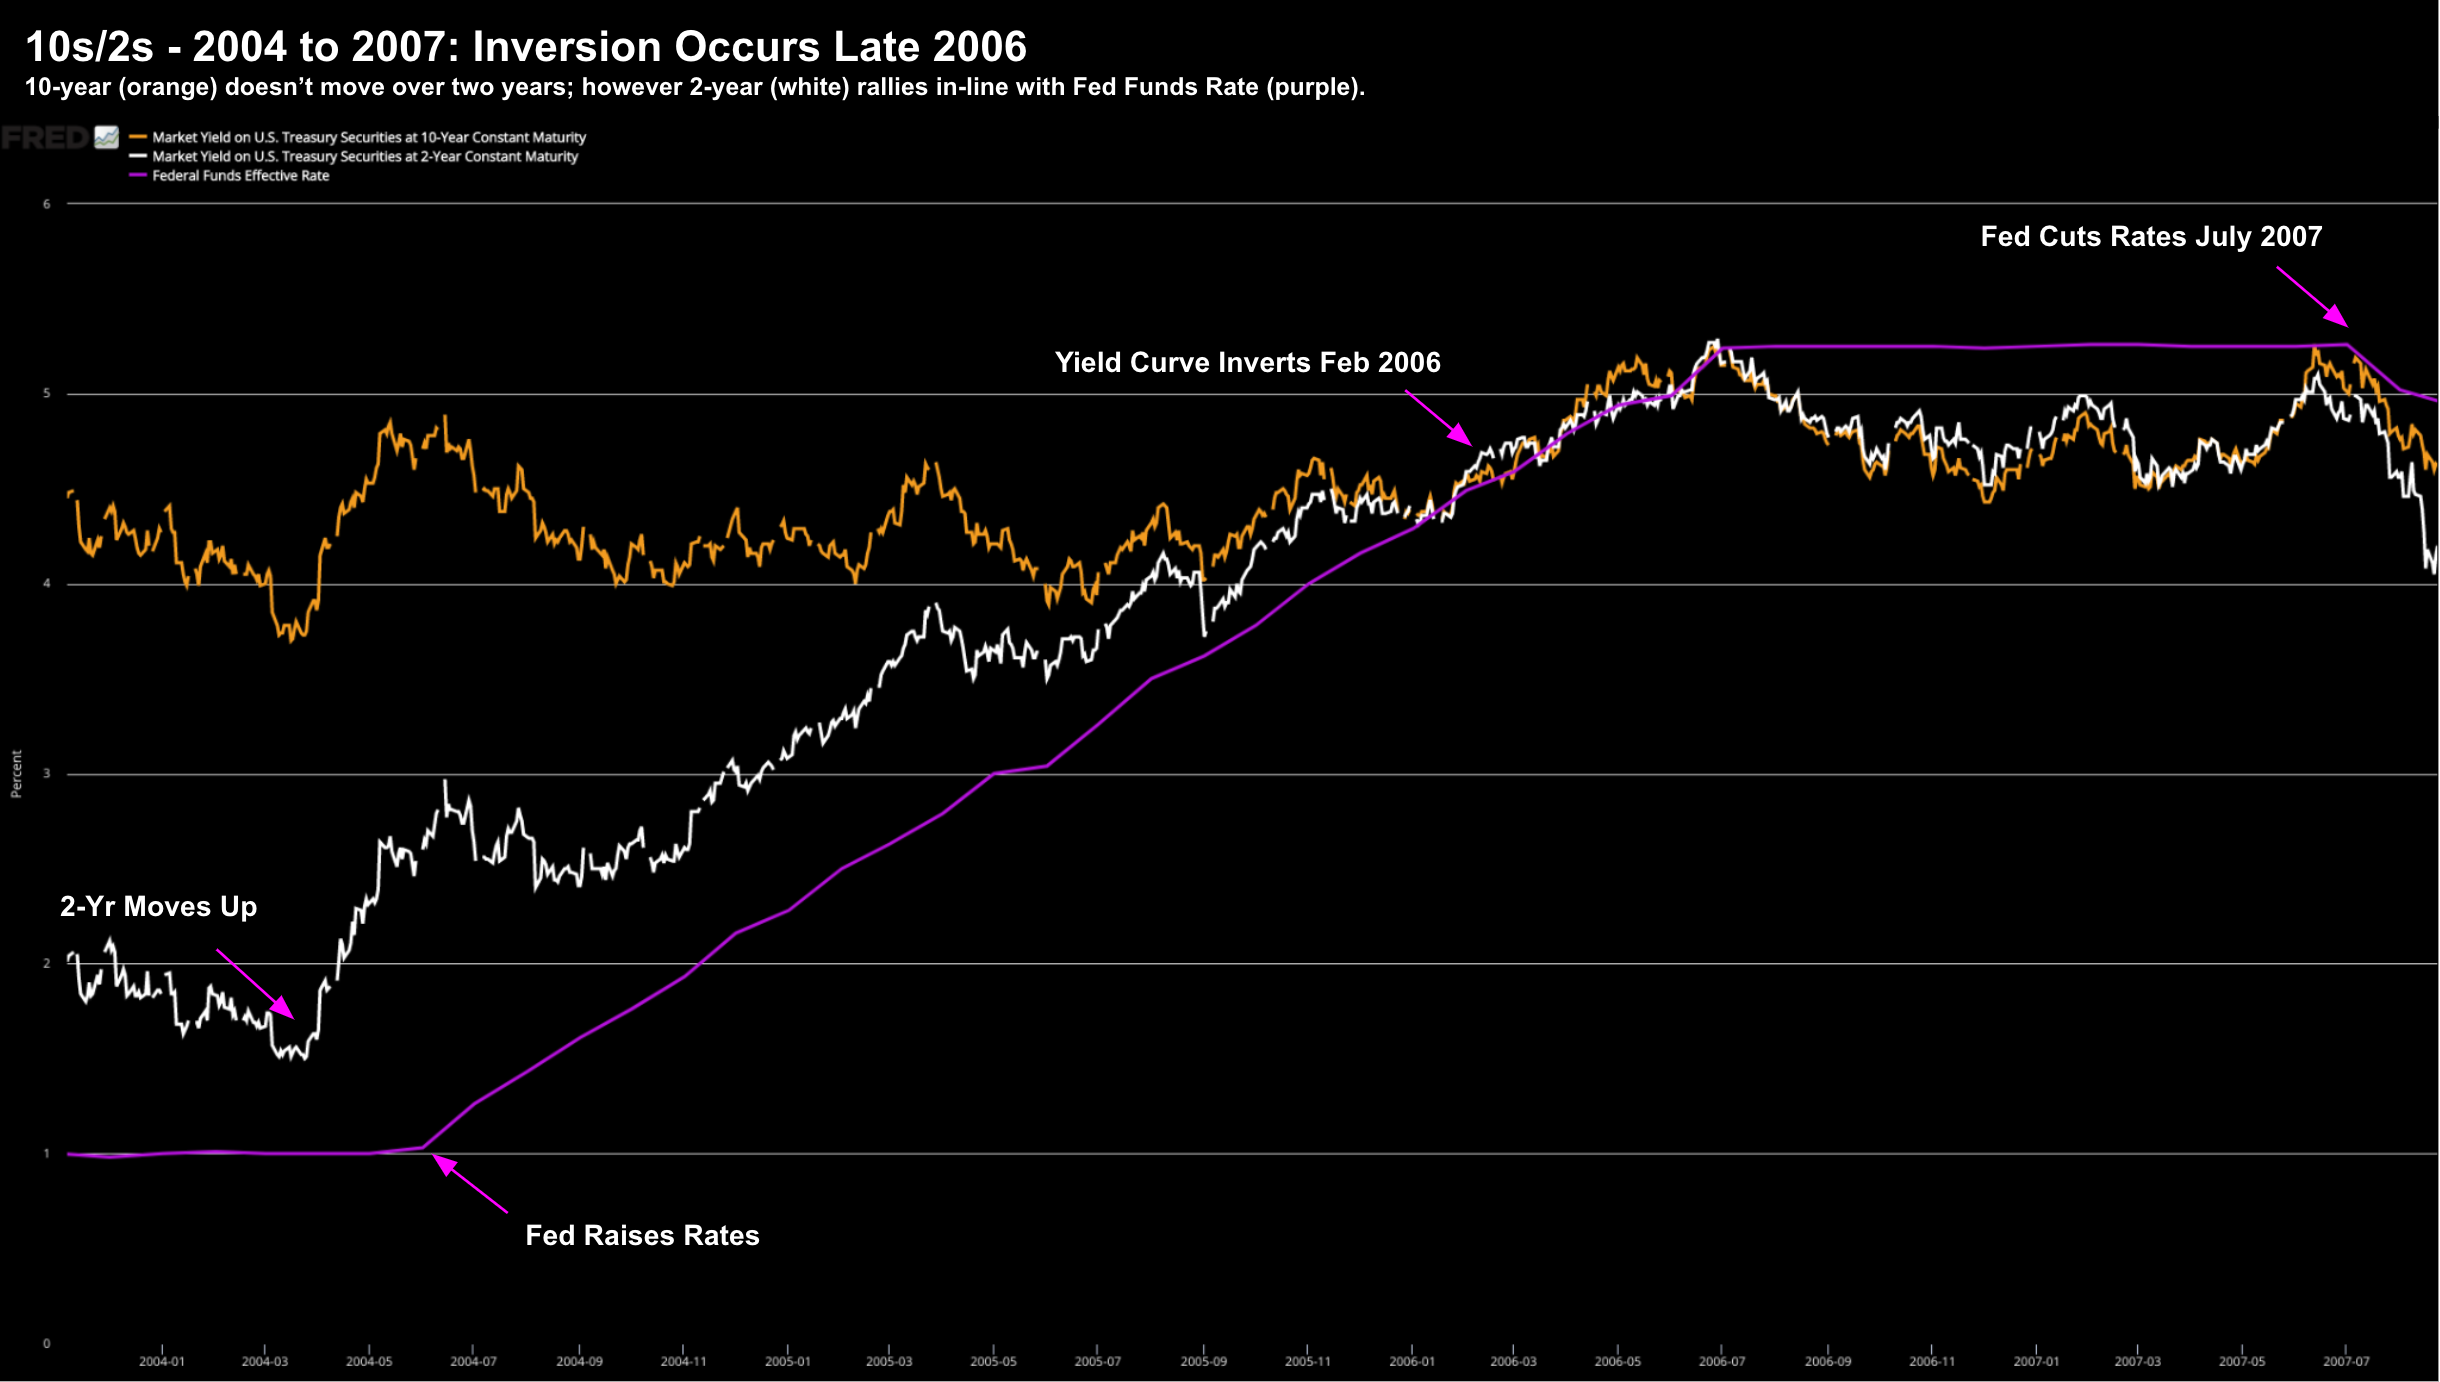
For example, if we look back the 2004 – 2006 rate hike cycle, the nominal Fed funds rate went from 1.00% to 5.25%
Over that time, we saw a commensurate rise in the 2-year note yield.
However, the 10-year yield didn’t move – which caused the inversion in Feb 2006
Take a look:
March 29 2022
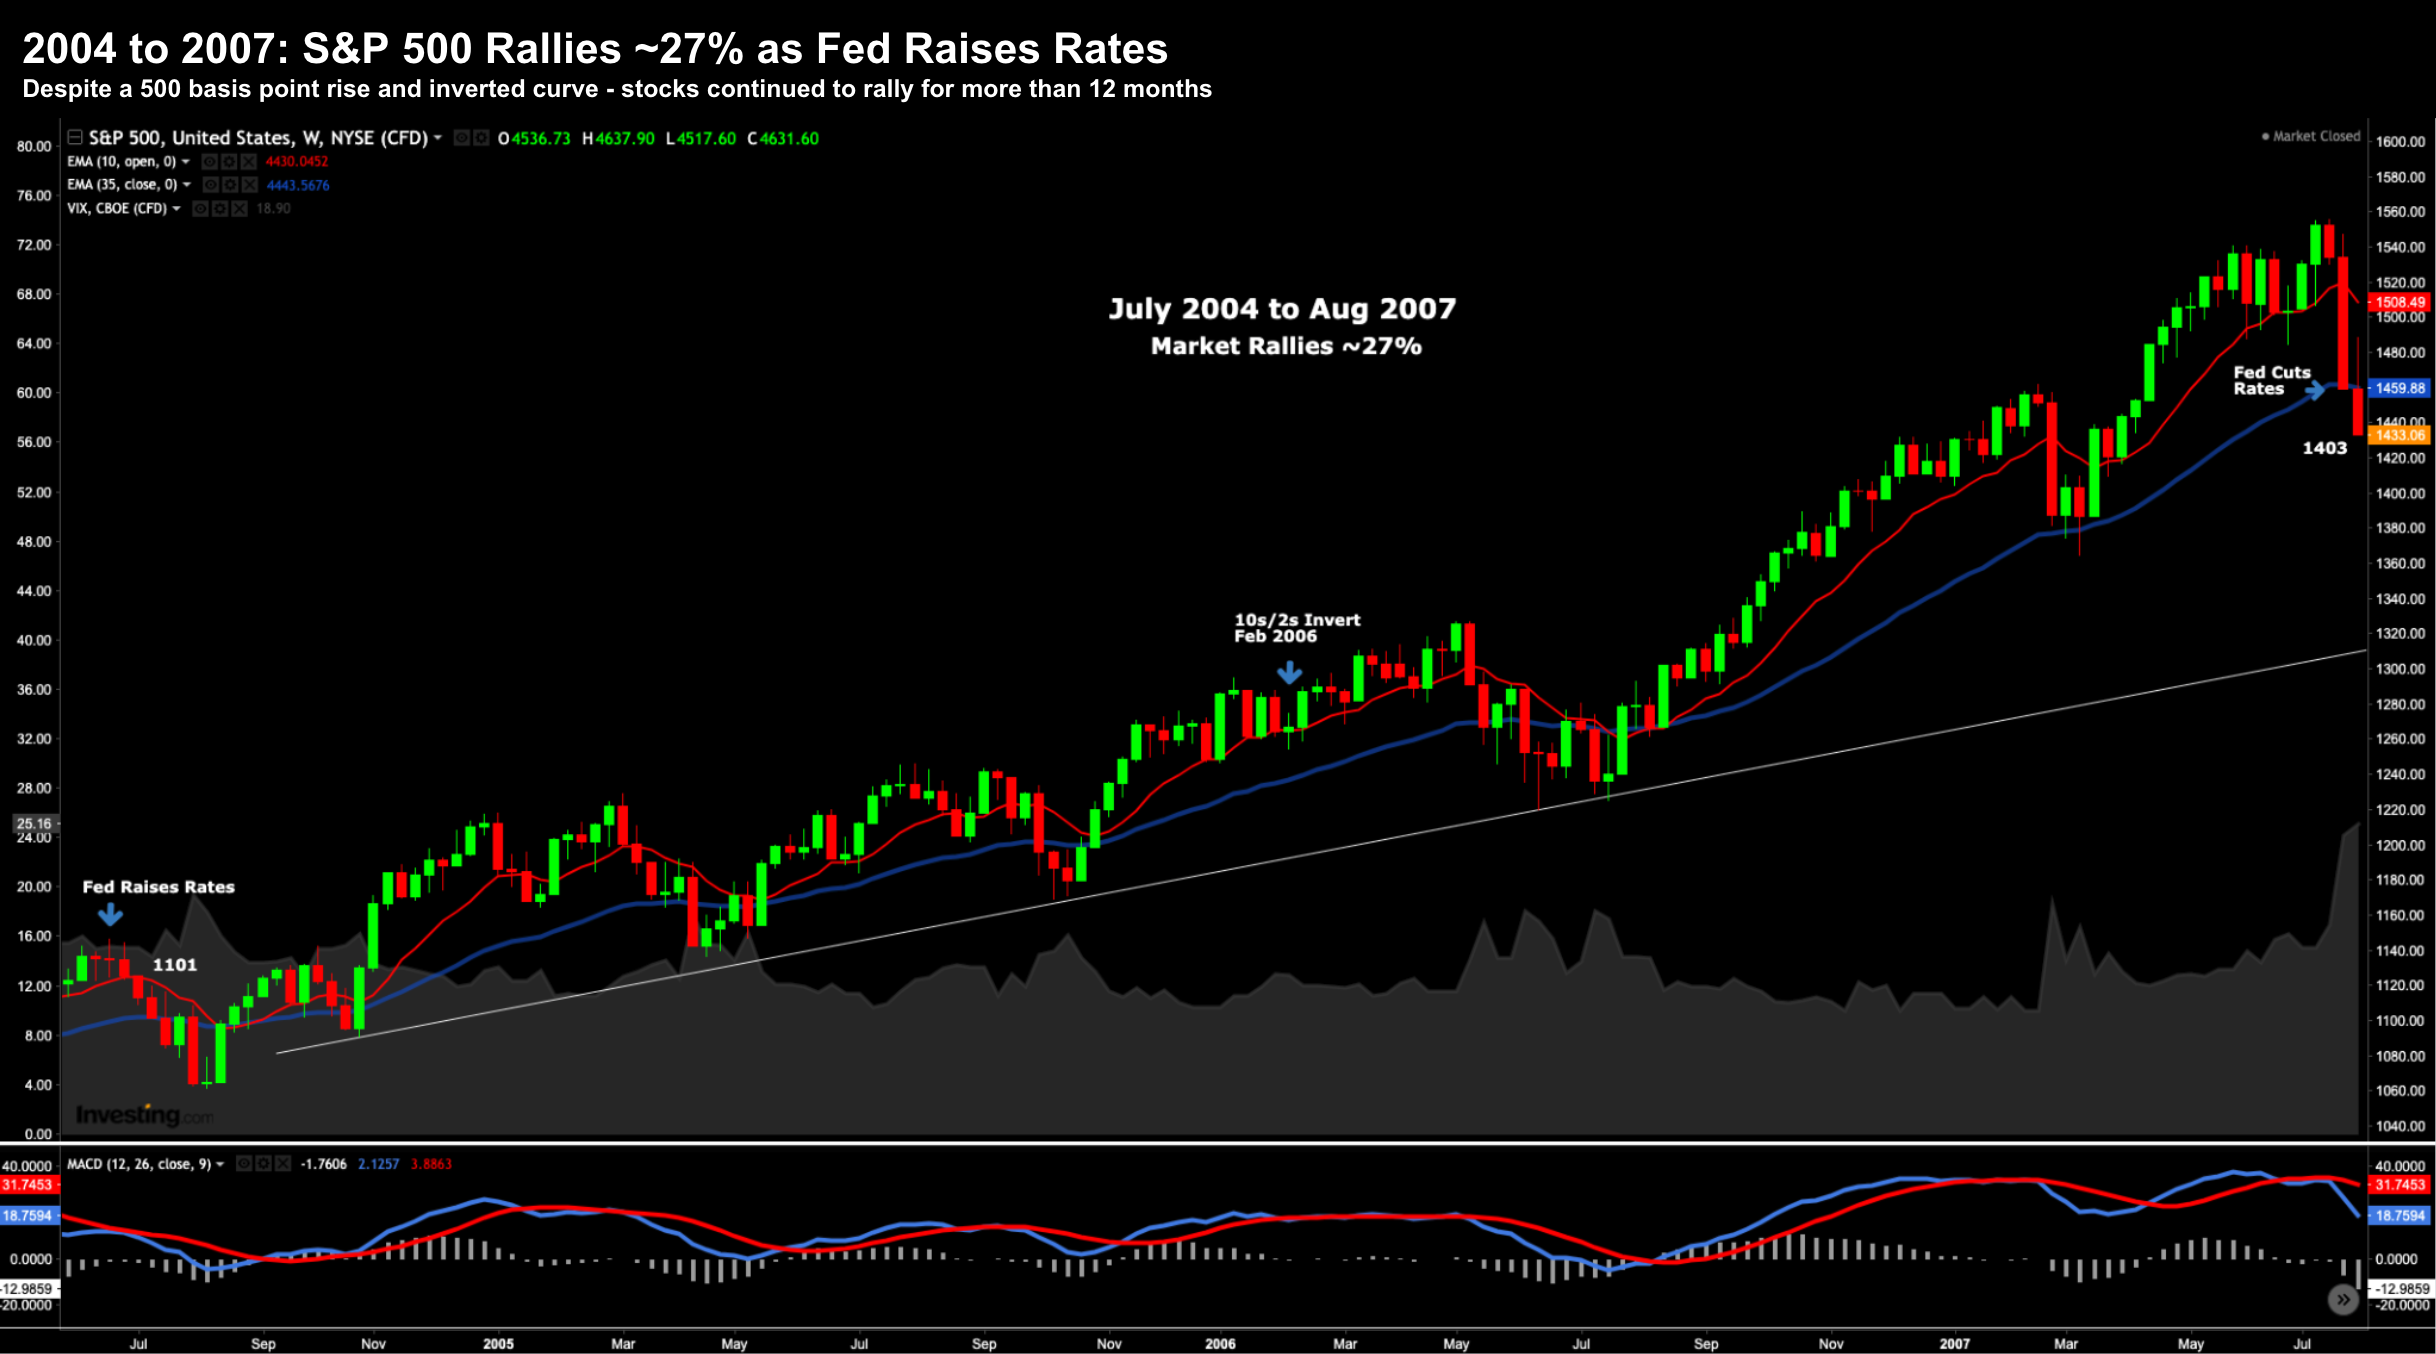
And what did we see with the S&P 500 over this 4-year period?
Despite the fearful yield curve inversion (and all the hysteria) – stocks continued their march higher.
For example, from the point of which the Fed started raising rates through to their next rate cut – stocks added something like 27%
It wasn’t until we saw the pivot on its rate hikes that stocks started to correct.
My read on the “10/2″ is the bond market is now more cautious that the Fed will not be successful with its intended soft-landing.
In other words, it’s going to be very difficult for them to not cause a recession.
How About a Shorter Duration Curve?
Let’s now turn our attention to the shorter 5-year / 3-month curve.
The spread here is 196 basis points… a far cry from any inversion.
In market speak – we would say that’s reasonably steep.
This means there is a big difference between the narrative between the “10s / 2s” vs that of the “5-Yr / 3-Mth”.
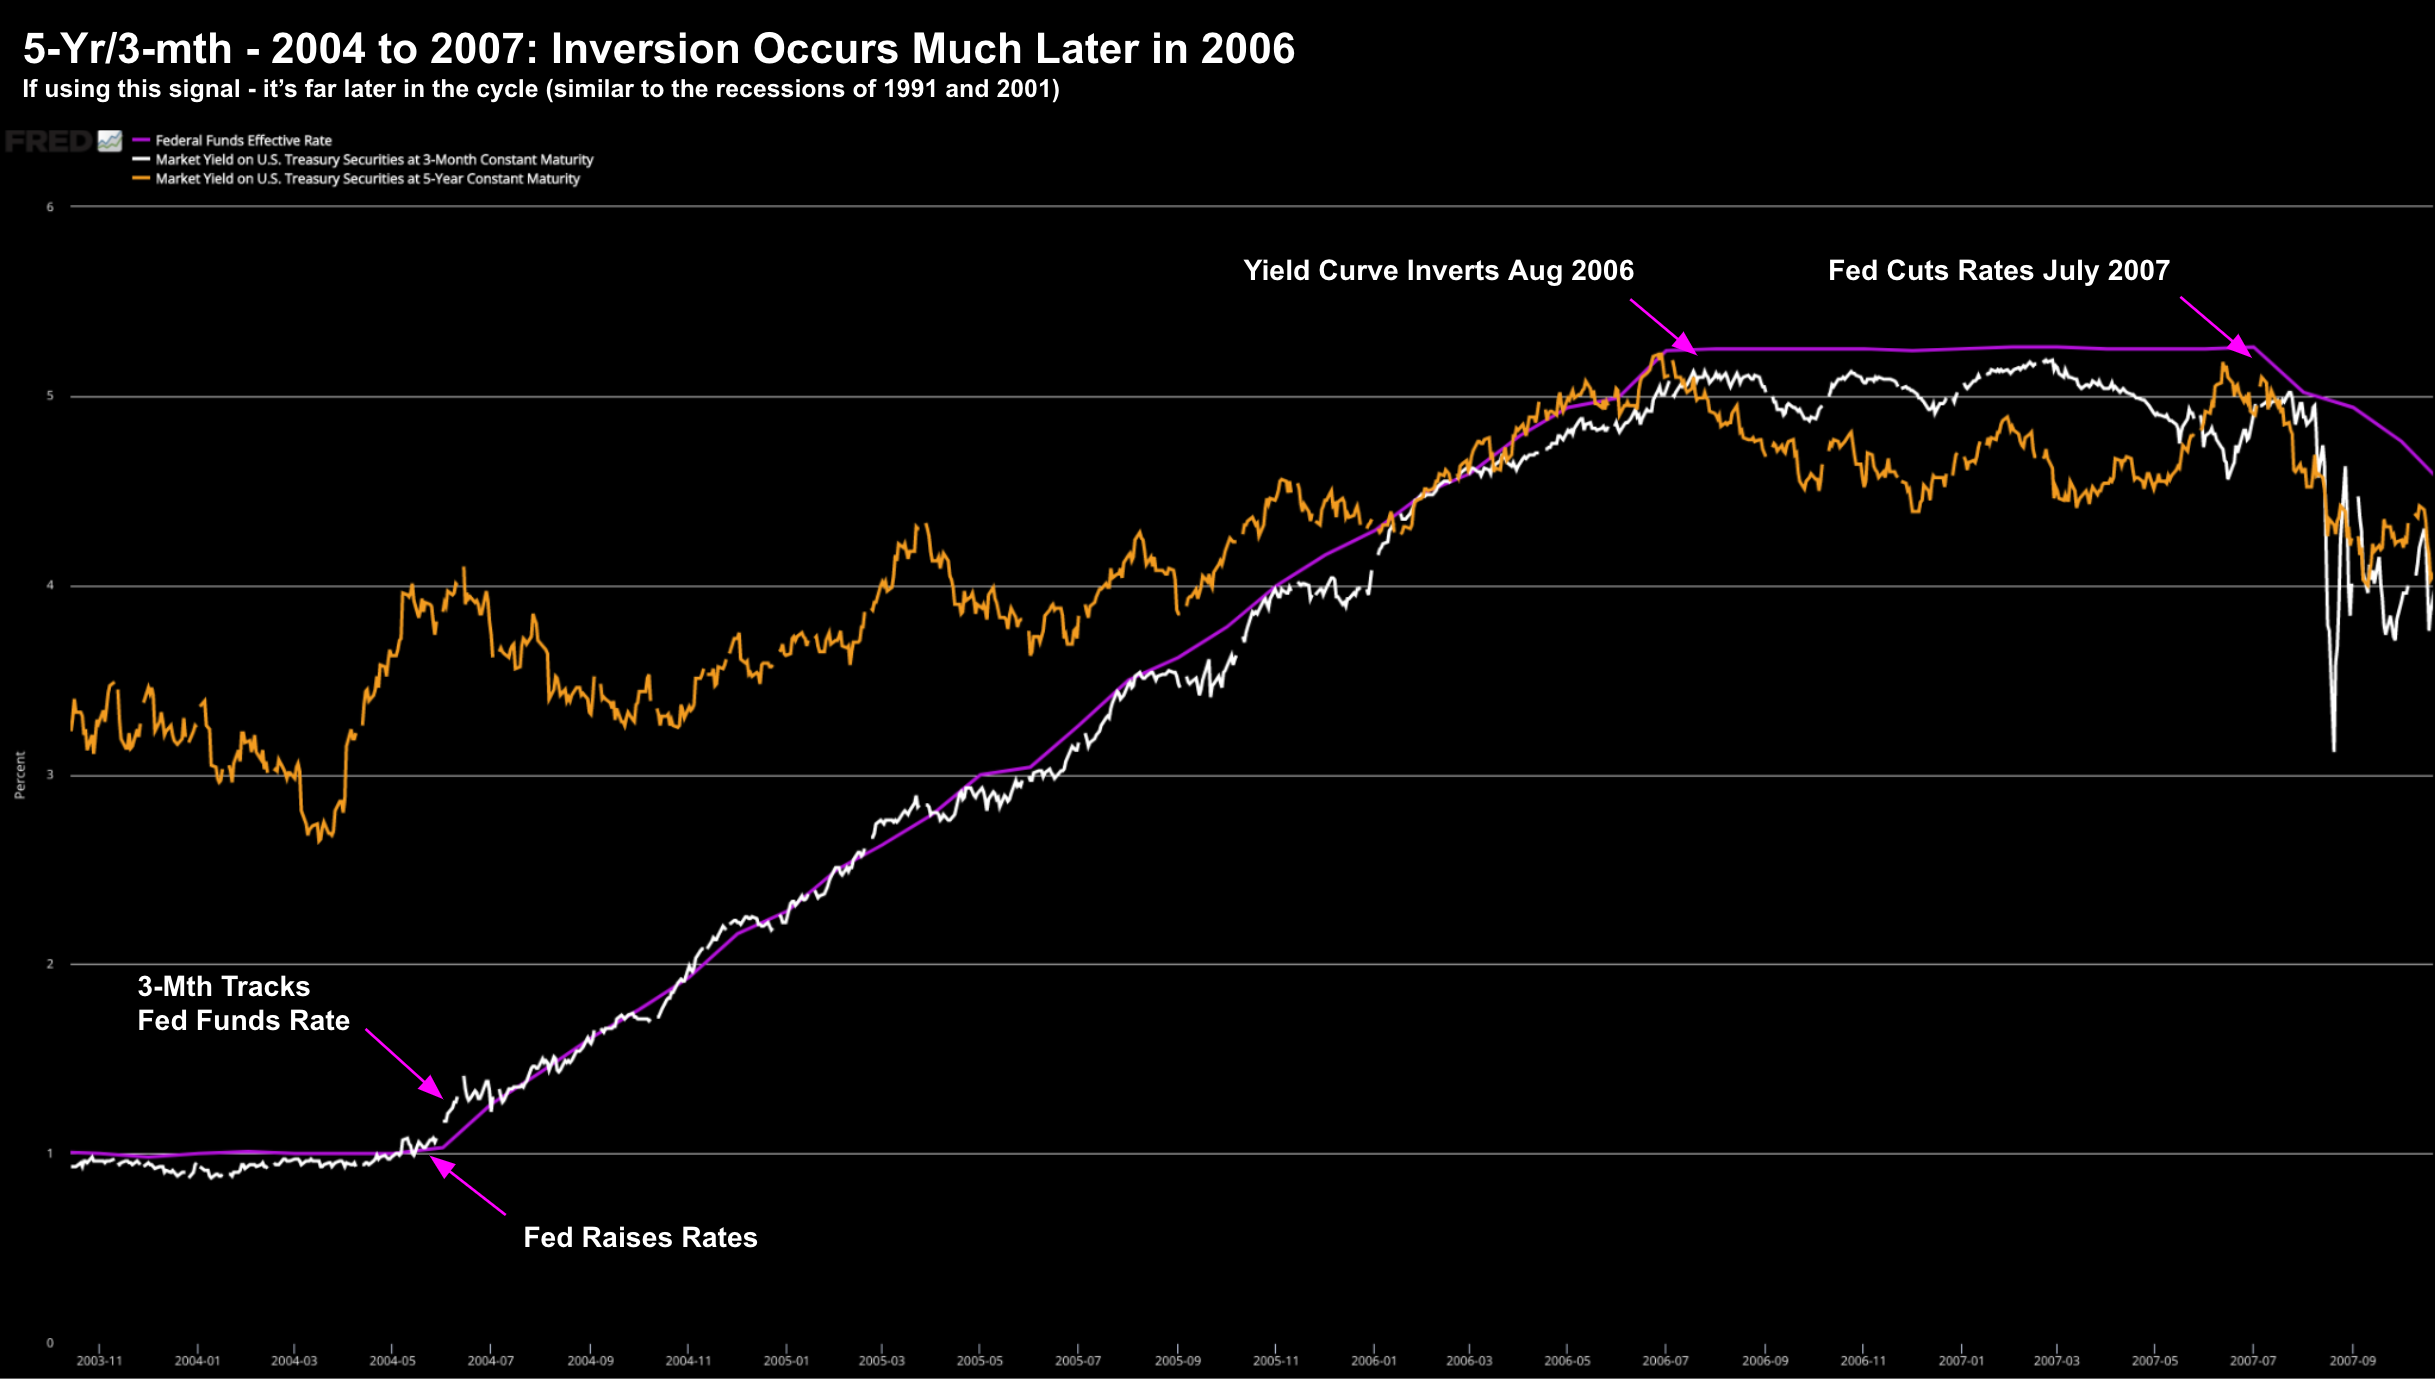
Now, let’s look at what we saw with the 5-year / 3-month inversion in the lead up to the recession of 2008?
Here we see how it occurred 6 months later in the cycle:
What’s the takeaway?
Whilst the 10s / 2s have been a very accurate predictor of recessions – we are looking at anything between a 12 and 24 month window
And that may suit your own investment timeframe to de-risk.
However, the 5-Yr / 3-Mth sends a signal much later in the cycle… closer to the recession itself.
In addition, it makes more sense to lean into the shorter maturity yield.
The reason is these are dominated by what the Fed is doing now and is widely expected to do over the near future.
However, if looking out at 5+ years… who knows what can happen (e.g. Russia, COVID and other black swans)
What to Make of This?
Whilst there’s a lot of mainstream noise around yield curve inversion (it’s deafening at times) – most of it can be ignored in the near-term.
Yes, it’s true that a flat or inverted yield curve almost always precedes a recession.
Sure…
But there are other (more) important factors which also need to happen.
For example, consider real rates of interest.
Surprisingly, very few in mainstream financial media mention this, but instead focus solely on nominal yields.
It’s misleading and not helpful.
Today real rates are deeply negative… with inflation around 8% and likely headed higher.
And this is what we should be focused on.
For example, if real yields were higher (e.g. 4% to 5%) – they would influence the borrowing and spending decisions of the economy a lot more.
Very high real rates encourage people to avoid borrowing and encourage saving.
In other words, money is more attractive (not trash like today)
What’s more, real high rates will lower consumption and growth (due to borrowing costs).
Today real yields / rates are as low as we have ever seen!
So what does this do?
You turn cash into trash. And you force investors further up the risk curve to get a return (e.g. stocks and property)
It’s the TRINA principle… There Really Is No Alternative.
Now you can sit in cash – sure – but it will be worth 8% less at the end of the year.
That’s risky.
Therefore, you are better to borrow and spend (i.e. what the Fed are forcing you to do)
And there is no better inflation hedge than stocks over the long run (in my view)
Therefore, until that equation starts to change; i.e., real rates begin to rise… why wouldn’t stocks continue to rally?
Putting it All Together
The chances of a recession at some point in 12 to 24 months have increased.
But I don’t see any near-term recession risk (certainly not this year).
I can’t rule it out towards the end of 2023… but not this year.
In the near-term – there are ample reasons as to why stocks can still appreciate further in a rising rate environment.
We have seen this in each lead up to the past three recessions.
With respect to the market today… there’s a lot of near-term froth.
The vicious rally the past three weeks is overdone.
We overshot on the way down (where I was buying); and we overshot on the way up.
That’s typical.
Now I’m not complaining… my portfolio is now in the green for the year (not a bad result for the quarter – I will take it).
Stocks like Google, Apple, Microsoft, Amazon, Meta, Nvidia and Shopify have all seen some solid gains recently.
That said, I’m a realist.
I think we will see some profit taking very soon… and perhaps as early as this week.
Repeating some comments from a post over the weekend…
If you own “low-to-no” earnings companies – trading at high revenue multiples (e.g. above 10x) – take this chance to reposition your portfolio.
These “Cathie Wood ARKK“ stocks caught a bid this week… but I’m willing to bet they correctly sharply very soon.


