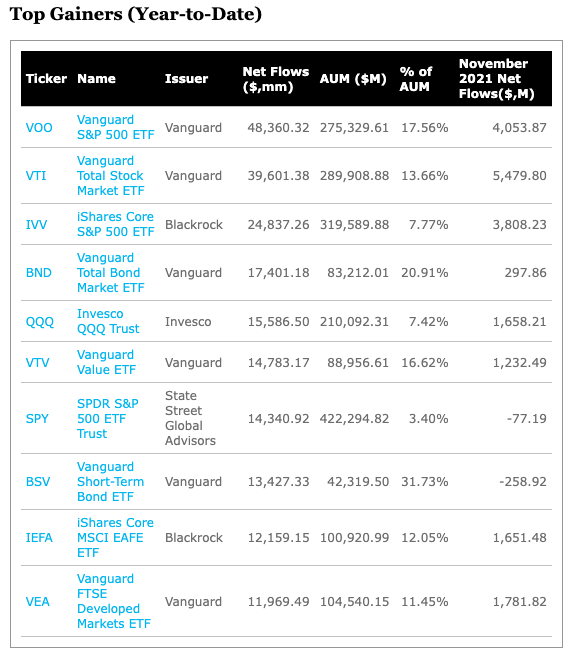
- $900B of ETF inflows for 2021 – smashing the $500B 2020 record
- Corporate Buybacks below 2019 levels but likely to rise
- What sectors will attract money in 2022?
Monday will mark the start of the so-called ‘Santa Claus’ rally.
But maybe Santa has come early?
The market looks like being up close to 2% this week… with tech stocks leading the way.
The Santa rally is said to occur over the last five trading days of December and the first two of January.
But is it really a thing?
Probabilities suggest it is. For example:
- 34 of the past 45 years (76%) has seen positive returns over these 7 trading sessions; and
- the average return is 1.40%
As I said the other day – look for a strong close to the year – which will see us lock in 20%+ returns.
But will this continue in 2022?
Record Year of Fund Inflows
When stock indices double their average rate of return in any one year (typically around 10%)… you need to ask why.
Two catalysts which come to mind are:
- negative real rates; combined with
- record amounts of central bank liquidity.
That is rocket fuel for stocks.
But all this new money has to find a home somewhere. For example, consider what we see with fund inflows to ETFs – as they desperately seek returns.
The U.S.-listed ETF industry added $74.2 billion in new assets for the month of November, approximately $3 billion off October’s mark, despite having the worst single-day trading session of the year so far.
According to ETF.com data provider FactSet, U.S. ETFs have garnered $799.8 billion in new assets year-to-date, and now manage $7.02 trillion in assets.
From mine, this is the torrent of liquidity driving the market higher.
Over 2020 and 2021 we’ve seen ~$1.4 Trillion in new money find a home in equities.
What’s more, BAML (Back of America Merrill Lynch) reported this week the past 4 weeks alone have shown the largest inflows all year.
Now this is particularly interesting.
For example, in recent weeks we’ve heard:
- The Fed are likely to hike rates at least three times next year;
- Fed’s balance sheet will flatten out (as they eliminate new bond purchases);
- The Federal Government being defeated on their ambitious $2 Trillion spending plan; and
- The Omicron COVID variant rapidly spreading across the world – threatening further shutdowns / slower growth
Despite what could be seen as headwinds… record amounts of funding continue to buy risk assets.
Again, faced with negative returns in cash and bonds… with inflation likely to average 4-5% next year (i.e., “Your Cash Really is Trash”)… investors have very few other alternatives.
Stock Buybacks to Add Fuel
Whilst record amounts of ETF fund inflows is a powerful source of demand… another force will be stock buybacks.
When companies use excess cash to reduce their floats – their shares are said to be worth more (as there are less of them).
What’s more, this also has the effect of boosting relative “earnings per share”.
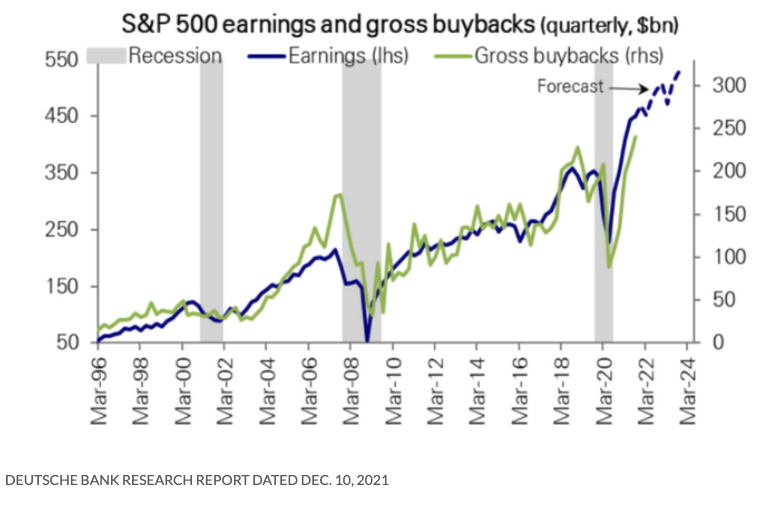
Now for 2021, corporate buybacks are likely to hit around $850B.
If this is the final figure – this will exceed the record $806 billion seen in 2018.
For example, according to Howard Silverblatt, senior index analyst with S&P Dow Jones Indices – companies in the S&P 500 index repurchased more than $234 billion worth of shares in the third quarter – topping the previous record set in the fourth quarter of 2018.
What’s more, this trend is expected to continue in 2022.
According to this MarketWatch article – Deutsche Bank analysts expect buyback volume to rise next year.
Their analysts wrote note dated Dec. 10 that “rising earnings should propel gross buybacks to a record trillion dollars in 2022″
The article adds:
Stock buybacks have been back on a tear, bouncing back after the COVID-19 crisis resulted in companies shutting down their share repurchase programs in 2020, as they sought to shore up cash amid lockdowns of business activity, according to Silverblatt. Buybacks totaled about $520 billion last year, he said.
If you put these two powerful forces together… it’s not hard to see what stocks continue to trajectory higher.
Where Money is Likely to Go
Recently I’ve shared how money has been rotating more into “value” over “growth”.
For example, companies with excessive multiples (which offer investors cash flows well into the future) are being traded for those which are more defensive.
But this framing can be nuanced this further into three distinct themes:
- Cyclicals – e.g., lower multiple, dividend payers, low rates of growth, predictable cash flows (e.g. energy, telco, financial, healthcare, industrials)
- Quality Growth – e.g., strong balance sheets and cash flows; proven earnings; low debt; 15-20% revenue growth – where multiples are ~20-30% higher than market averages; and
- Hyper Growth – e.g., companies that promise cash flows and earnings 5-10 years into the future w/excessive price-to-earning / revenue multiples
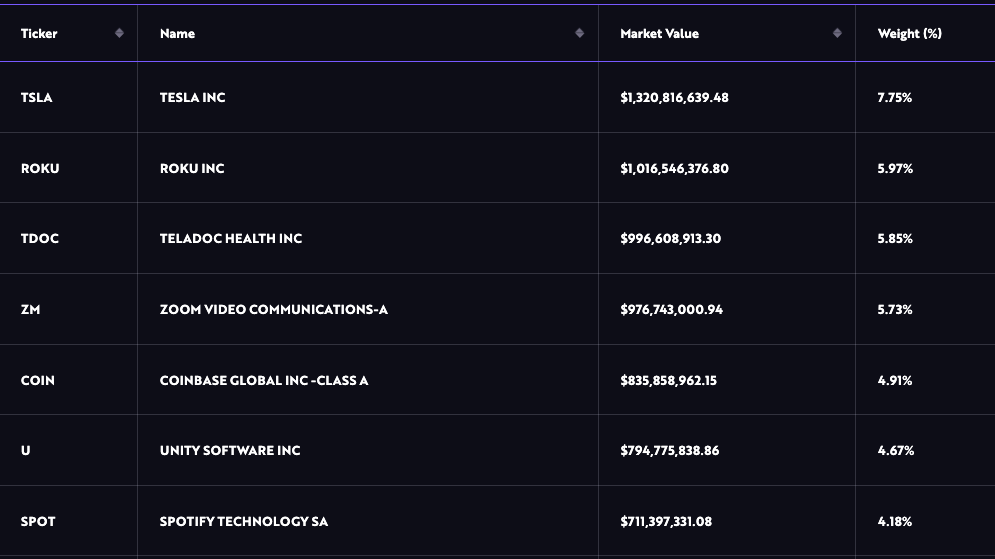
With respect to ‘hyper growth’ – my proxy here is the ETF ARKK (run by Cathie Wood). This (expensive) ETF is now 44% off its highs… and trending lower:
Dec 23 2021
Below are the fund’s top holdings – with Tesla at 7.75%
To be clear, some of these are great businesses with promise.
However, I cannot get onboard with holding most of these names heading into 2022.
In full disclosure, I own TSLA, however it is currently only ~2% of my fund — but I would not be a buyer above $700.
ARKK names are likely to face further selling next year in a higher-rate environment.
And whilst some of these “bets” could do very well in 5-10 years time (TSLA is probably the best bet) – that has to be your mindset if your looking to own these names.
More importantly, I think you can get them a lot cheaper than today.
But when it comes to stocks outside ‘FMAGA’ (i.e. quality growth and reasonable multiples) – look at names like (not certainly limited to):
- LLY (Healthcare)
- UNH (Healthcare)
- CHTR (Consumer Services)
- BAC (Finance)
- JPM (Finance)
- MU ** (Semiconductor) (recently added to – see here)
- PYPL (Payments) – (recently added to)
- DIS (Consumer Services) – (recently added to)
I own each of these.
And I recently added to three (MU, PYPL and DIS).
** With respect to Micron (MU) – Nov 18th I felt this stock could rise above $100 within the next two years.
Micron smashed earnings and revenue recently and surged from a low of $65 three weeks ago to around $94 today. And whilst it’s up 45% in 3 weeks… it’s forward PE ratio is still less than 10x. To me, that’s attractive for a company growing around 15%
Here’s the thing:
All of these names generate extremely strong cash flows and earnings. And each are market leaders in their respective fields.
And whilst I have a small stake in highly speculative (“future growth”) names like TSLA, CRM, SNOW and DASH – I ensure my capital exposure is limited.
Putting it All Together…
Earlier this week I said I remain bullish on quality names heading into 2022…
That’s still the case.
But we need to remain vigilant when it comes to managing risk.
As an aside, read about this here where I explain my preferred four key real-time financial indicators which tell me when risks are rising.
Today these risks are low.
For example, look at what we see corporate credit spreads below:
Corporate Debt Spreads Remain Historically Low
Highlighted is where the lower quality (higher yield) spreads rise above 5%.
Below at what we see on the S&P 500 when this occurs:
S&P 500: When Low Quality Debt Spreads Rise above 5%
The best two examples are what we saw in 1998 and 2007.
Corporate debt spreads were widening however the market had not yet cratered. Investors still had time to exit in an orderly fashion.
This was the time to lower your exposure… well ahead of the 2000 and 2008 near ‘50% collapse’.
We saw similar nerves July 2011, December 2015 and March 2020 (n.b. the pandemic was an anomaly in terms of immediate business closures / shutdowns etc).
Today credit spreads remain very low which suggests no imminent market crash.
However, when I see these spreads start to widen – I will look to meaningfully lower my exposure to risk assets.
For now, it’s “risk on”.
Wishing everyone a very safe and Merry Christmas.


