Words: 1,645 Time: 7 Minutes
- Market appears over-valued by several measures
- Tobin’s Q-Ratio now exceeds the level of the dot.com crash
- Ways to consider hedging your exposure
“The defensive investor should be satisfied with the gains shown on half his portfolio in a rising market, while in a severe decline he may derive much solace from reflecting how much better off he is than many of his more venturesome friends”
— Ben Graham “The Intelligent Investor“
By just about any intrinsic measure – the stock market looks expensive.
Ben Graham would be warning investors to heed caution.
The quote above was from Chapter 4 – where he discusses the defensive investors approach to portfolio allocation (more on this in my conclusion).
Now one of the more widely cited metrics is its forward price-to-earnings (PE) ratio.
For example, the S&P 500 is expected to earn around $275 per share next year – which assumes 11% year-over-year growth.
At the time of writing, the S&P 500 trades 6032 (a fresh record high this week)
6032 / $275 = 21.9x
However, the preceding 10-year average PE for the S&P 500 is ~18x.
Therefore, you might argue we are close to 4-turns too high on a multiple basis. And some might say more when you consider the 10-year yield now trades at ~4.2%
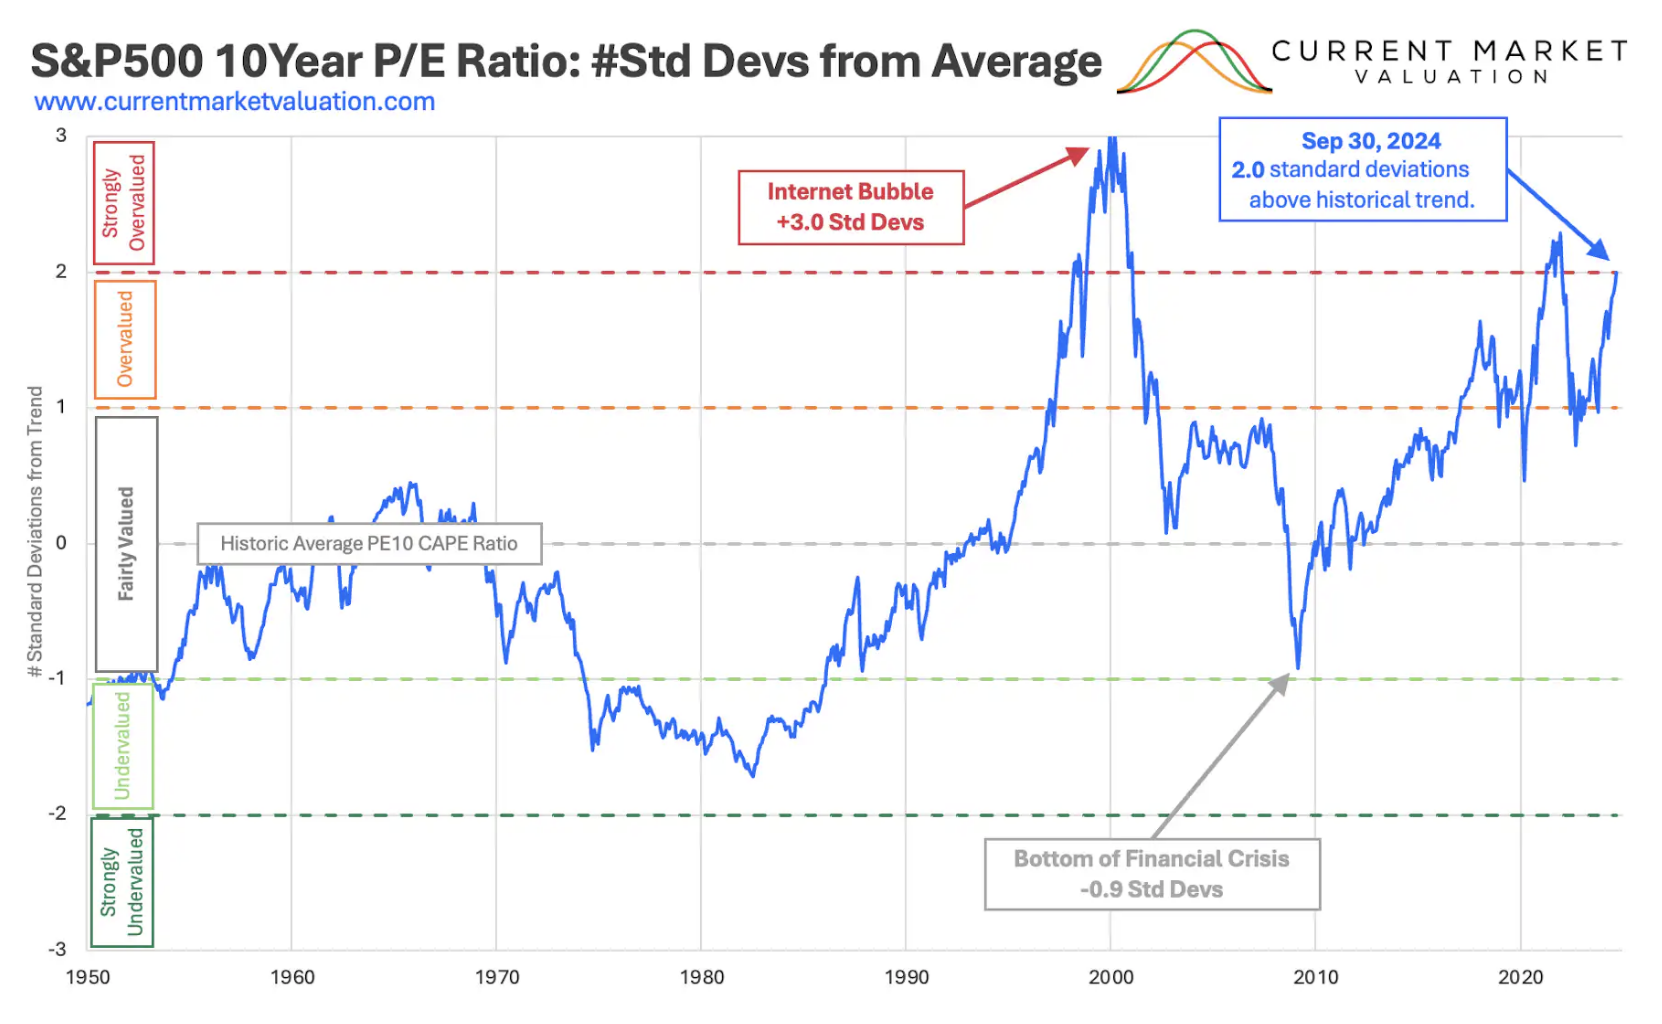
But with respect to PE ratios – based on this chart – as at Sept 30 (when the S&P 500 traded at 5743) – it was 2 standard deviations higher than ‘fair value’
But today we are not looking at PE ratios.
A far less cited measure of the market intrinsic value is James Tobin’s Q-Ratio.
From Investopedia:
The Q ratio, also known as Tobin’s Q, measures the relationship between market valuation and intrinsic value.
In other words, it estimates whether a business or market is overvalued or undervalued. The Q ratio is calculated by dividing the market value of a company by its assets’ replacement cost. Thus, equilibrium is when market value equals replacement cost.
And whilst the formula itself is simple to apply…. the calculation of replacement value can be laborious.
How do we calculate the replacement cost of all companies listed on the S&P 500?
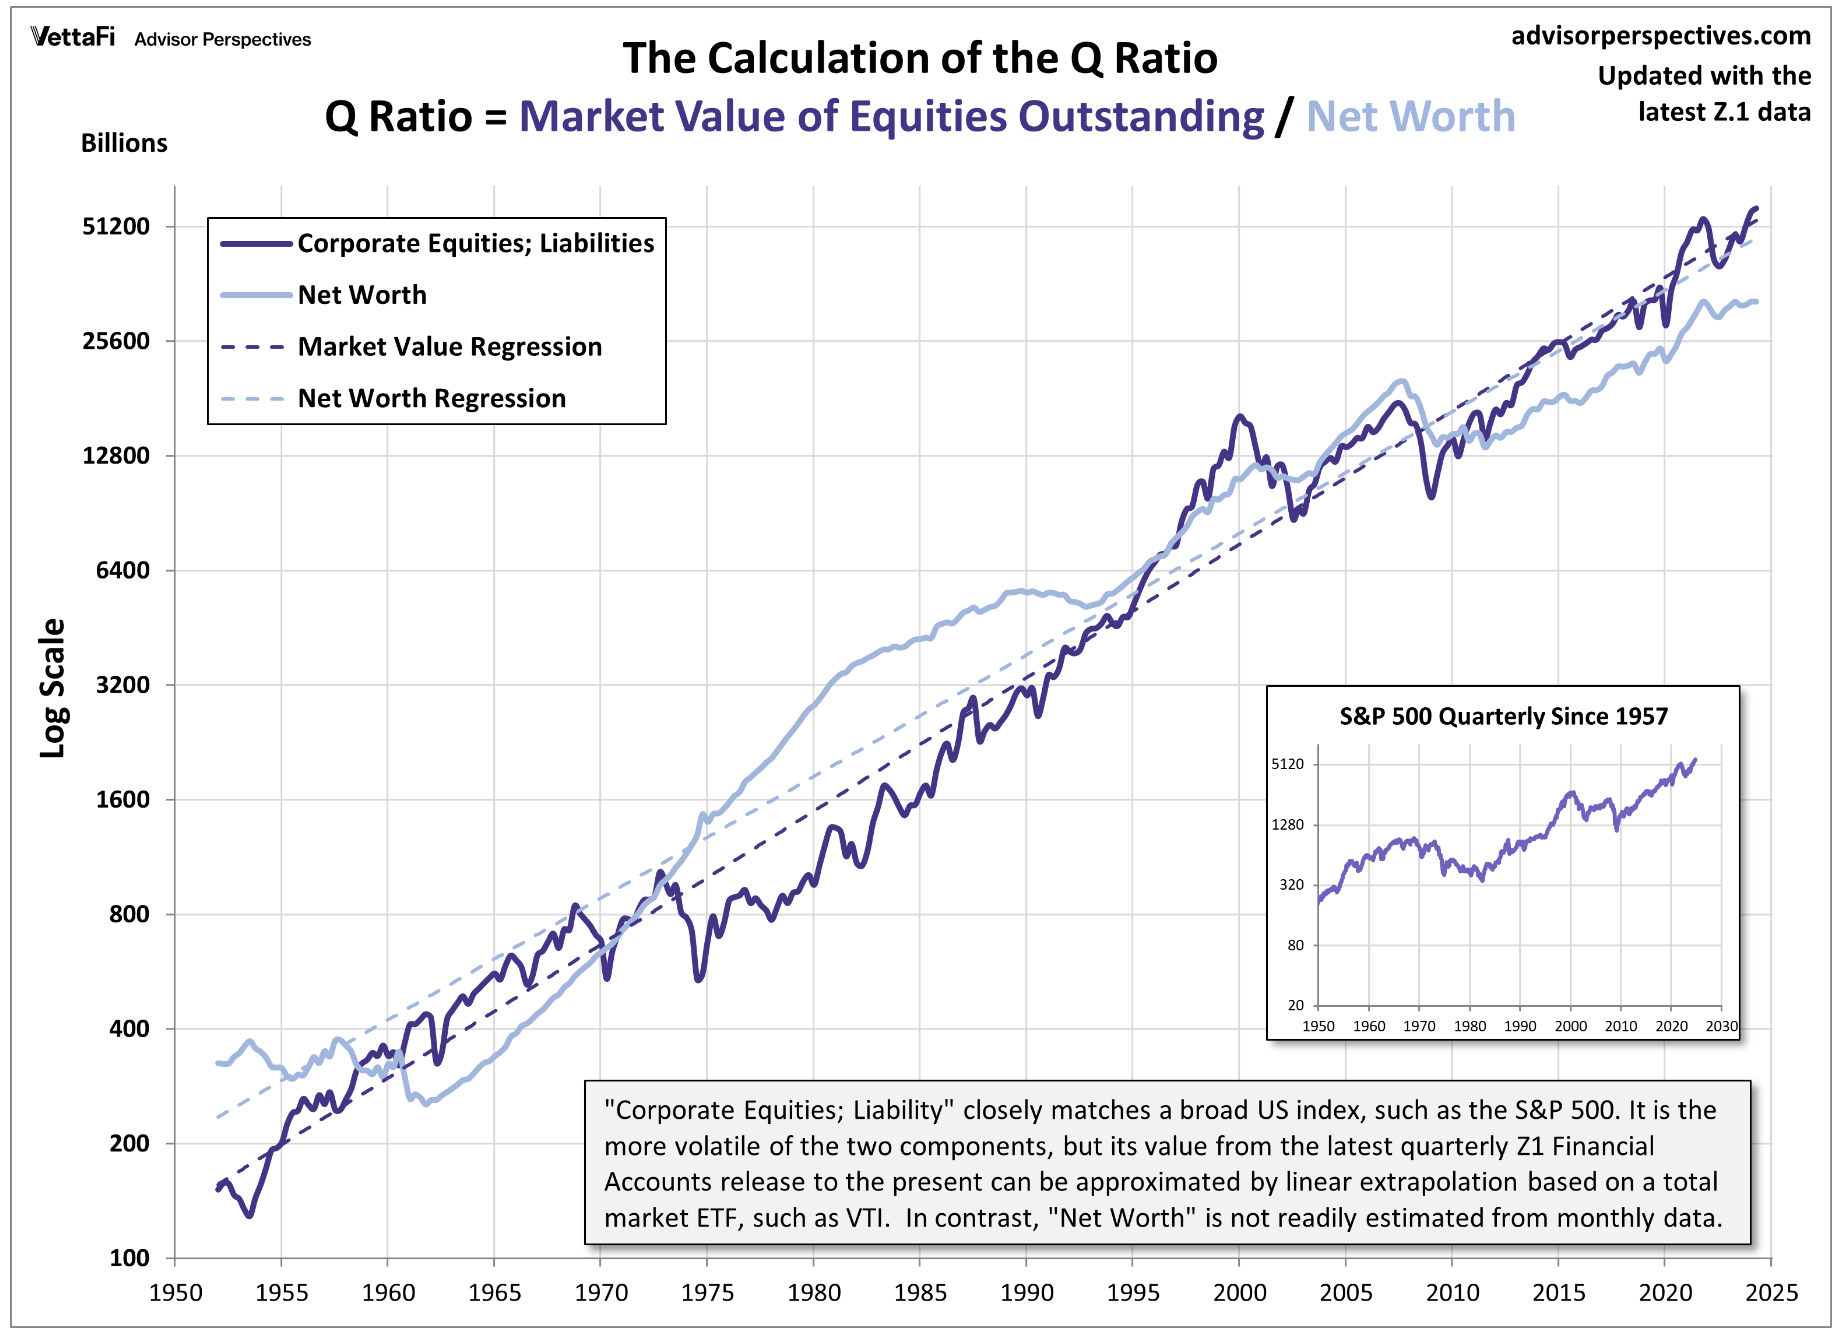
Fortunately, the Fed does much of the work for us – as part of their Z.1 Financial Accounts of the United States.
Let’s take a look…
Q-Ratio Issues Caution
James Tobin of Yale University, Nobel laureate in economics, hypothesized that the combined market value of all the companies on the stock market should be about equal to their replacement costs.
However, as we know, very rarely is that the case. The interpretation of the ratio is as follows:
- A low Q ratio—between 0 and 1—means that the cost to replace a firm’s assets is greater than the value of its stock (i.e., undervalued)
- A high Q ratio – greater than 1 – implies that a firm’s stock is more expensive than the replacement cost of its assets (i.e., overvalued)
Now it might seem logical that fair market value would be a Q ratio of 1.0.
Again, rarely does the market trade at this value.
Prior to 1995 (for data as far back as 1945) the U.S. Q ratio never reached 1.0.
During the first quarter of 2000, the Q ratio hit 2.15, while in the first quarter of 2009 it was 0.66. As of the second quarter of 2020, the Q ratio was 2.12
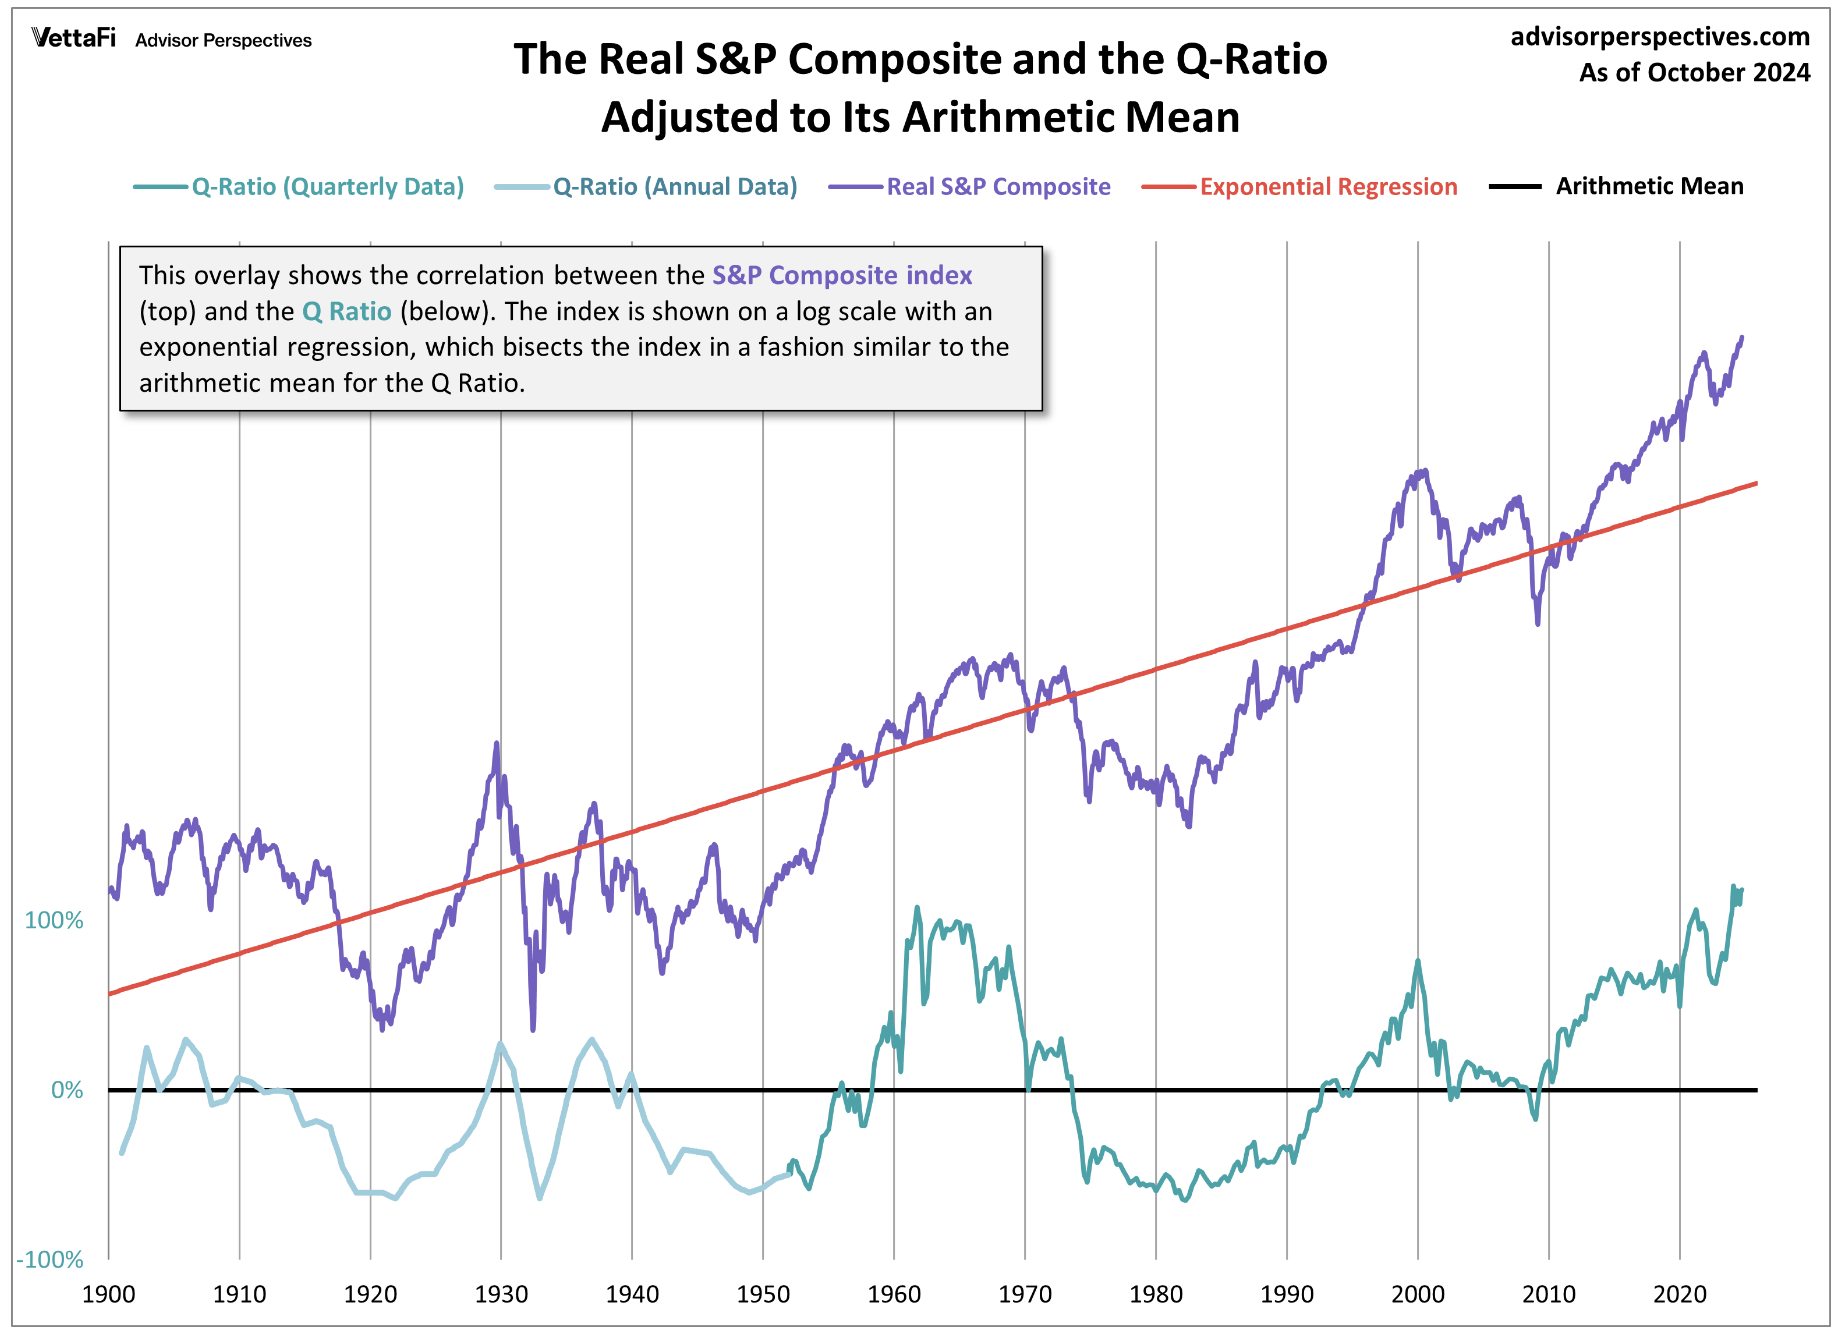
Thanks to Jennifer Nash at advisorperspectives – she’s updated the Q-ratio based on the Fed’s data (current to October 2024):

Not unlike our historical PE ratio – the Q-Ratio is also approaching the third standard deviation range outside the (100-year) arithmetic mean.
Nash states:
The average (arithmetic mean) Q ratio is about 0.83. The chart above shows the Q ratio relative to its arithmetic mean of 1 (i.e., divided the ratio data points by the average).
This gives a more intuitive sense to the numbers. For example, the Q-ratio reached its all-time high of 1.80 in February 2024, suggesting that the market price was 118% above the historic average of replacement cost.
The all-time low in 1982 was 0.29, which is approximately 65% below replacement cost.
Q-Ratio Relative to the S&P 500
The problem with the Q-ratio (like almost every other valuation measure) is it’s not a good timing tool.
As we know, markets can remain over-and under-valued for several years.
However, I will offer readers a hedging strategy to address this (timing) risk below.
But first, here’s Nash on the issue:
Periods of over-and under-valuation can last for many years at a time, so the Q ratio is not a useful indicator for short-term investment timelines.
This metric is more appropriate for formulating expectations for long-term market performance.
As we can see in the next chart, peaks in the Q ratio are correlated with secular market tops – the tech bubble peak and current market values being extreme outliers
As we can see, investors were wise to add exposure when the Q-ratio fell below zero.
Similar, investors were prudent to reduce exposure as the ratio exceeded 1 (despite being potentially early by a year or two)
The final chart offered from Nash is an overlay of the two since the inception of quarterly Z.1 updates in 1952.
She states there is an obvious similarity between the Fed’s estimate of “Corporate Equities; Liabilities” and a broad market index, such as the S&P 500 or VTI.
From mine, when we find the Q ratio exceed 1.0 – we should be prepared for an expected drawdown of ~20%.
Now I don’t pretend to know if it will be “next week” or in “~6 months” – but those odds of a correction are increasing.
What’s more, the probabilities of a larger than 20% correction also increase as we move further from the 100-year arithmetic mean.
So How Do You Hedge?
The first thing to consider would be reducing your exposure to equities (as I have done).
Again, I would recommend revisiting my summary of Chapter 4 of ‘The Intelligent Investor’.
Case in point:
Warren Buffett is now sitting in over $325B of cash. Never has his cash hoard been this high (either as a percentage of his portfolio or nominal terms).
From Yahoo! Finance:
This marks the eighth consecutive quarter of Berkshire acting as a net seller, meaning they’re unloading stocks faster than picking them up.
Bank of America, a staple in the portfolio, was also cut loose to the tune of over $10 billion since July. Buffett’s been known to keep buying Berkshire stock whenever he sees a deal, but for the first time in six years, buybacks were nowhere in sight.
That tells us something big: even Buffett sees his own stock as pricey right now.
The other option is to consider is buying puts against the Index (e.g., the SPY).
For those less familiar with trading options – buying puts act just like insurance.
99% of the time they will expire worthless.
For example, not unlike insurance we purchase annually for our health, house, car etc – hopefully you never need it.
However, should disaster strike – you’re glad you have it.
A put option works the same way.
Now if you’re of the view:
- The market is extended – prone to a 10-20% pullback; however
- You’re not sure of the timing (but feel the probability is high the next 12 months)
- Purchase 2-month 0.5 delta puts on the SPY (~30% out-of-the-money in the case of a 40% implied volatility (IV) – close to the historical avg (IV));
- After every month – the 2-month put option position is rolled (i.e., the existing options are sold; and new 2-month puts are purchased); and
- Allocate 0.5% of your portfolio to the 2-month put option – and the balance (99.5%) stays invested in the S&P 500 Index
A delta of 0.5 means that for every $1 change in the underlying asset’s price – the put option’s price is expected to change by $0.50 in the same direction.
In other words, you get tremendous leverage.
So how would this work in real terms?
Let’s say the SPY trades 620 and you buy 2-month Jan 31 SPY 435 strike (~30% out-of-the-money) for ~45c
Pricing Current Nov 29 2024
If S&P 500 were to fall ~20% in ~30 days – the Jan 31 SPY put option would increase by ~1,200% (pending any changes in IV)
However, let’s say the SPY only dropped ~8% in 30 days (to ~550) – a long way above our strike of 435.
At this time, we would roll the option for another 2-months (again, ensuring the new March strike is 30% out-of-the-money) – where the existing option would be near breakeven or trade at a small loss.
However, the more out-of-the-money the underlying is relative to the Jan strike price of 435 – the greater the loss. Its very likely your existing put option will have very little value.
This strategy is designed to capture a very large move to the downside. Two things to consider:
- You’re willing to take many small losses (i..e, you’re only risking 0.5% of your total portfolio each month; or 6% over a year); and
- You’ll capitalize with an outsized gain should the market correct sharply.
However, if you don’t think the market is likely to correct – this strategy is not for you.
💥 Putting it All Together
With respect to Tobin’s Q-Ratio – it’s not intended to be a great timing indicator.
For example, the market could easily continue to trade higher over the coming months.
It has a lot of momentum and there are few catalysts to see it fall.
However, not unlike Shiller’s CAPE Ratio and Buffett’s total market capitalization-to-gross national product measure – it has a solid history of predicting secular (long-term) highs.
Therefore, you should ask yourself how you hedge this potential risk?
For me, it’s a combination of two things:
(a) reducing my equity exposure to ~65% (which is similar to Buffett’s current exposure); and
(b) a rolling put strategy with a very small (0.5%) portion of my portfolio each month.
It’s most likely I will continue to take very small losses on these rolling puts over several months.
However, if the S&P 500 continues to rise, I enjoy those gains with my long exposure.
But that’s how the strategy is intended to work.
It’s not designed to know the timing.
However, it will only take one month where we see a sharp 10% to 20% pullback – and the strategy more than pays for itself.
Trade safe…


