Words: 2,225 Time: 9-10 Minutes
- How many institutions forecast 2024 correctly?
- Further price appreciation needs to come from earnings growth
- A timely lesson in risk management
Over the past few weeks I’ve been re-reading “The Intelligent Investor” by Benjamin Graham.
Warren Buffett called it “by far the best book on investing ever written” – crediting Graham with laying the foundation for his entire investment philosophy.
There are many reasons why this text deserves a permanent fixture on your (investing) bookshelf:
1. Timeless wisdom: Graham’s principles have stood the test of time – as relevant today as they were 70 years ago (as I’ll demonstrate below);
2. Importance of Fundamentals: Over time, the value of stock will be a function of its earnings. However, in the short-term (e.g., less than 3 years) there’s very little correlation. This is why Graham emphasizes remaining focused on fundamental analysis (e.g.. balance sheets, cash flows, profit ratios) and value investing (vs simply following the herd); and finally
3. Emotional discipline: Controlling your emotions (e.g., fear and greed); and avoiding impulsive decisions are crucial for long-term success.
For those less familiar with financial markets – it might be a challenging first-time read.
But the principles put forward are essential for long-term success.
Given this, last month I gave myself the task of simplifying the book as a series of 20 posts comprising 1,000 and 1,500 words – each designed to be read in 5-7 minutes.
More than this, my goal was to write it in a language anyone could understand – enabled with personal investing examples with updated charts.
Stay tuned for when I make this 20-part series available…
As I find myself going back through the book – it seemed more relevant than ever.
For example, today the market trades at 22x its forward earnings (estimated at $270 per share for the S&P 500)
Investor enthusiasm is as high as we’ve seen in ~25 years.
But as history suggests – a forward PE above 20x comes with elevated risk.
I’ll share some charts shortly…
In short, the more you pay for something – the further it can fall.
 Defying Expectations
The S&P 500’s record-breaking performance has surprised even the most optimistic forecasters.
By way of example, below are 18 institutional forecasts made in January this year as to where they believed the S&P 500 would finish the year.
| Company | 2024 F’Cast | % Error |
|---|---|---|
| BCA Research | 3300 | 77.3% |
| Cantor Fitzgerald | 4400 | 33.0% |
| Scotia Bank | 4425 | 32.2% |
| Wells Fargo | 4700 | 24.5% |
| Raymond James | 4650 | 25.8% |
| JP Morgan | 4200 | 39.3% |
| Morgan Stanley | 4500 | 30.0% |
| Stiffel | 4650 | 25.8% |
| Ned Davis | 4900 | 19.4% |
| BoA | 5000 | 17.0% |
| RBC | 5000 | 17.0% |
| Federated Hermes | 5000 | 17.0% |
| Goldman Sachs | 5100 | 14.7% |
| Deutsche Bank | 5100 | 14.7% |
| BMO | 5100 | 14.7% |
| Fundstrat | 5200 | 12.5% |
| Oppenheimer | 5200 | 12.5% |
| Yardeni | 5400 | 8.3% |
Incredibly, BCA Research was wrong by 77%
JP Morgan was out by 40%!
Remember: these guys are the ‘experts’ – paid to manage your money. It’s all they do!
As an aside, Ed Yardini is shaping up as the likely winner – still shy by ~8.3% with two months to go.
If nothing else it only reinforces (to me) the folly of market forecasting.
I call it a fool’s errand… but it won’t stop them trying.
As for myself, I’ve remained cautiously invested all year with about 65% of my equity (the balance in bonds and money market accounts).
I’ve felt this was the right risk/reward balance – however with the Mag 7 surging higher – it meant underperformance.
This has seen me realize gains of ~9.0% YTD.
One of the major themes in Graham’s book is investors aiming for adequate and sustainable returns.
However, the definition of “adequate” and “sustainable” will be determined by you.
From me, that is a number between “8% to 15%” (pending conditions)
However, if you’re Warren Buffett, his sustained average over 58 years is 19.2% (I know of none better over this timeframe)
Now over the past ~15 years – the S&P 500’s total return has averaged ~14%.
That well above the long-running (100-year) average of ~10.2% (inclusive of dividends)
But what have we seen the past two years?
Year-to-date the S&P 500 is up ~21%; and last year it was up ~25%
However I understand why many participants remain exuberant. I outlined a few reasons over the weekend:
- Economic Resilience: The US economy has defied recession fears as inflation fears ease;
- Consumers: A strong labor market with rising wages – enabling consumers to keep spending;
- Central Bank Easing: The Fed Reserve (and many other central banks) have started easing cycles;
- AI Excitement: The transformative potential of AI has ignited investor enthusiasm (similar to the internet during the late 90s) – driving up valuations; and
- Political Expectations: Anticipation of “red wave” and a Trump presidency is boosting market confidence (i.e., lower taxes and regulations).
What’s more, we’ve also seen a significant shift in capital flow from bonds to equities.
This suggests more investors are willing to take on more risk as stocks climb.
 The Defensive Investor’s Dilemma
In Chapter 4 of Graham’s book – he talks to the “Defensive Investors Portfolio Allocation”
Graham’s recommendation for defensive investors is 50/50 split between high quality bonds and equities.
However, he adds this is subject to the individual’s appetite towards risk and relative stage in life.
For example, the older one gets, the more defensive they should be.
Graham recognizes that it can be difficult to achieve this ‘defensive balance’ when markets are wildly bullish (mostly due to investor’s fear of missing out).
Here’s a snippet from my summary of Chapter 4:
Graham believes for most investors, a straightforward 50-50 allocation between bonds and stocks may be the most practical approach.
This strategy involves periodically rebalancing the portfolio to maintain the desired allocation.
For example, if the stock component rises to 55% (e.g. due to rising prices) – selling a portion of the stocks and reinvesting the proceeds in bonds can restore the balance. Conversely, if the stock allocation falls to 45%, buying additional stocks using a portion of the bond holdings can rebalance the portfolio.
Graham mentions that Yale University followed a similar approach for several years; it eventually abandoned its fixed allocation strategy in favor of a more equity-focused portfolio – taking on more risk.
This illustrates the challenges of adhering to a mechanical approach in the face of prolonged market uptrends.
In these prolonged bull markets situations, investors will feel they are ‘missing out’ on outsized gains.
Nonetheless, Graham believes the 50-50 formula offers a sensible and straightforward approach for the defensive investor. It provides a sense of control, limits excessive exposure to equities, and offers a balanced approach to risk and return.
As an aside, a popular strategy today is a 60/40 balance. To go deeper – Vanguard explains how you can implement this risk averse strategy.
 Valuations and Concentration Risk
With the market trading at ~22x forward earnings – further price appreciation is unlikely to come from multiple expansion.
That’s not to say it couldn’t – however it’s getting more difficult.
Therefore, meaningful price appreciation will need to come from strong earnings growth.
And whilst strong double-digit growth is still possible (with the market pricing in 11% YoY) – it’s not without risk.
However, most of this will likely come from the Mag 7 – which comprise an unhealthy ~35% of the total market capitalization.
Failure to meet growth expectations will result in a swift revision lower.
For example, applying a multiple of 19x (which is still greater than the long-term average) – this puts the S&P 500 at 5130 (assuming it will still deliver $270 in earnings per share).
That would imply a ~12% correction.
However, we can take valuations further using a couple of popular metrics provided by Graham (and others who have adopted his approach)
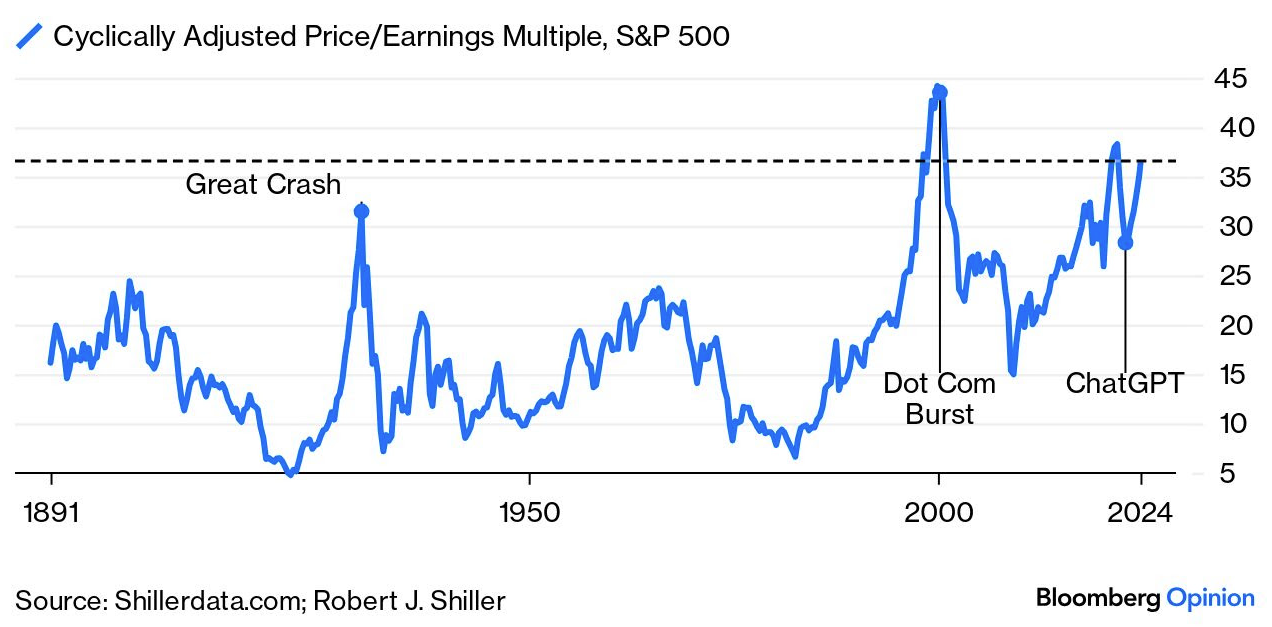
- CAPE Ratio: Graham first introduced the idea of Cyclically Adjusted Price/Earnings (CAPE) ratio – which was then popularized by Robert Shiller with his book Irrational Exuberance). The ratio is a widely followed measure of long-term value – which seeks to smooth out the peaks and troughs of the business cycle over 10 years – whilst adjusting for inflation. To get the ratio – we take the price and divide by the average earnings over the previous 10 years.
Today the ratio suggests the S&P 500 is historically expensive, exceeding levels seen before major market crashes (see below)
From Bloomberg Opinion’s John Authers:
There are reasons why the CAPE would rise over time, as profitability and productivity grow.
But it’s disconcerting that the S&P is more expensive than on the eve of the Great Crash in 1929, and not much cheaper than when the dot-com bubble burst in early 2000.
Perhaps more importantly, after the CAPE made big peaks in the past, it descended dramatically for a number of years.
Not so this time, with CAPE peaking in the 2021 post-Covid boom, but bouncing late in 2022.
Coincidentally or not, that bounce coincided exactly with the launch of ChatGPT. The AI boom seems to be performing a Herculean task in keeping the market high.
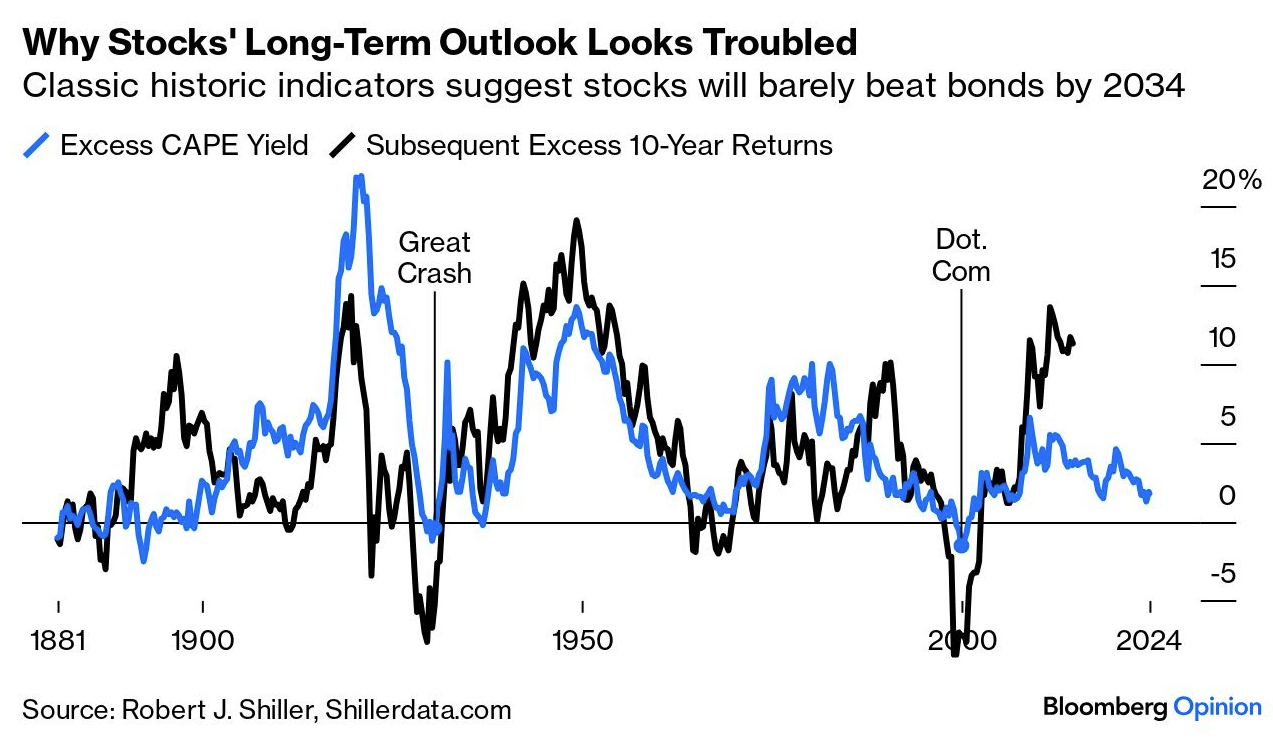
The other metric we should not ignore is comparing stock valuations to the risk free rate of return (i.e., bond yields).
This suggests that stocks are unlikely to outperform bonds in the long run, despite their recent exceptional returns.
This chart subtracts the 10-year Treasury yield (around 4.2% at the time of writing) from the CAPE Yield (the inverse of the main metric).
The lower the excess yield you get from stocks, the less well they do subsequently relative to bonds.
For example, if we invert today’s forward PE ratio of 22x – we get 4.5%.
This is a mere 0.3% higher than the risk free 10-year yield of 4.2% (echoing the paltry Excess CAPE yield)
Based on Bloomberg’s chart – if buying stocks when the ‘Excess CAPE yield’ is near zero – it’s proven to be a poor return in the years to follow.
- ~1929 – led to ~20 years of below average returns
- ~1972 – led to a decade of lost returns; and again
- ~2000 – led to ~9 years of sub-optimal returns
The question is whether this lies ahead if paying the current multiple for stocks (with basically zero equity risk premium)?
 Another Perspective
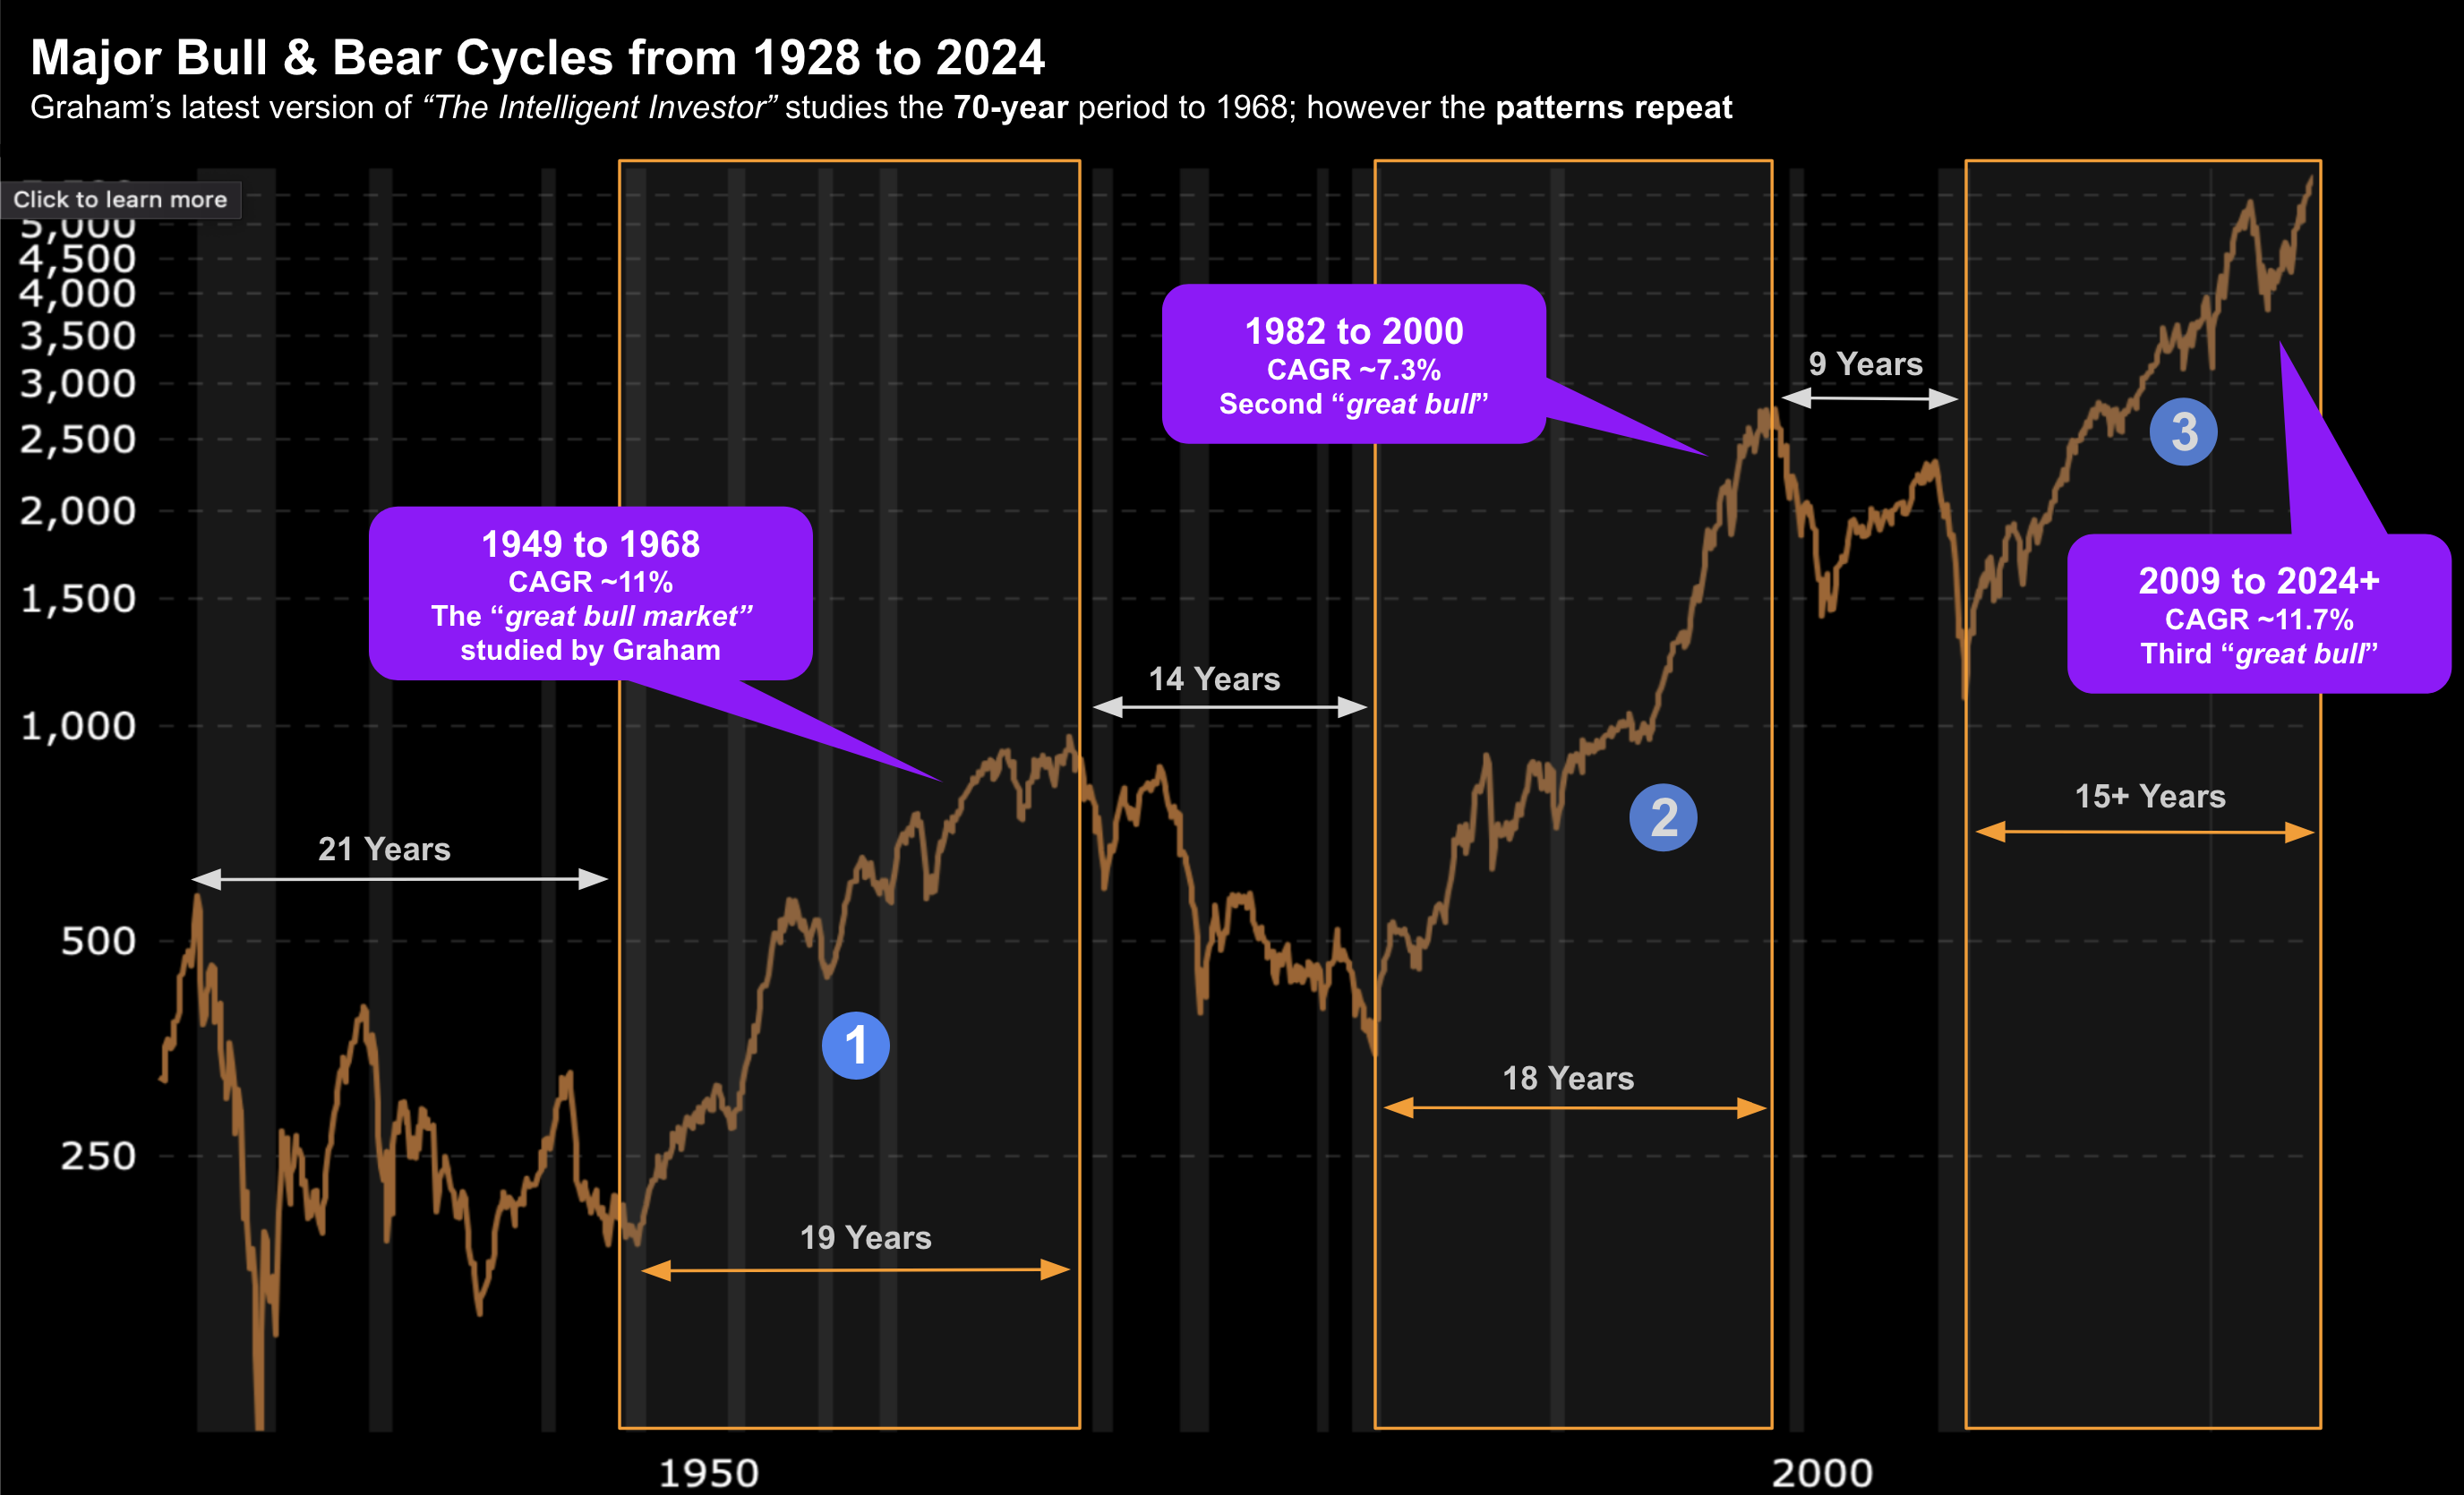
As part of my summarizing Graham’s seminal work – I created this 100-year chart showing the three major bull and bear markets.
This allows us to visualize:
(a) Average CAGR for the S&P 500 during bull markets; and
(b) the average duration for each bull and bear
The three great bull markets (as I defined them) occurred between:
- 1949 to 1968 – 19 years – CAGR of ~11%
- 1982 to 2000 – 18 years – CAGR of ~7.3%
- 2009 to 2024* – 15 years (in process) – CAGR ~11.7%
The average bull market is ~11% – despite numerous “10-20%” pullbacks along the way.
The question is whether 2024/25 is nearing the “final innings” of this epic third bull?
For example, when Graham published the fourth (and final) revision of the book (1972) – he warned of excessive valuations.
And whilst he highlighted that in the near-term equities could run further (it turns out they didn’t) – he felt it was prudent to reduce risk.
This was a terrific call – as stocks sank from 1968 through to 1982.
Unfortunately only hindsight will tell us whether 2025 will be similar to what we saw during the melt-ups into 1968 and 2000?
 Goldman Warns of a Possible ‘Lost Decade’
September 24th, Goldman’s Chief US equity strategist David Kostin raised his year-end S&P forecast from 5,600 to 6,000.
Now that’s also a long way from his 5100 target he offered in January… but we won’t go there
What was more interesting (to me) was his 2025 forecast of 6,300.
If Kostin is right (and I have no reason to trust it!) – that would imply 7.6% upside from today’s close.
In other words, he doesn’t think the gains are sustainable.
But it gets more interesting….
Kostin warned of the decade to follow…
He expects the S&P 500 to gain 3% in nominal terms (1% in real terms) per year over the next decade.
How anyone can lay out a forecast for the next 10-years (let alone 12 months!) – I will never know.
But I do see the logic behind a potential decade of sub-par returns (and/or higher yields) based on Graham’s work.
And if 140-year CAPE Ratio chart is any indication – it would be remiss of investors to not play some defense.
 What Matters to Investors
Post 2009, investors have been blessed with one of the greatest bull markets of the past 100 years – averaging a total return of 14% per year.
What’s more, we were treated with some of the lowest interest rates in history.
And I hope it’s been rewarding for you…
However, I don’t think that’s what investors should expect in the decade to follow.
It will require a far more defensive strategy.
For example, my view is bond yields will be meaningful higher (largely due to greater deficits and debts) – where equity returns will be lower.
In closing, Benjamin Graham taught me three things:
- Above all else, investing is about protecting your capital;
- Investors should strive to pursue adequate and sustainable gains; and
- It requires overcoming self-defeating behaviors (e.g., fear, greed and bias)


