- Economic data deviates from expectations
- Manufacturing sector lacking incentives to invest
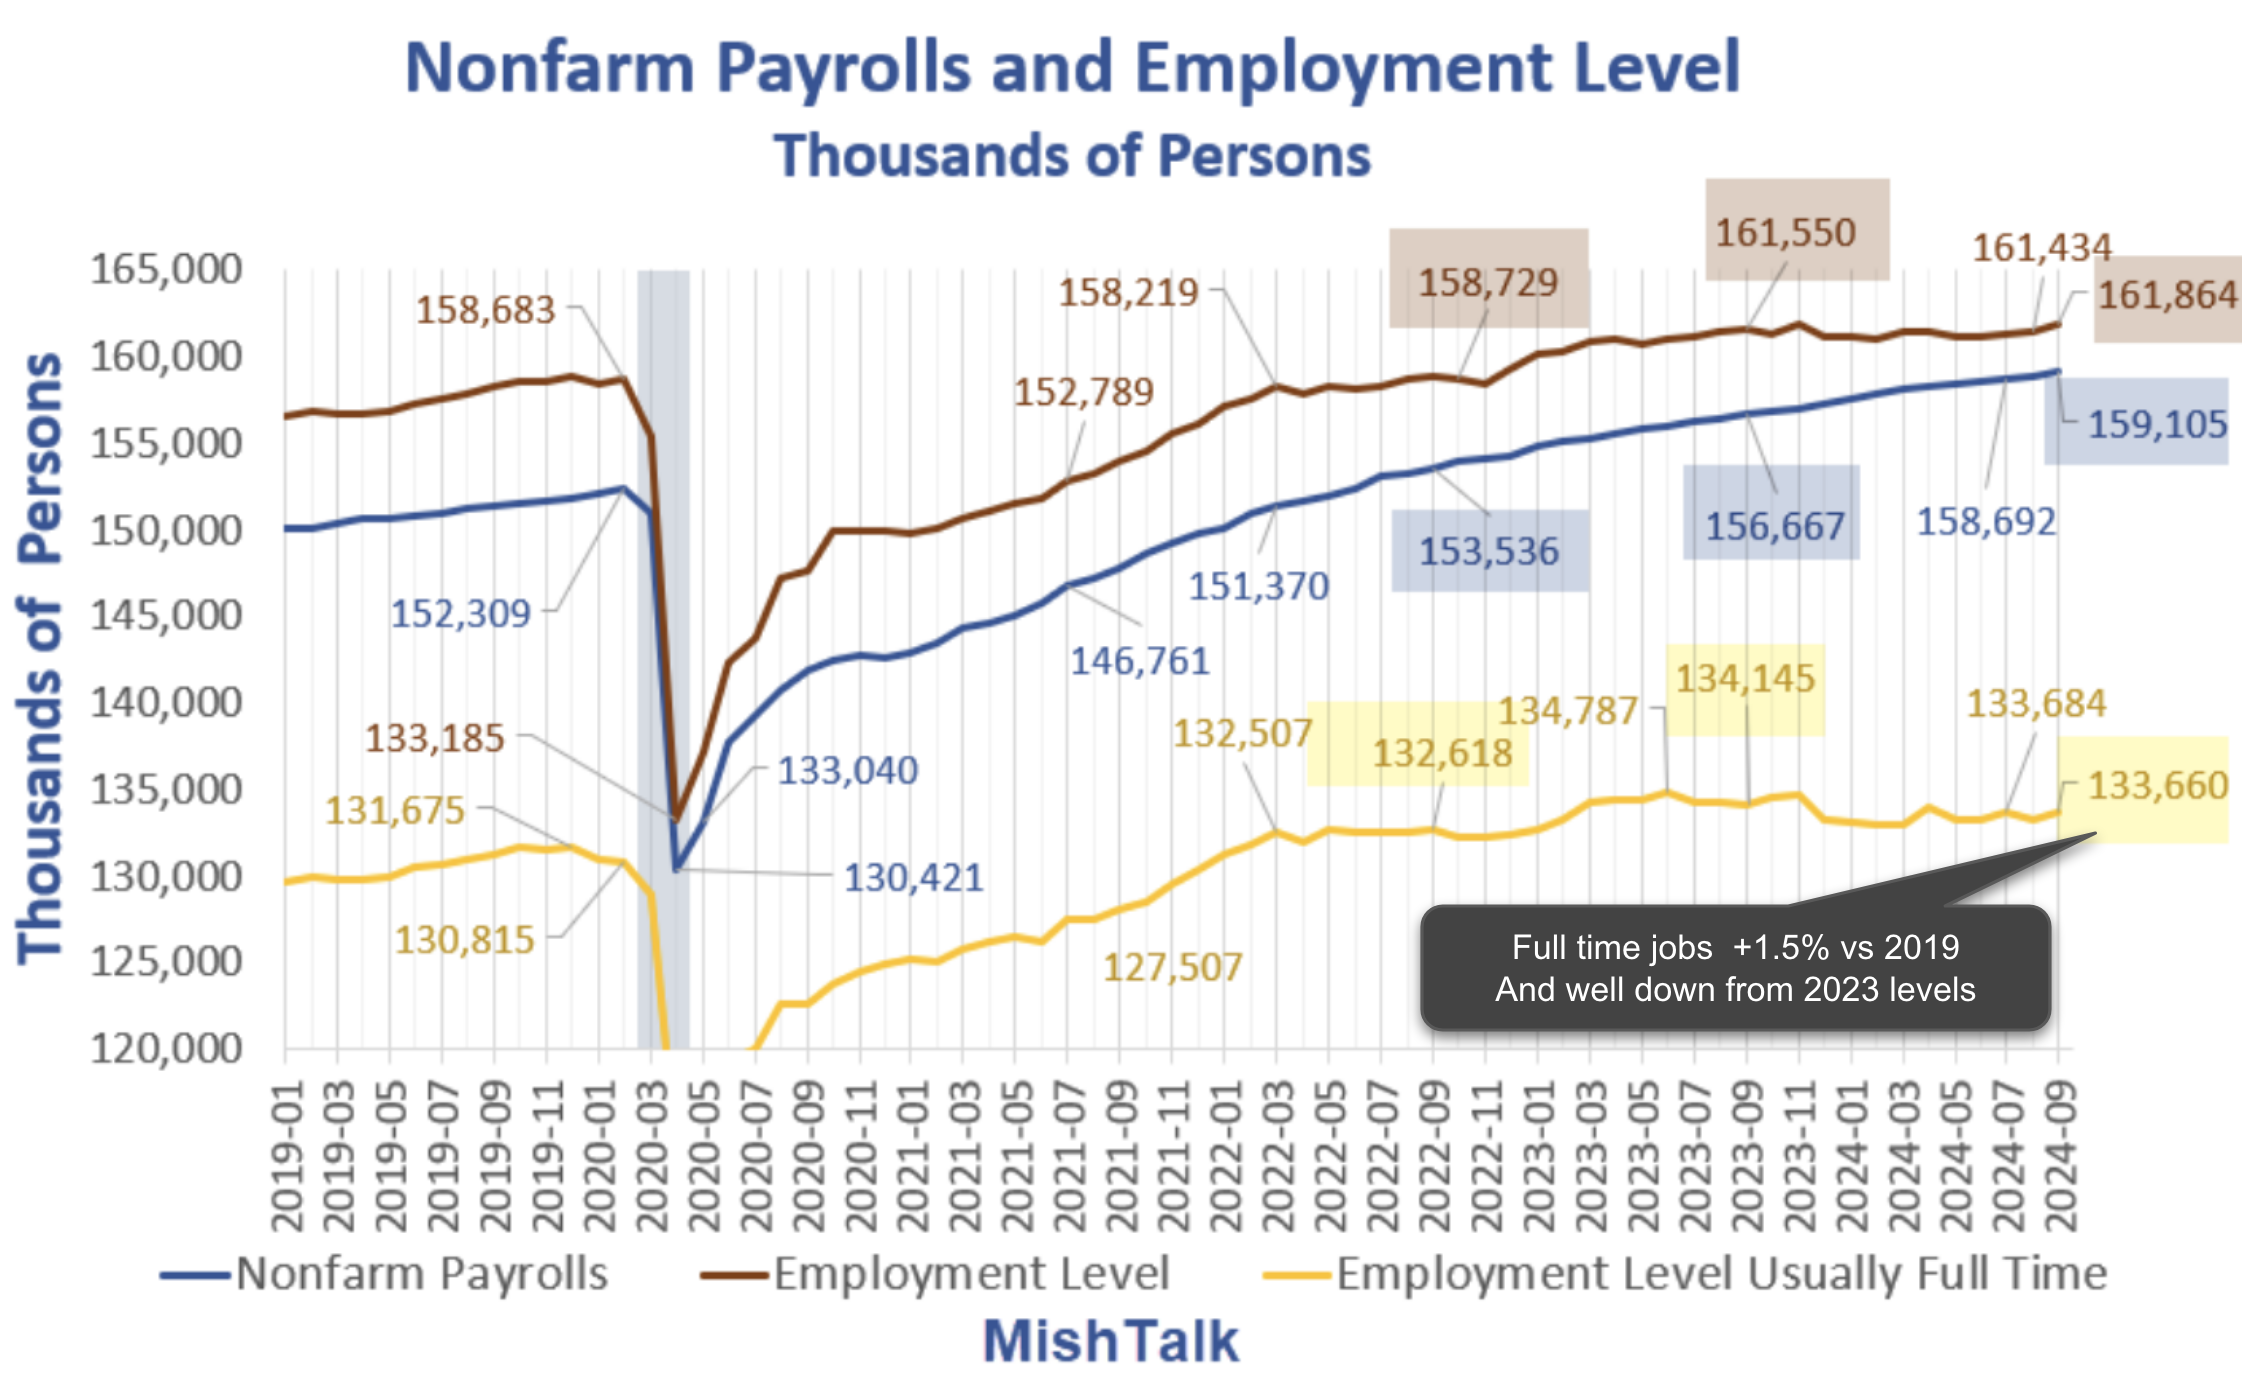
- 254K monthly job additions masks weakness w/full-time jobs
It was a good week for stocks – buoyed by a strong monthly jobs print.
However one hot night doesn’t make a summer.
The report deserves scrutiny.
I’ll demonstrate how underlying trends suggest part-time job growth far outweighs weakness in full-time jobs (inflated by government and health sector jobs)
With respect to stocks – they seem to be losing momentum.
And with stocks trading at more than 21x forward earnings – this could be a concern in the short-term.
But first, did the Fed go too hard with 50 basis points (bps)?
Implications for the Fed
Post the Fed’s jumbo rate cut on September 18th – their decision has come under scrutiny.
For example, questions raised include:
- Why cut 50 bps to initiate the easing cycle?
- Isn’t 50 reserved for an emergency (e.g., 2001, 2008 and 2020)?
- What economic risks (underlying trends) do they see further out? and
- Could easier money reignite inflation (with wage growth at 4.0%)? etc
Markets were quick to price in ~200 bps of cuts over the next 12 months (something I felt was aggressive)
The 10-year plunged to ~3.60% – a level I felt traders should reduce long-term exposure. For example, I sold half my position in EDV (a bond ETF that benefits from yields falling)
Why?
At this level – I expected the 10-year yield to rally (i.e., bond prices to fall)
It was pricing in too many cuts – the same mistake it made in January of this year.
The yield is now closer to 4.00% post the cut (causing pain in bond prices) – in turn – sending mortgage rates sharply higher.
Was the Fed’s intent to increase borrowing costs on consumers?
Unlikely.
Recent economic data is now painting a more complex picture for monetary policy.
Data Deviates from Expectations
With the Fed slashing rates – one might expect economic data to show meaningful weakness.
However, that is not what (most) economic data is telling us.
Contrary to market expectations, key economic indicators have shown resilience.
They continue to defy predictions of a significant downturn.
But this should not come as a surprise to regular readers.
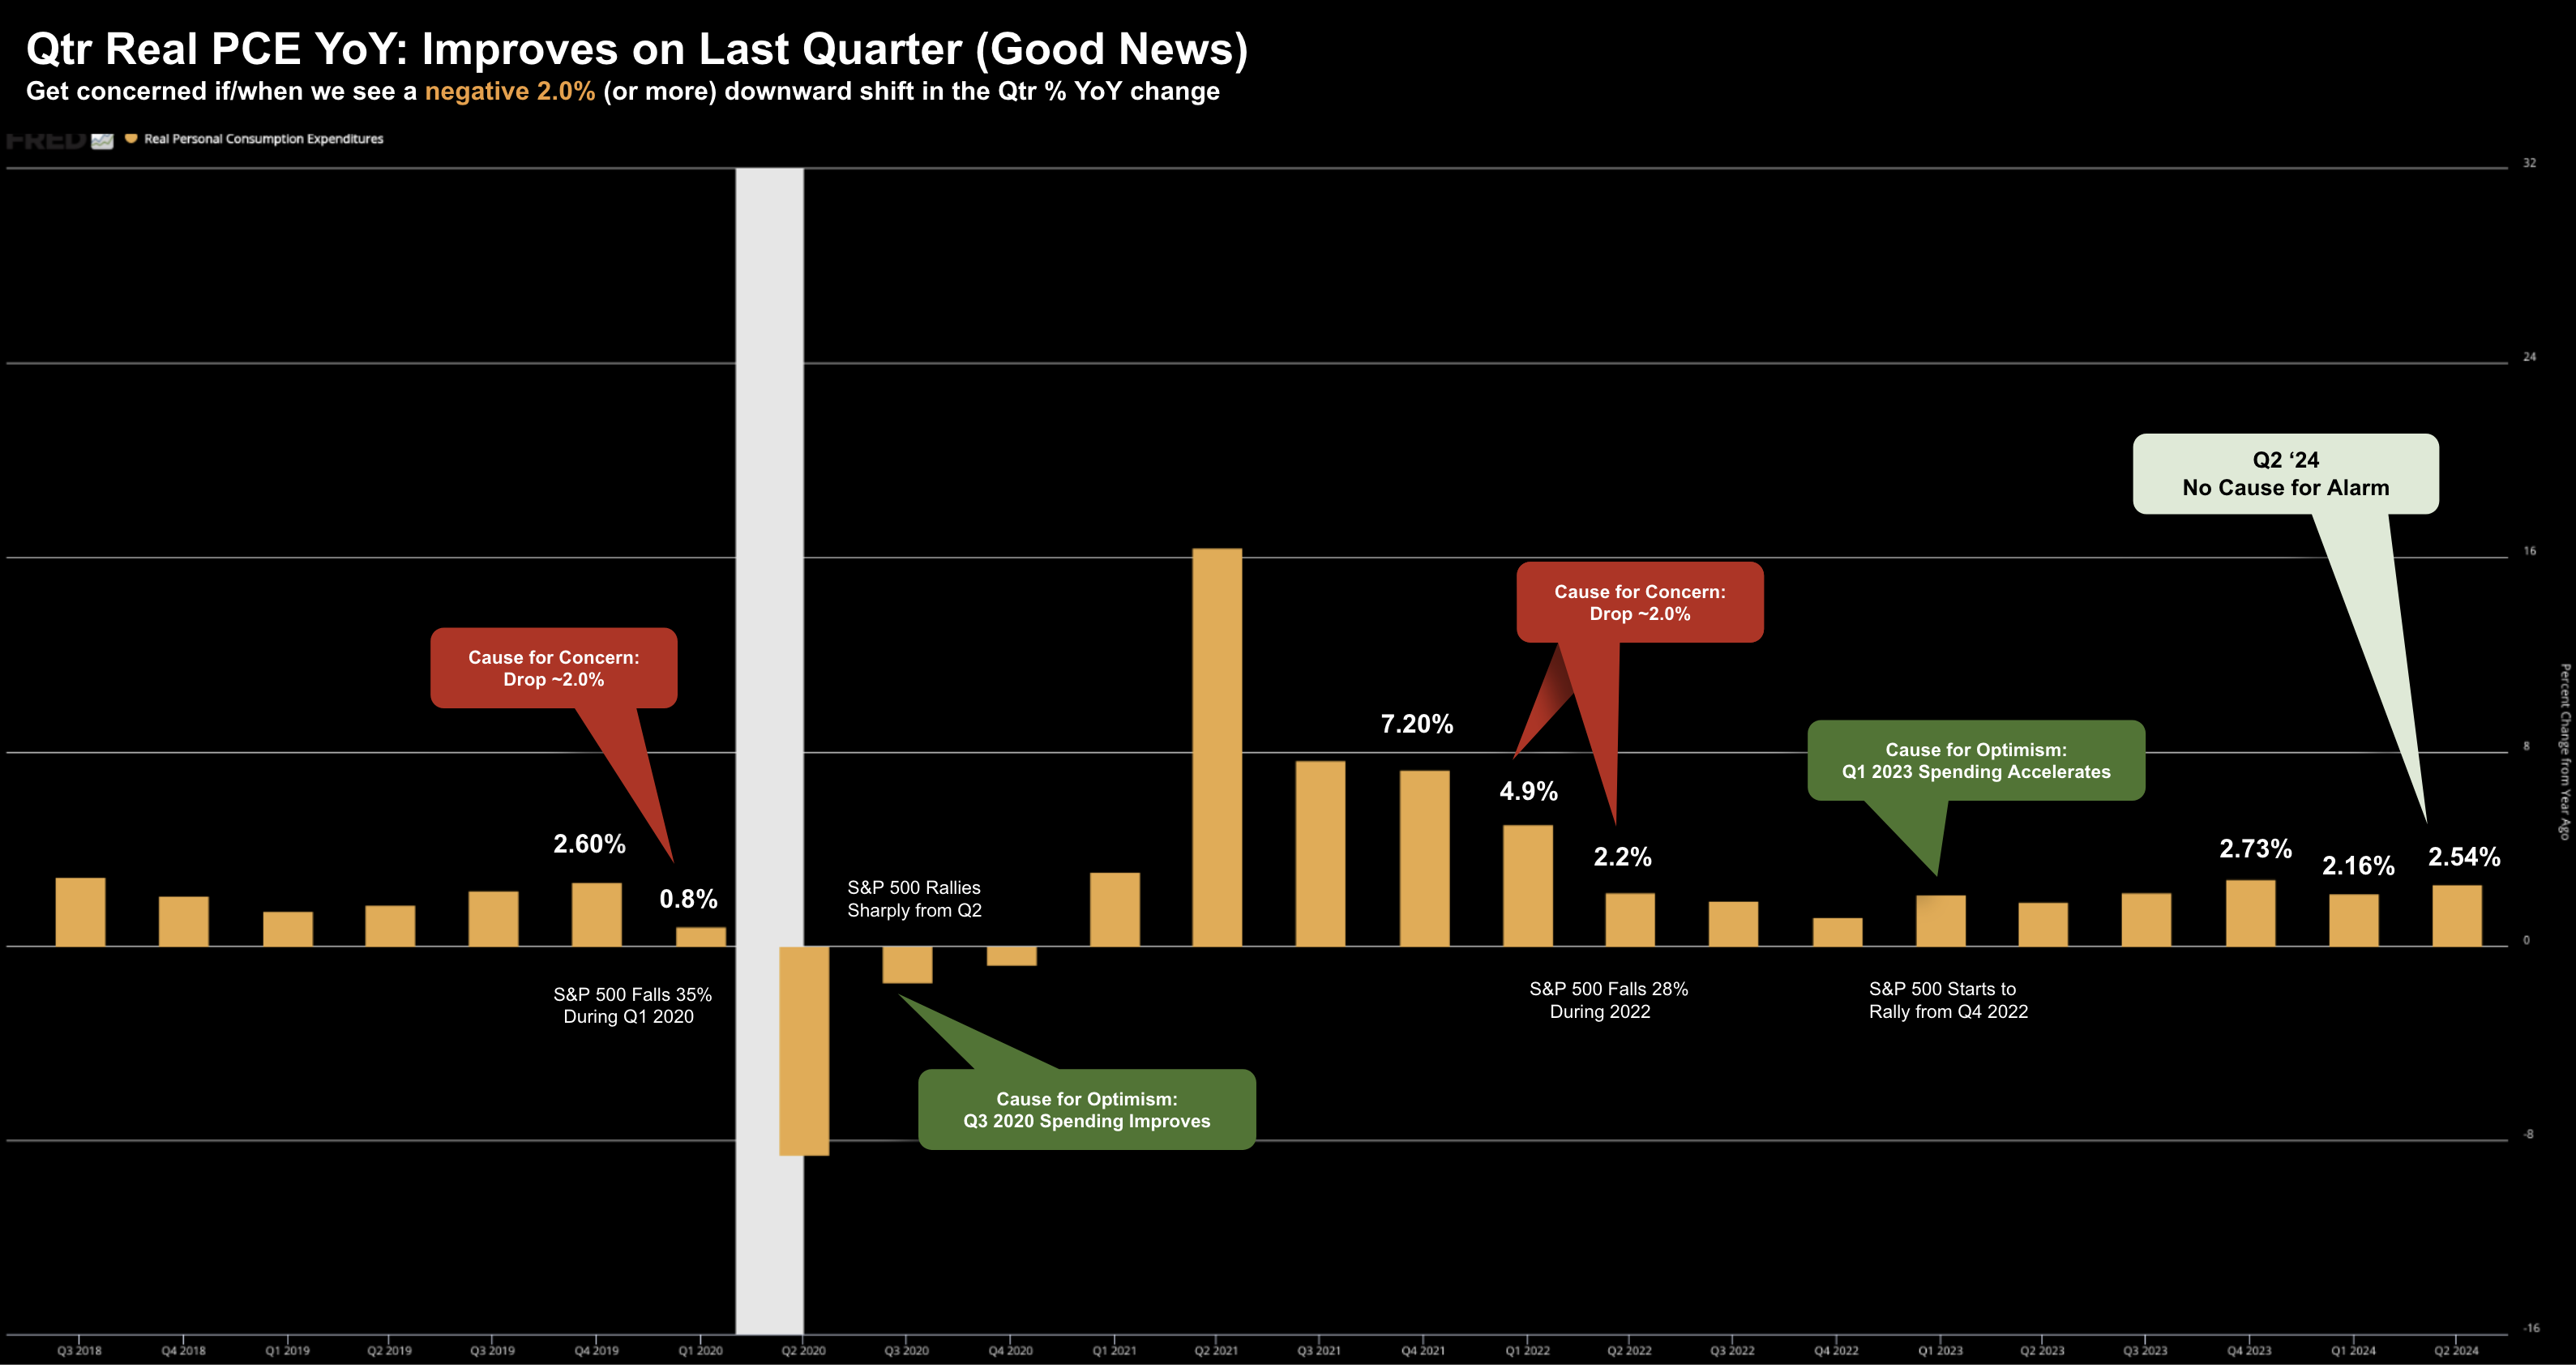
Here I point to the long-term trend in Real PCE on a quarterly YoY change basis (my preferred leading economic indicator).
Only when this shows a change of 2.0% or more between quarters (YoY) – will you hear me sound a warning.
As I said last quarter – there’s no cause for alarm.
That said, economic resilience (especially from the consumer) is bound to complicate the Fed’s decision-making.
For example, the traditional correlation between economic data and interest rate policy is far less clear-cut in the current environment.
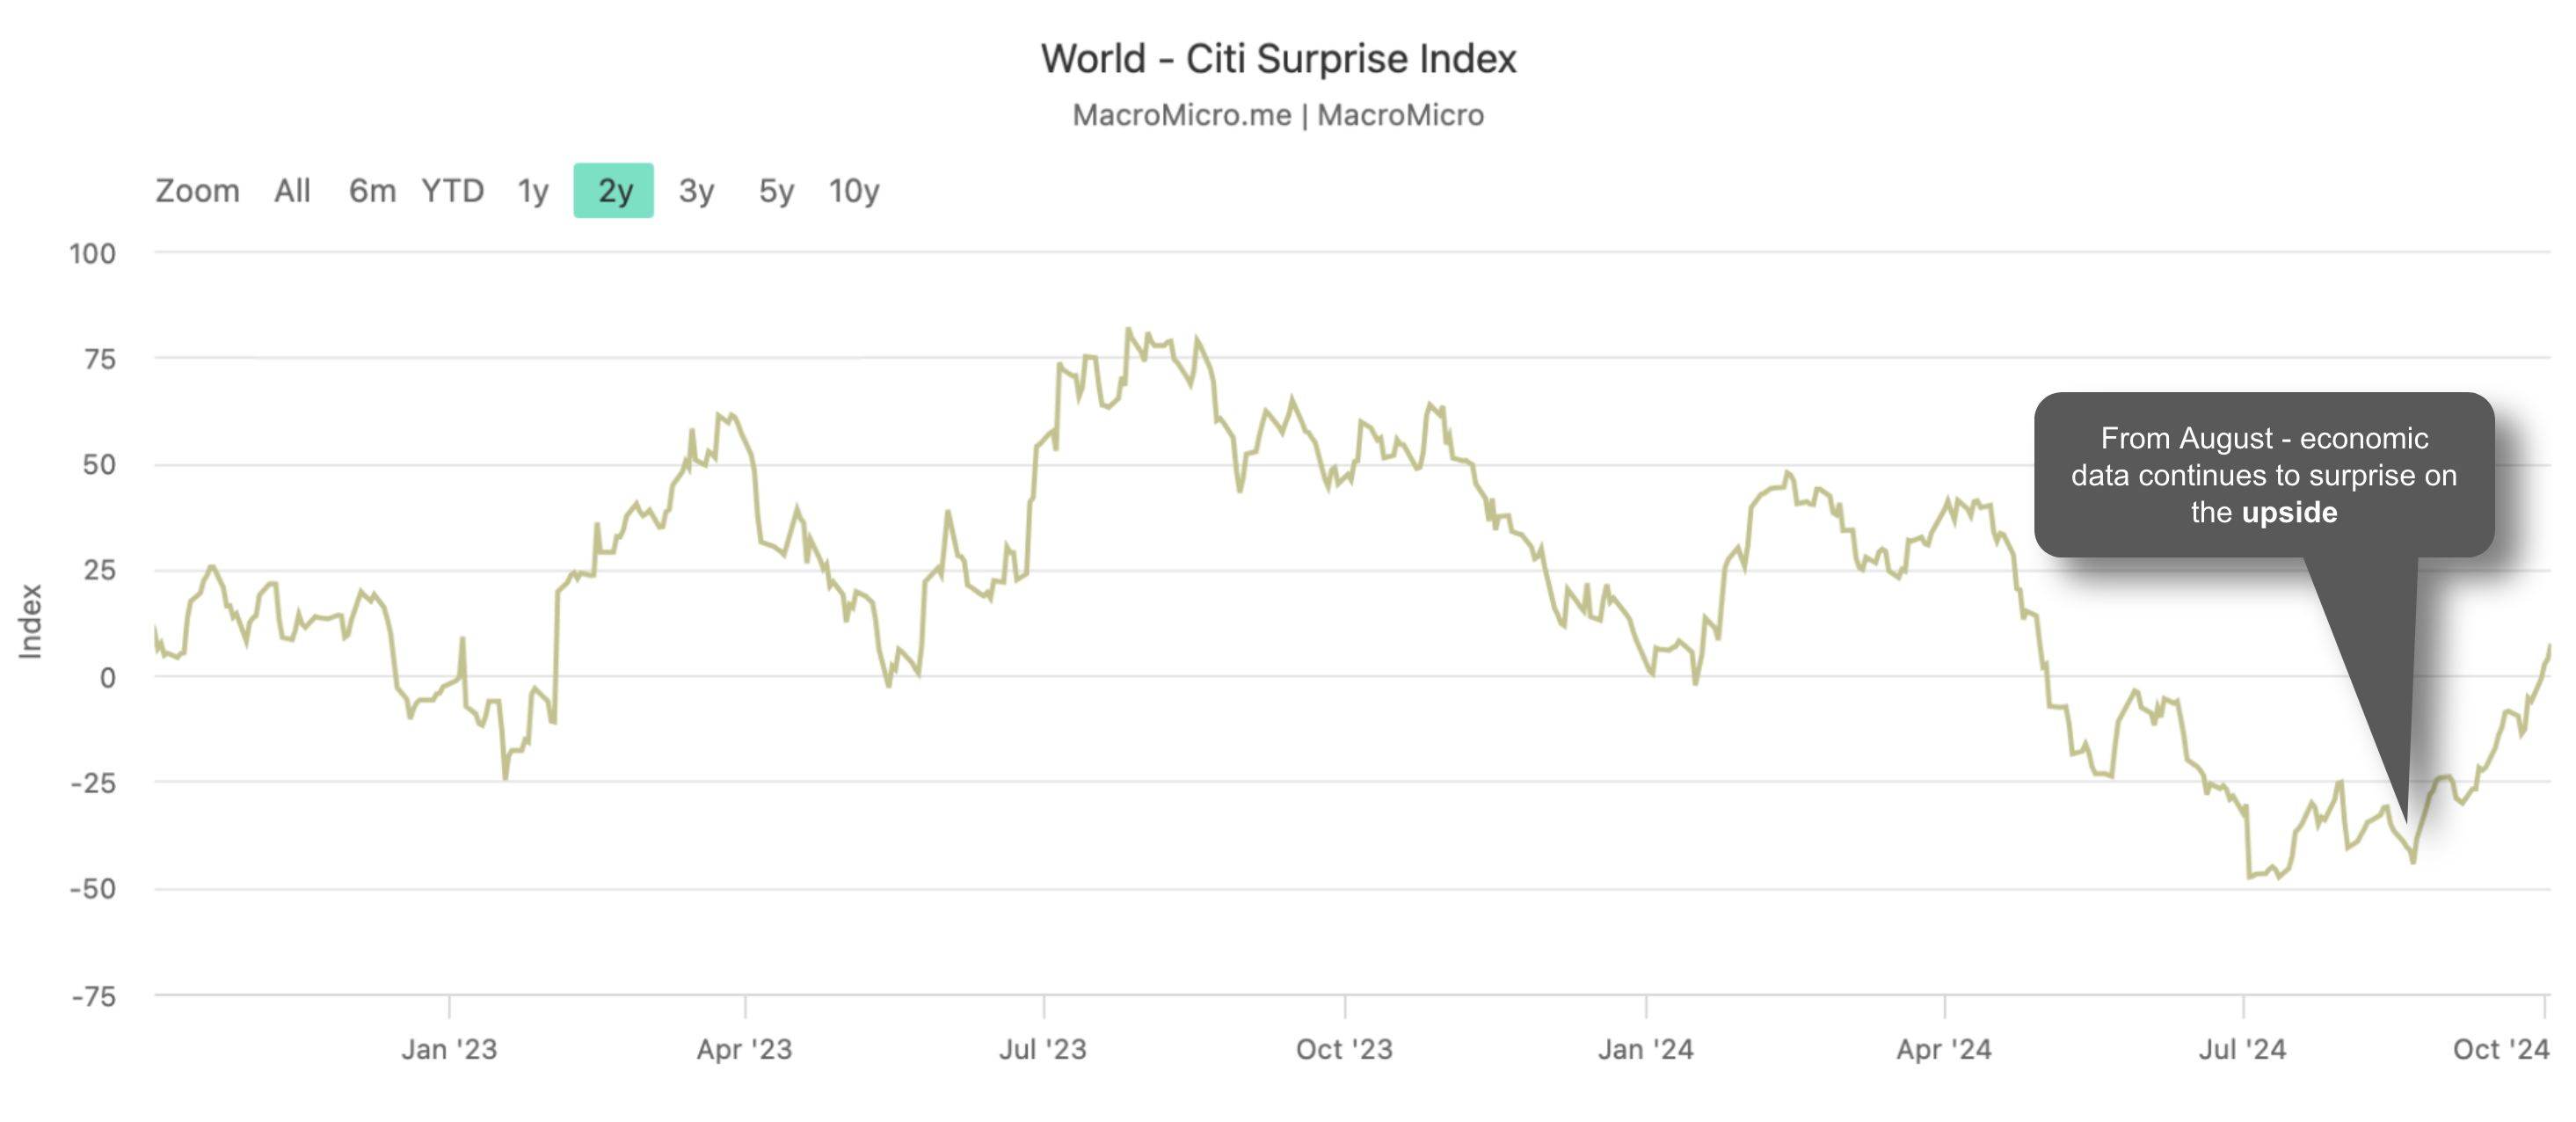
Consider Citi’s US Economic Surprise Index:
So far, most (not all) economic data is not deteriorating as expected.
Therefore, what does that mean for policy makers?
But wait… not everything points higher.
Manufacturing Struggles
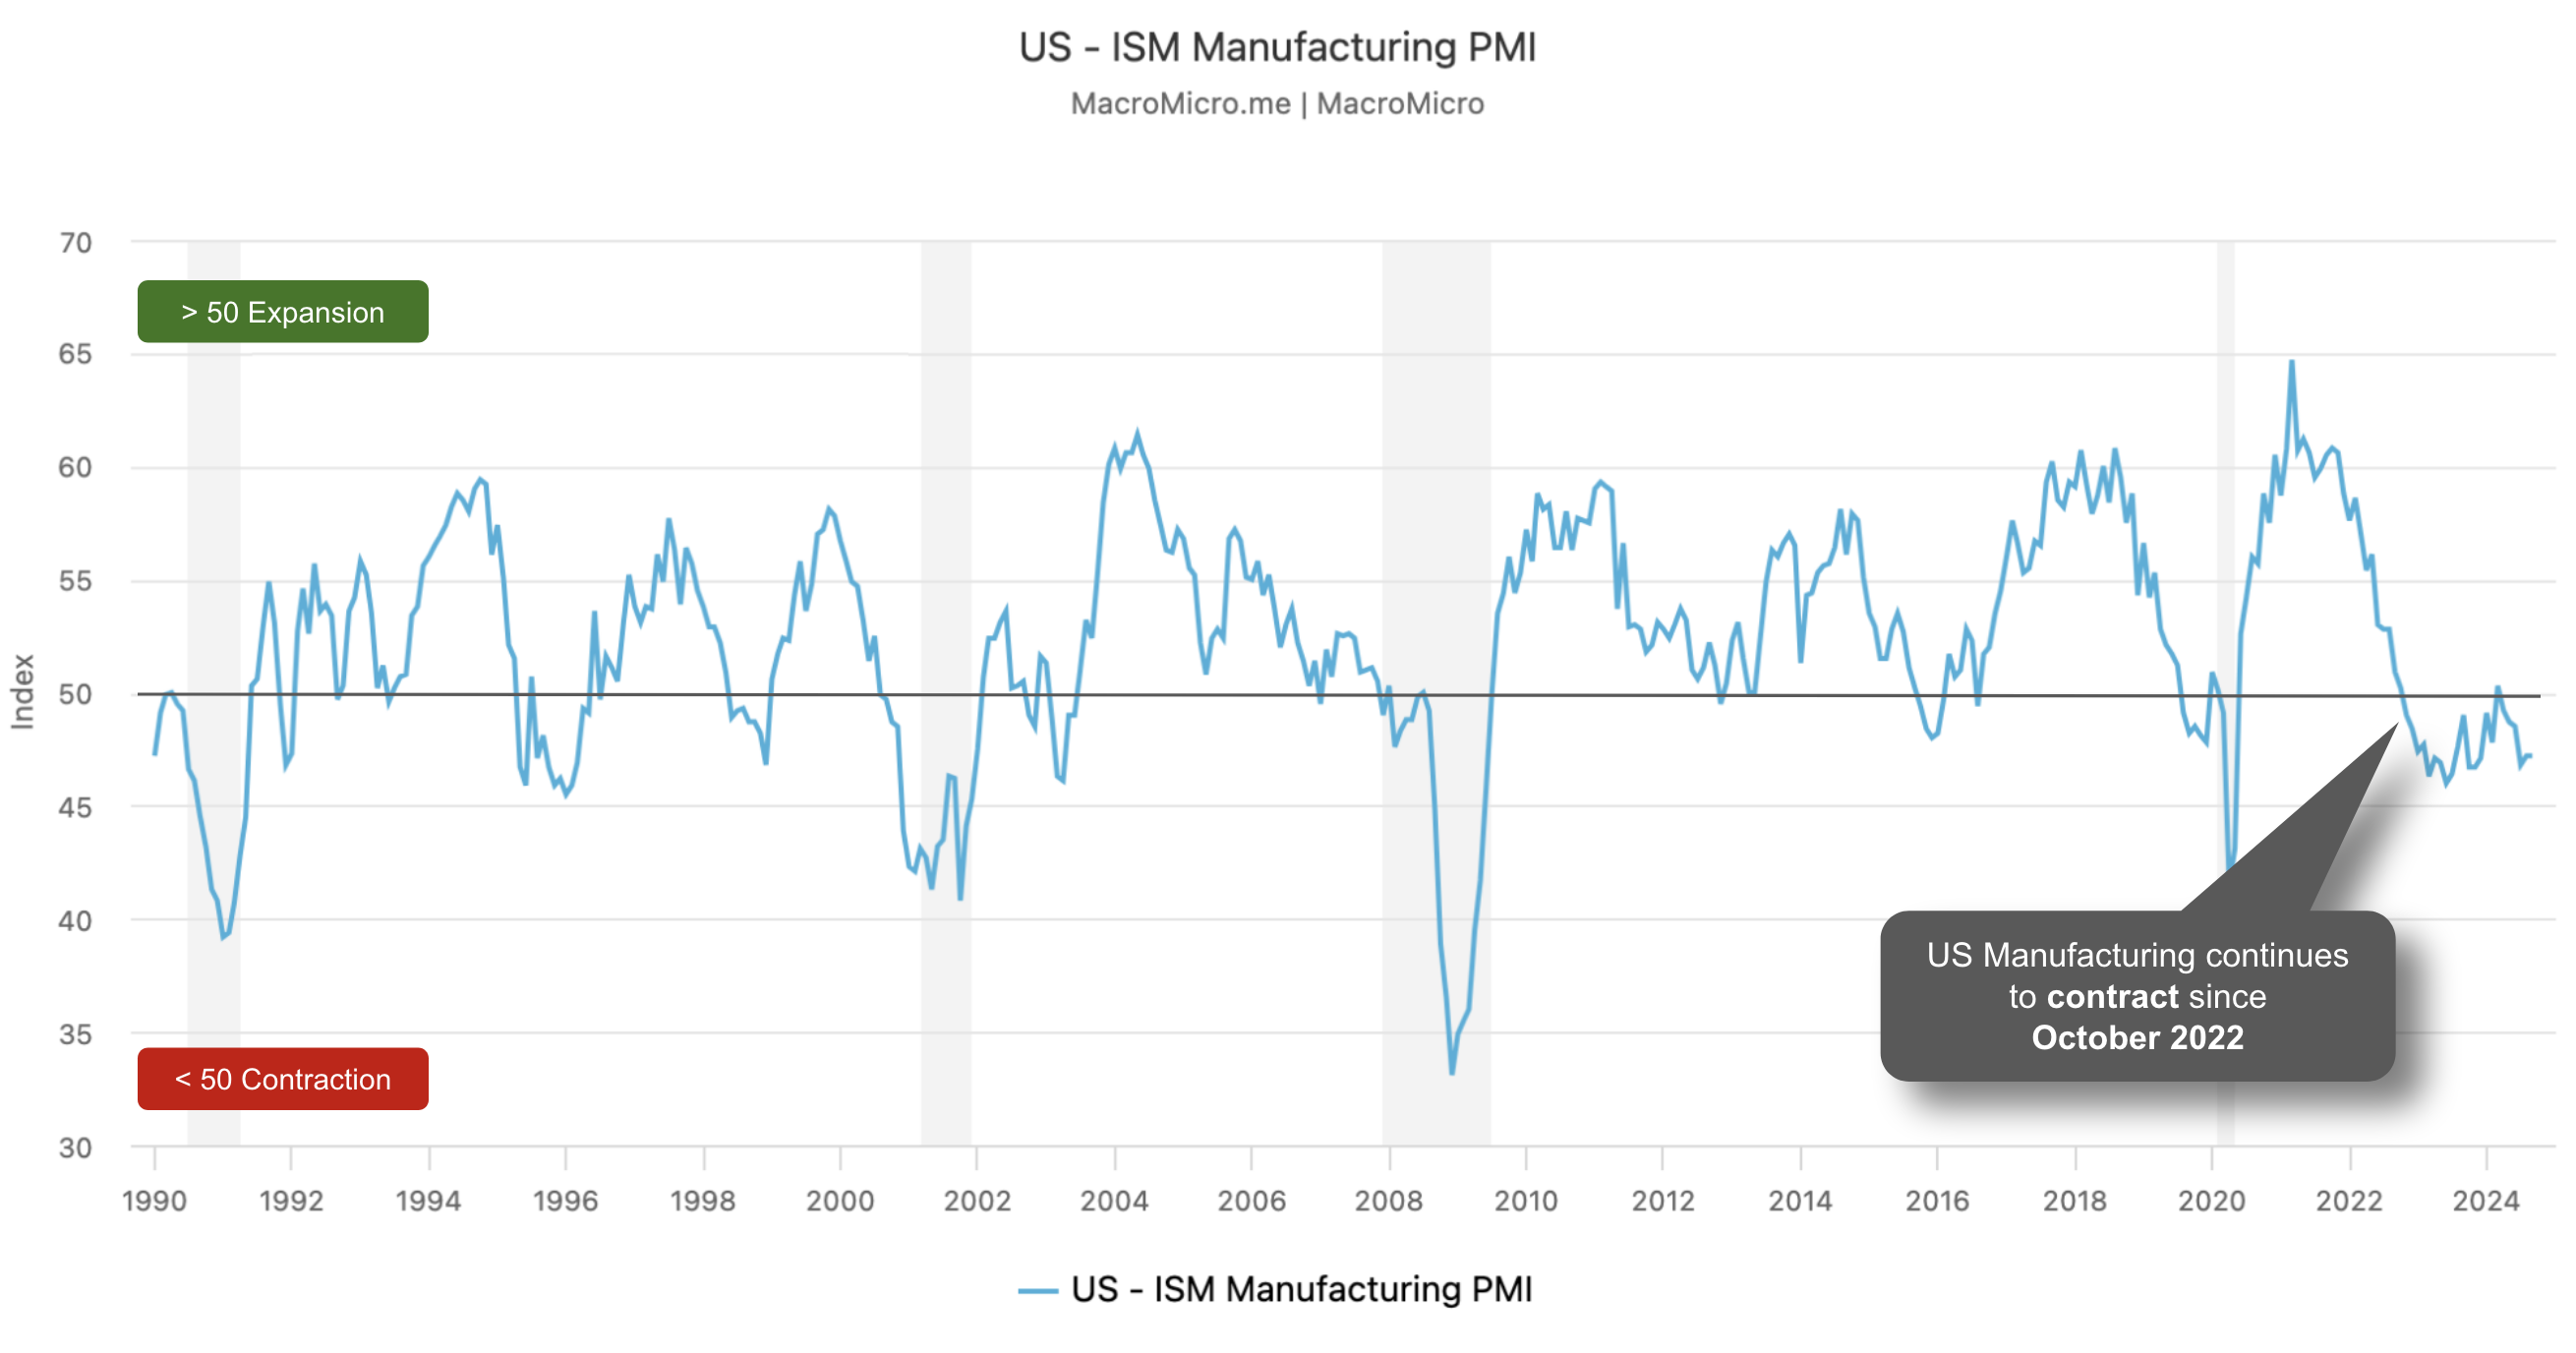
If there is pronounced weakness in the US economy – we find it with manufacturing.
Whilst not officially in recession – if you work in the sector – it may feel like it.
No other sector has shed more jobs than US manufacturing.
The sector lost another 7,000 full-time jobs last month.
The question I continue to ask is why?
Why aren’t U.S. made goods booming – given consumer’s appetite to spend?
The Institute of Supply Management’s (ISM) survey of manufacturing revealed that both headline and indicators (e.g., inventories and new orders) remain below the 50 level – indicating contraction.
A number above 50 is said to show expansion.
And whilst US manufacturing is only 10.3% of total GDP – it’s of enormous economic (and strategic) importance.
However, for the past few years, the sector is hesitant to invest in new capital (or inventory) due to uncertainty surrounding the economy (and fiscal policy)
Why you ask?
Start by looking at the incentives.
If you get the incentive structure right – it will shift investor behavior (like most things in life)
‘Strong’ Jobs?
Let’s turn to jobs and the ‘blowout’ 254,000 monthly jobs additions for September.
Based on the Fed’s 50 bps cut – it’s reasonable to assume the central bank is hedging against further (job) weakness.
And with inflation risks behind us – this helps them cushion any unexpected softening with labor.
To better understand employment trends (beyond a headline) – readers should go deeper with Mike Shedlock’s blog (second to none).
- Divergence b/w jobs and employment: While non-farm payroll job gains have been significant, full-time employment has actually declined.
- Strong job growth but weak employment: Non-farm payrolls have increased by 2.4 million in the last year, but employment has only increased by 314,000 and full-time employment has decreased by 485,000.
- Sector-specific trends: Government and health services add far more jobs than any other sector (combined 112K jobs of the 254K total) – which are related to the surge of immigrants (both legal and illegal). Manufacturing however continues to shed jobs (losing 7,000). Transportation services lost 9,000 jobs
- Wages keeping up with inflation: Average hourly earnings have increased by 4.0% in the last year, now outpacing with inflation.
- Unemployment rate rising: The unemployment rate has increased from its 50-year low of 3.4% to 4.1% (however slightly lower than its recent peak of 4.3%)
Mish’s analysis suggests while the job market appears strong (which is a lagging indicator) – there are underlying trends indicating a potential shift in employment patterns.
And this is what concerns the Fed…
Let’s finish with a look at how equities ended the week.
S&P 500 Losing Momentum
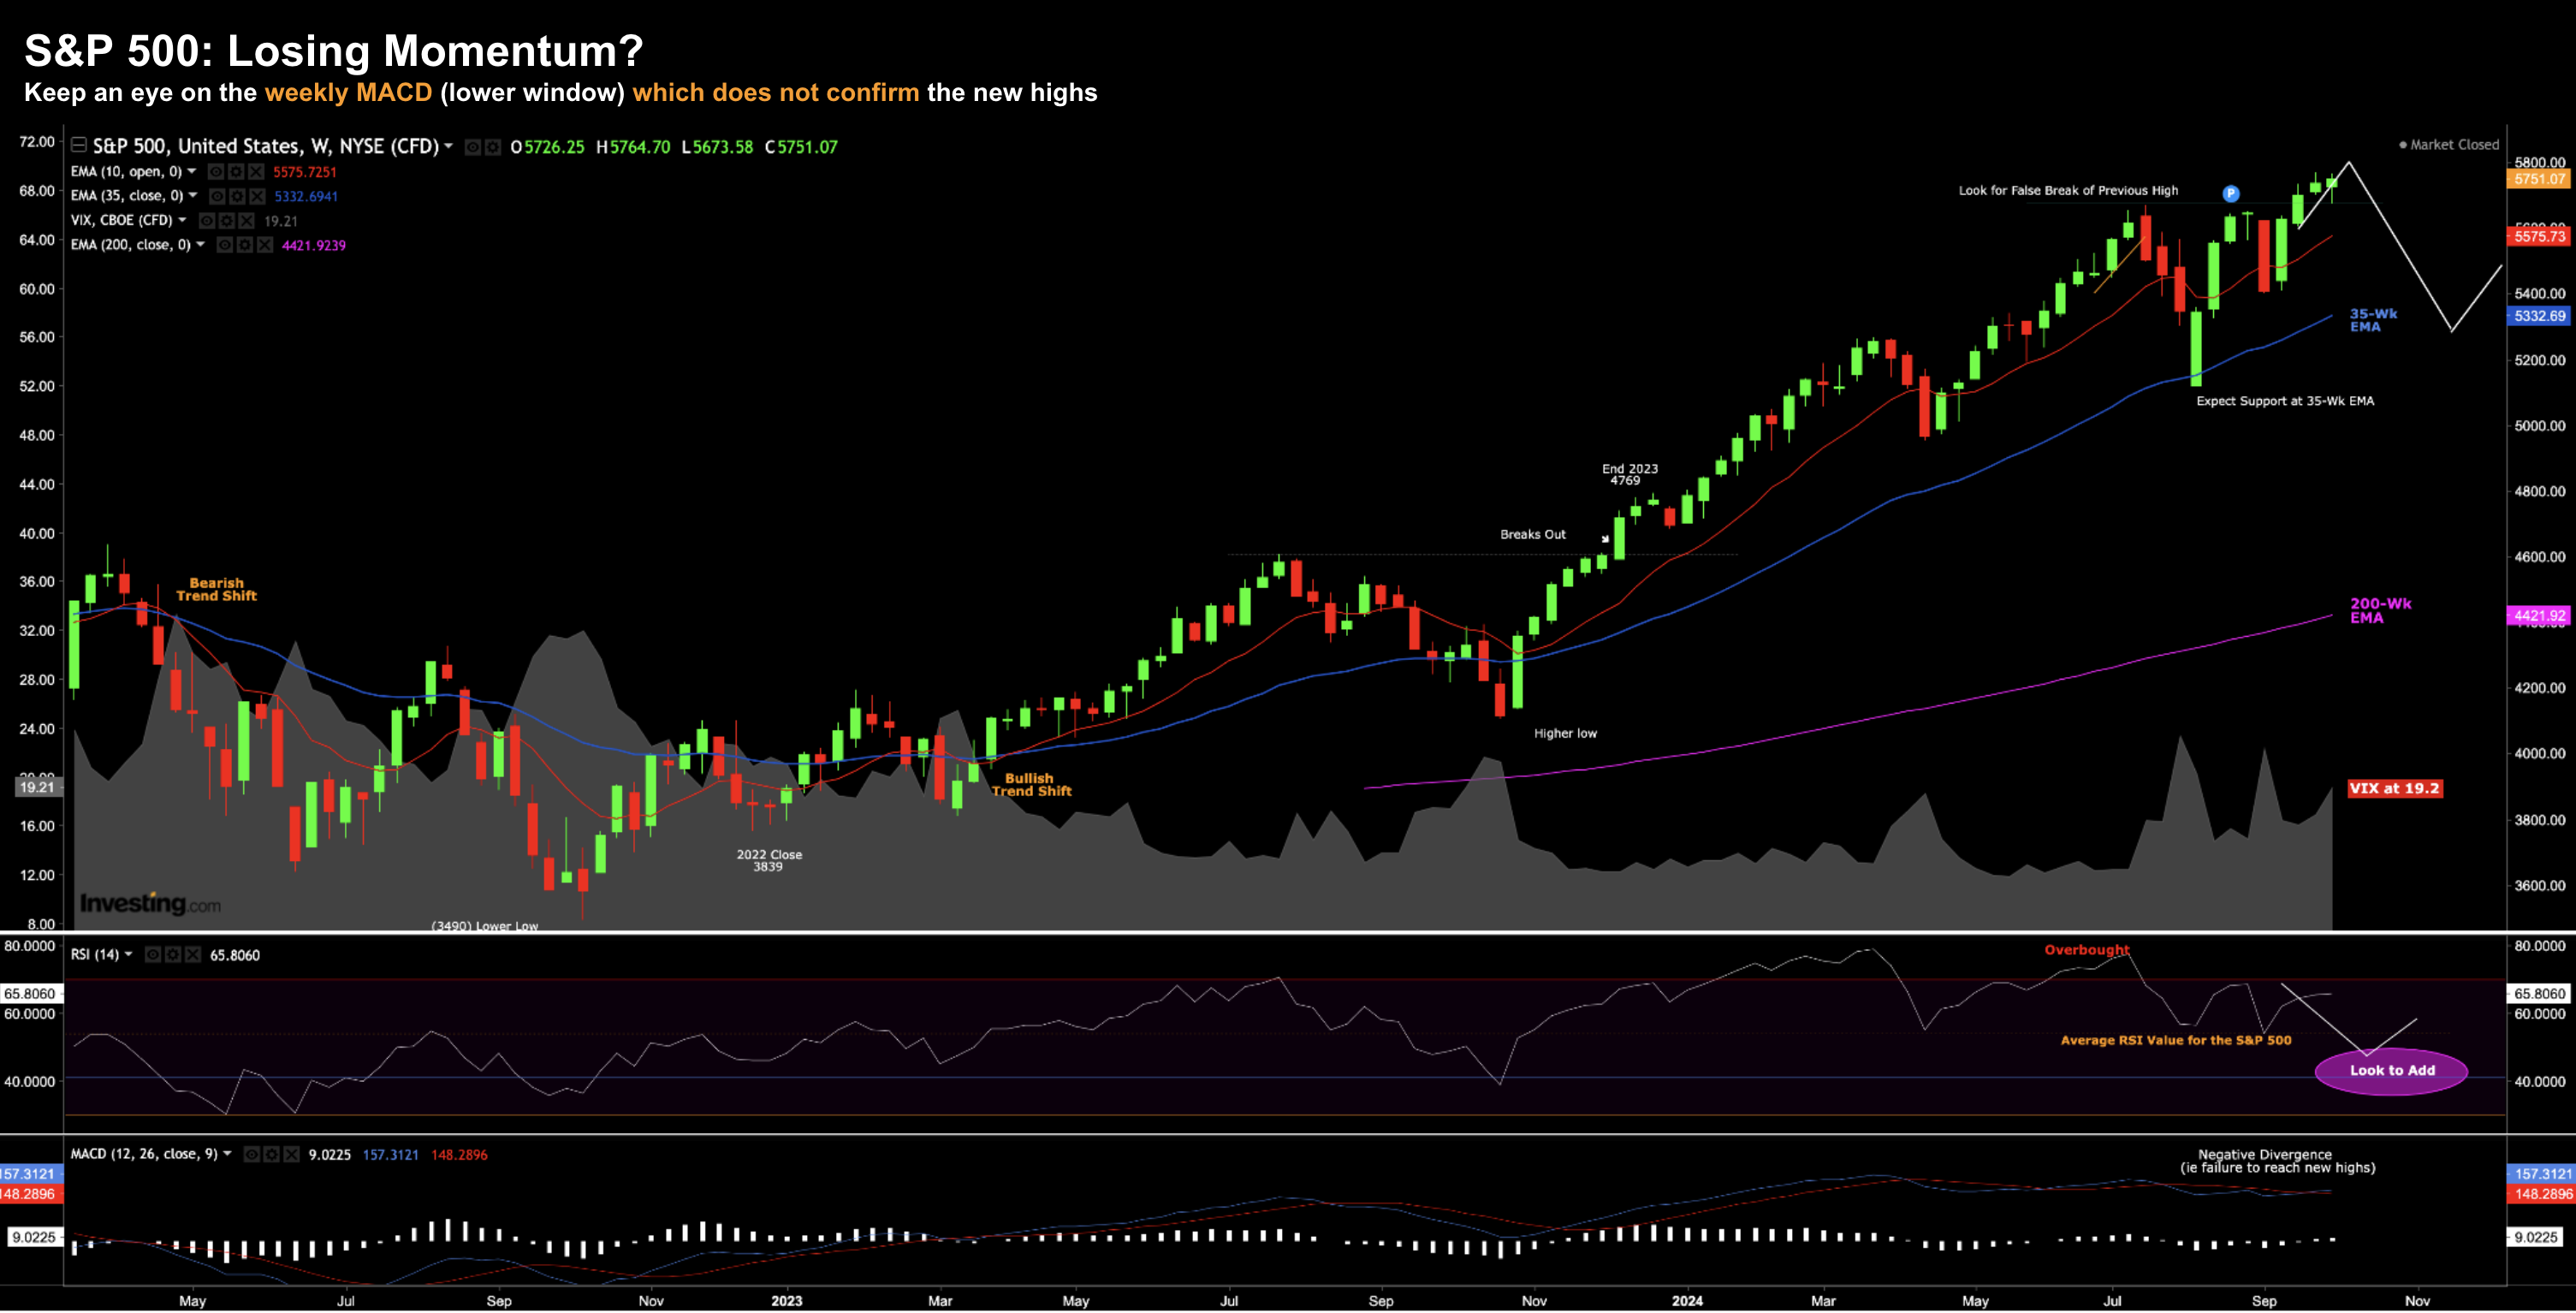
Last week I said my primary concern with the S&P 500 at present is its loss of momentum.
For example, if we look at the lower window (weekly MACD), we see it diverging with the price action.
In other words, the weekly MACD is trending lower whilst the price action trends highs.
Quite often this is a precursor to weaker price action ahead:
October 5 2024
For example, if the S&P 500 is to trade back below its previous high of 5670, I would consider the recent move higher a false break.
As it stands this week, that is my favored outcome.
And based on what we see with the spike higher in the VIX (now 19.2) – markets are preparing for greater volatility.
Look for another re-test of the 35-week EMA zone.
Putting it All Together
For the most part, the economic data has ‘surprised’ to the upside.
I use the term ‘surprised‘ loosely – as the quarterly trend in Real PCE YoY suggests the economy is in reasonable shape.
Therefore, how aggressive will the Fed need to be?
Obviously that will depend on underlying trends in the labor market (and to a lesser extent inflation).
The Fed is likely to push ahead with two 25 bps cuts before year’s end.
As explained in my previous post – they have room given where the neutral rate theoretically lies (e.g., ~3.5%)
However, what matters most (to investors) is what’s priced in?
For example, equities see 200 bps of cuts over the next 12 months.
Too much?
For now, that feels ambitious.
p.s., apologies for not posting this week – I was traveling – working in Los Angeles from our ‘Spruce Goose‘ office. Whilst Google has many incredible offices – this ranks among the best. It was originally Howard Hughes’ Hangar... and now we’re blessed to enjoy it as a sensational workspace.

