- All-time highs for the S&P 500… but is momentum is fading?
- Economy hits “stall speed” – with annualized Real GDP showing a 1-handle (down from 3+ last quarter); and
- Why I think inflation and bond yields fall next year
If you had offered me a wager 12 months ago that the S&P 500 would be ~25% higher in a year’s time – despite the 10-year yield rallying from 3.7% to around 4.4% over the same period – I would have taken the other side of that bet.
I would have happily bet you $1,000 and felt confident I would have won.
And guess what – I would have lost the bet.
~25% gains in 12 months is staggering… but it can be explained.
And it all comes down to a handful of (tech) stocks.
This time last year the Top 3 stocks by market capitalization – constituted 16% of the total S&P 500. The Top 7 stocks (also known as the Magnificent 7) comprised over 30%
At the time I was commenting on how concentrated the market was… saying it suffered with “bad breadth“… something we saw during the dot.com bust of 2000.
Fast forward to today and the Top 3 now make up ~20%
This year’s gains have mostly been driven by what we see in the large-cap tech space… specifically “AI” names.
Case in point:
21% of the total gain in the S&P 500 year-to-date is due to Nvidia alone.
This market is as narrow as I’ve seen in my 27+ years trading.
And whilst that does not mean the market is prone to collapse anytime soon (I doubt it will) – it does introduce greater risks and vulnerabilities.
And this game is all about managing risk – ensuring we don’t lose capital.
But for now… things are good.
Our ‘AI towers’ (i.e., Google, Microsoft, Nvidia, Meta and Amazon) all appear to be in very good shape.
Investors are willing to pay a hefty premium for the promise of future growth.
That makes sense.
However, as an investor, you should at least be aware of the structural risks.
With that said, early this foggy Saturday morning in San Francisco (what’s new?) – I will take a look at:
(a) the weekly chart for the S&P 500; and
(b) more on why I think bonds are good bet into 2025
S&P 500 – Momentum Wanes
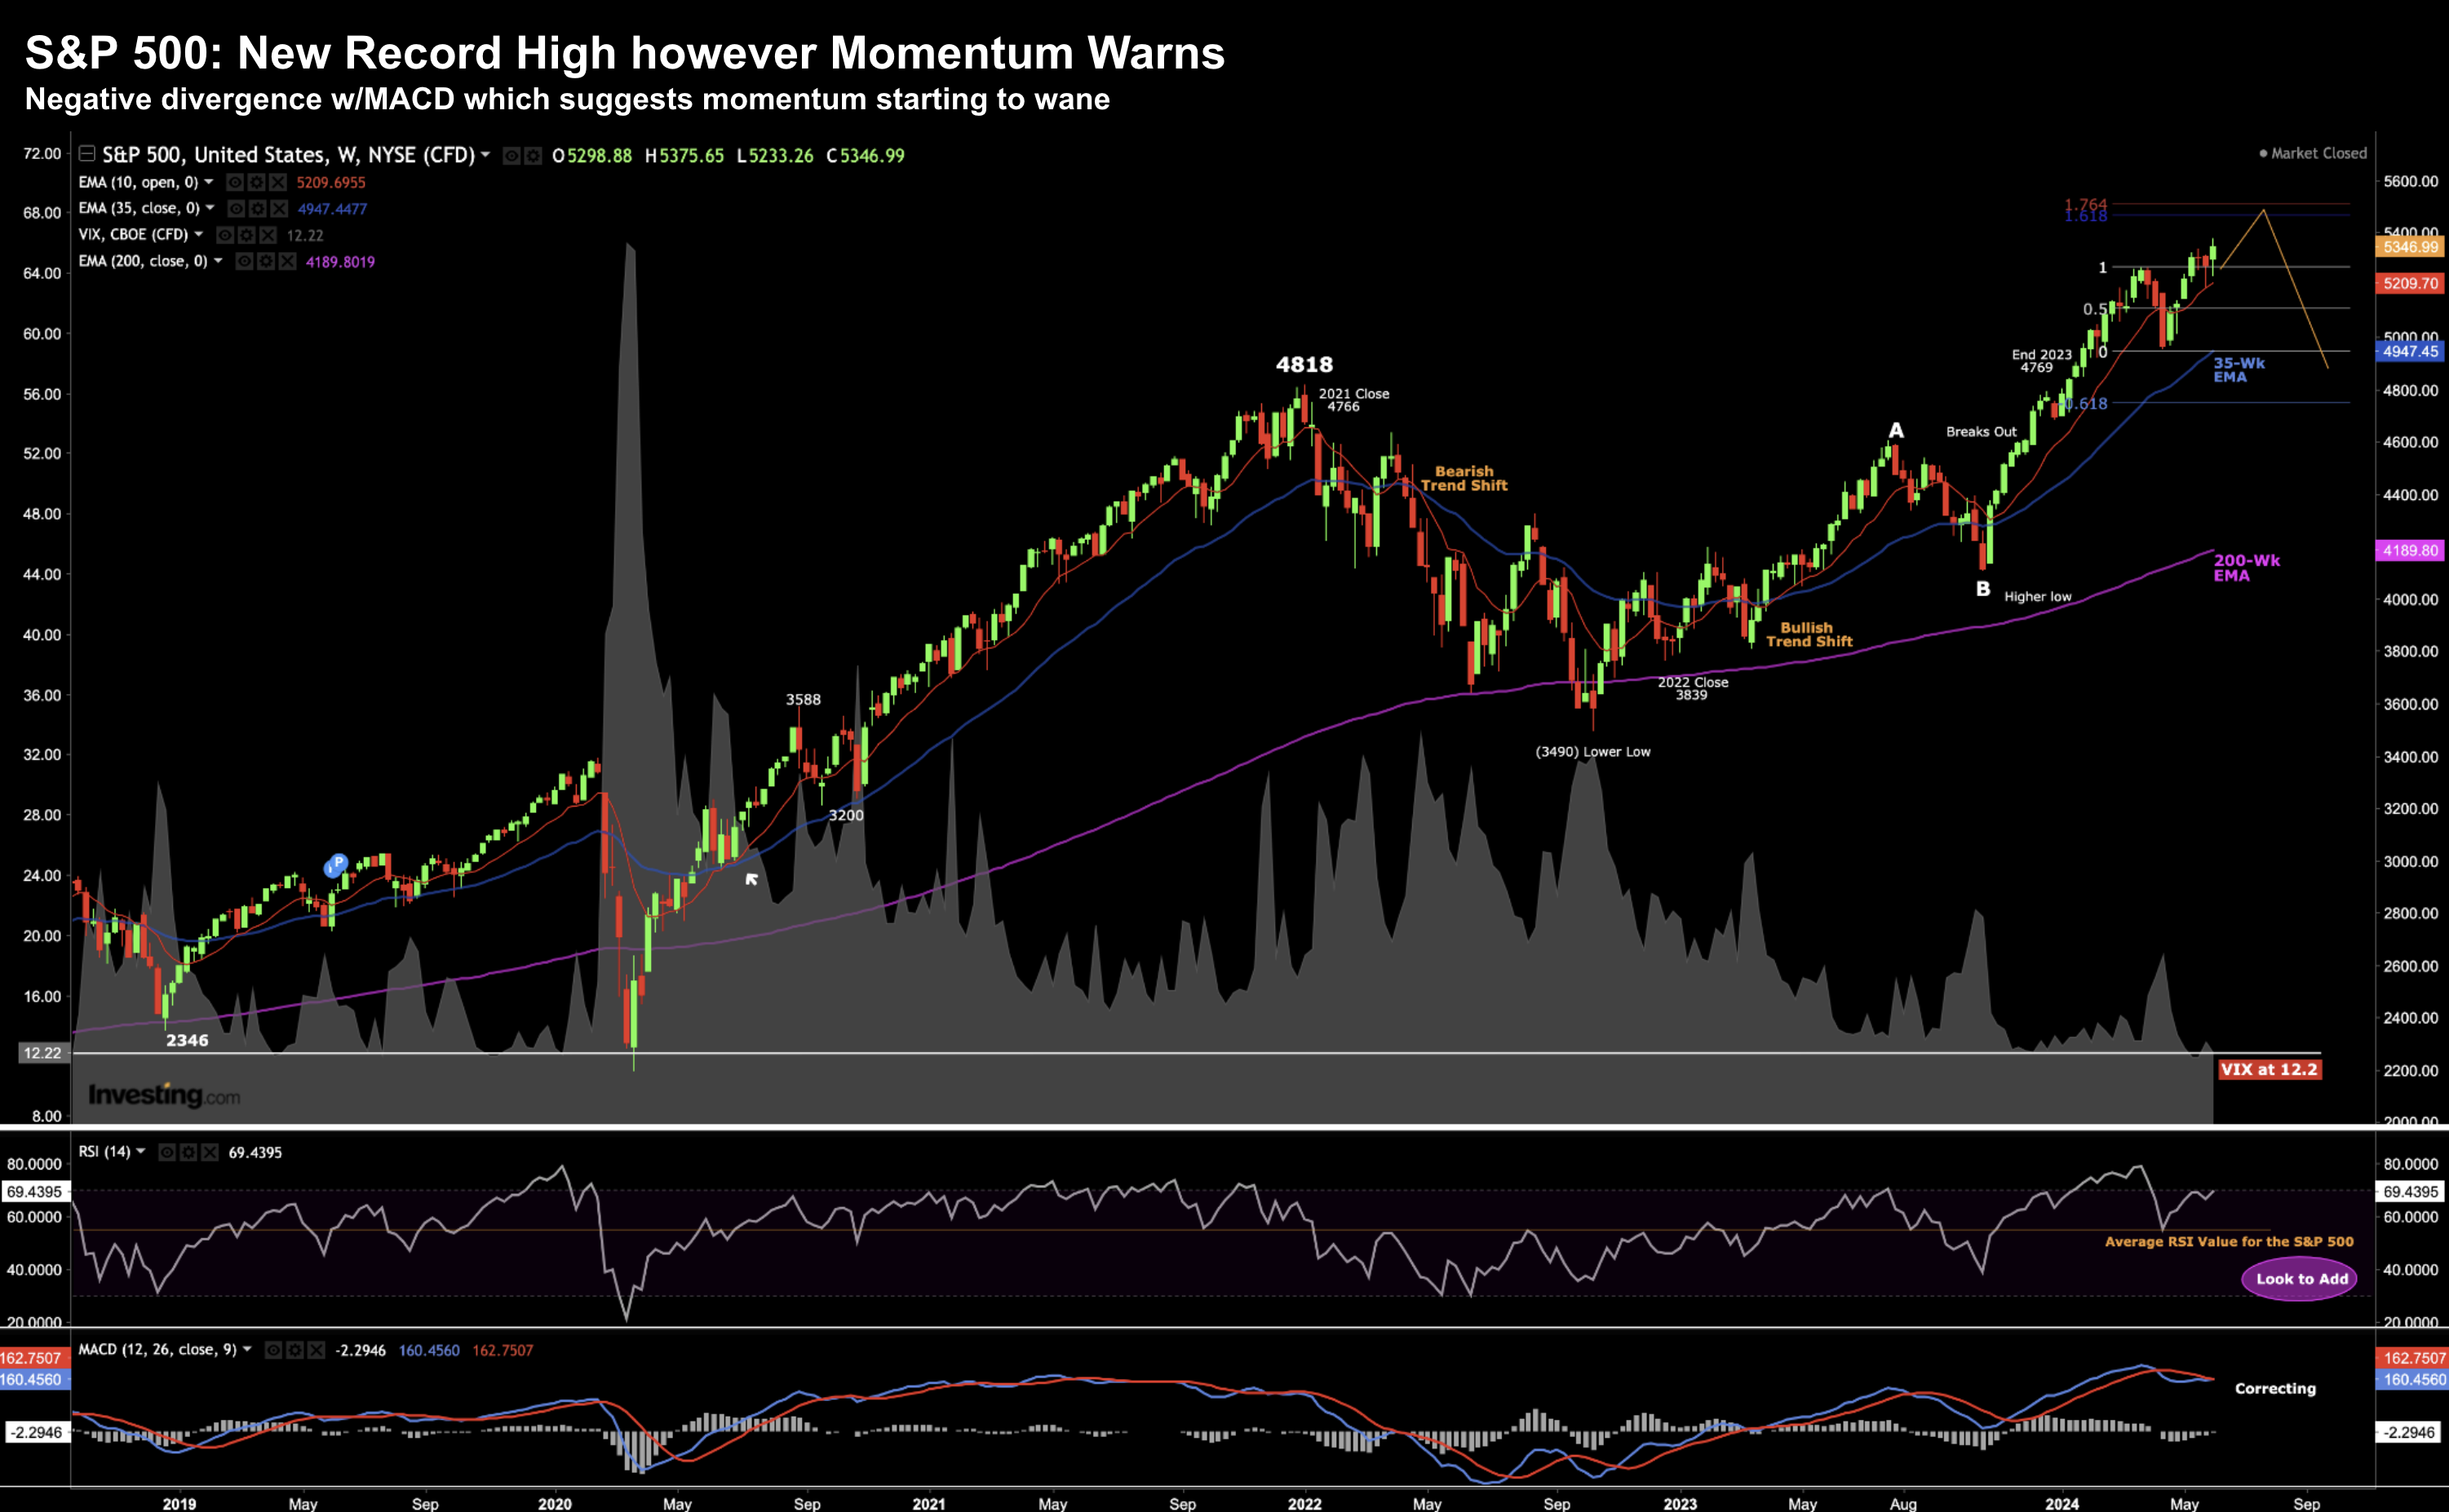
Let’s start with the world’s largest index – the S&P 500 – it was another record close for equities.
June 8 2024
2023 and 2024 has been a story of “up and to the right”
From the low marked “B” (week of October 23 2023) – the market is up 30.2%
From here, I see the chance of further upside to around 5500; i.e., the Fibonacci 61.8% to 76.4% retracement outside our current distribution.
And with earnings expected to be around $245 (up 12% on last year) – that would represent a forward PE of 22.4x
Personally, I think that’s rich with 10-year yields offering 4.4% (more on this below)
Put it this way:
The earnings yield on a forward PE of 22.4 is 4.45% (i.e. the inverse of 22.4)
The US 10-year is offering investors a risk free rate today of 4.40%
In other words, you are receiving zero risk premium for buying stocks at this level.
Is that a good long-term bet?
Not for me.
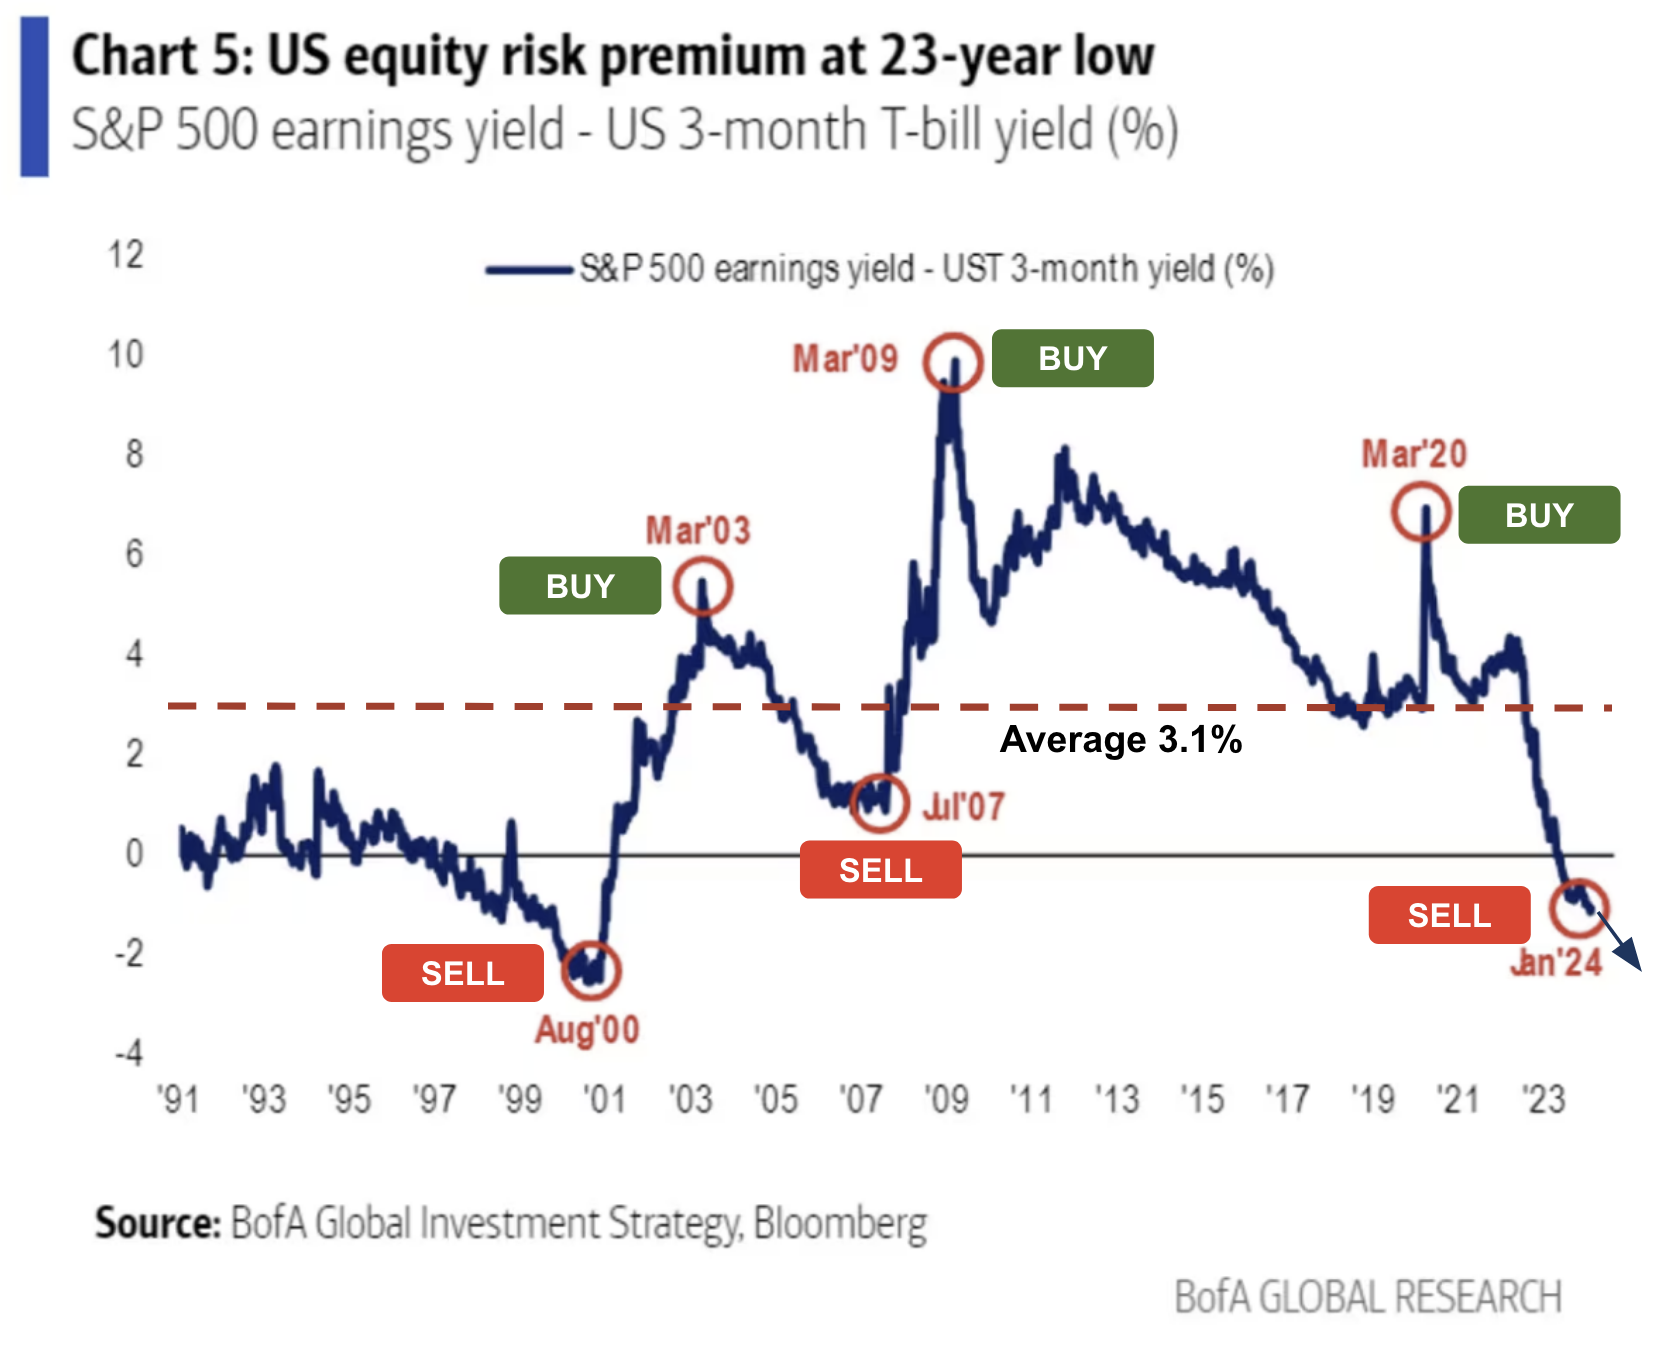
For example, in April I shared this BoA chart showing what happens when investors are willing to buy equities with zero risk premium:
Note how ‘timely’ each of these entry and exit points were over the long-run. Will January 2024 be equally as prescient over the next 2-3 years?
Now from a technical lens, I do see a warning with the MACD (lower window)
What we see here is something called negative divergence.
That’s where the price is making new highs however the corresponding momentum peaks with the MACD are lower.
In short, what this tells us is the weekly-MACD is not confirming the upward price action.
For clarity, that’s not to say that prices cannot continue to advance to the level I suggested above. They could.
However, the MACD is waving a yellow flag.
“Attention drivers: there’s oil on the track – exercise caution”
And I think there’s a good reason…
A “Stall Speed” Economy
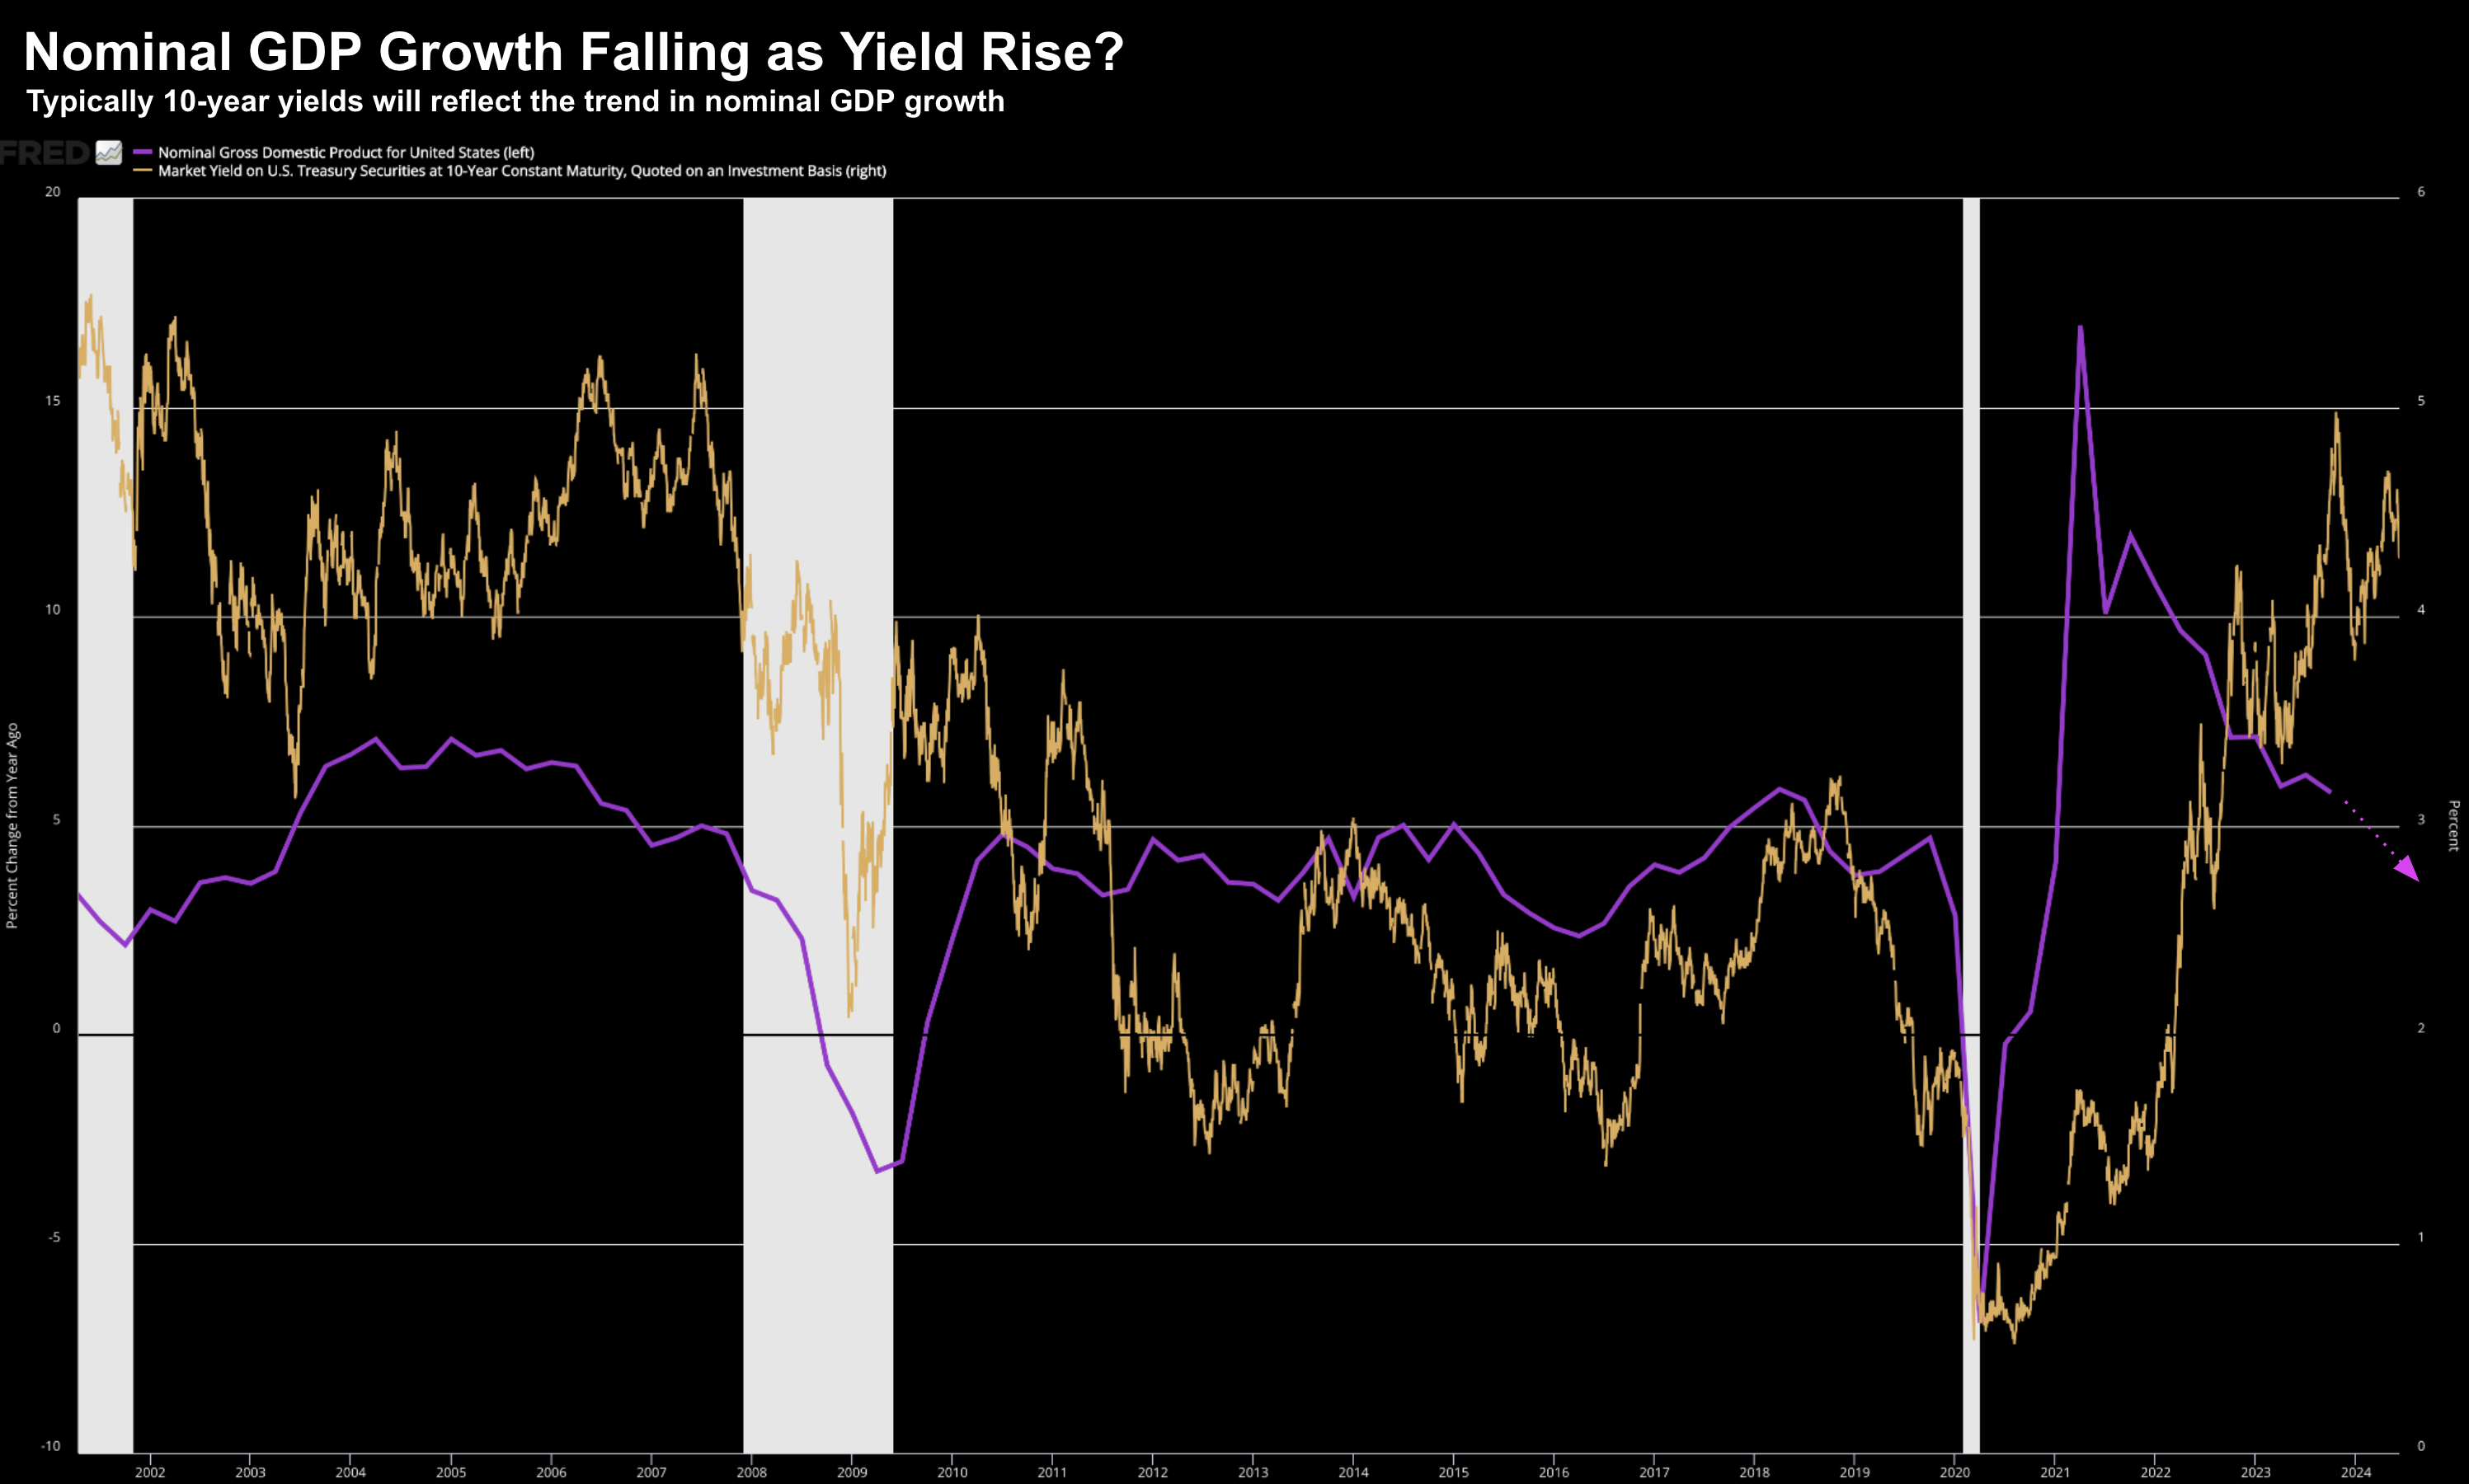
As part of my missive yesterday – talking to why I think bond yields are too high – I offered this chart showing the trend in nominal GDP growth vs what we see with the US 10-year yield (orange)
I made the comment that growth is slowing sharply... heading back to pre-pandemic nominal growth below 3%.
I want to expand on this a little…
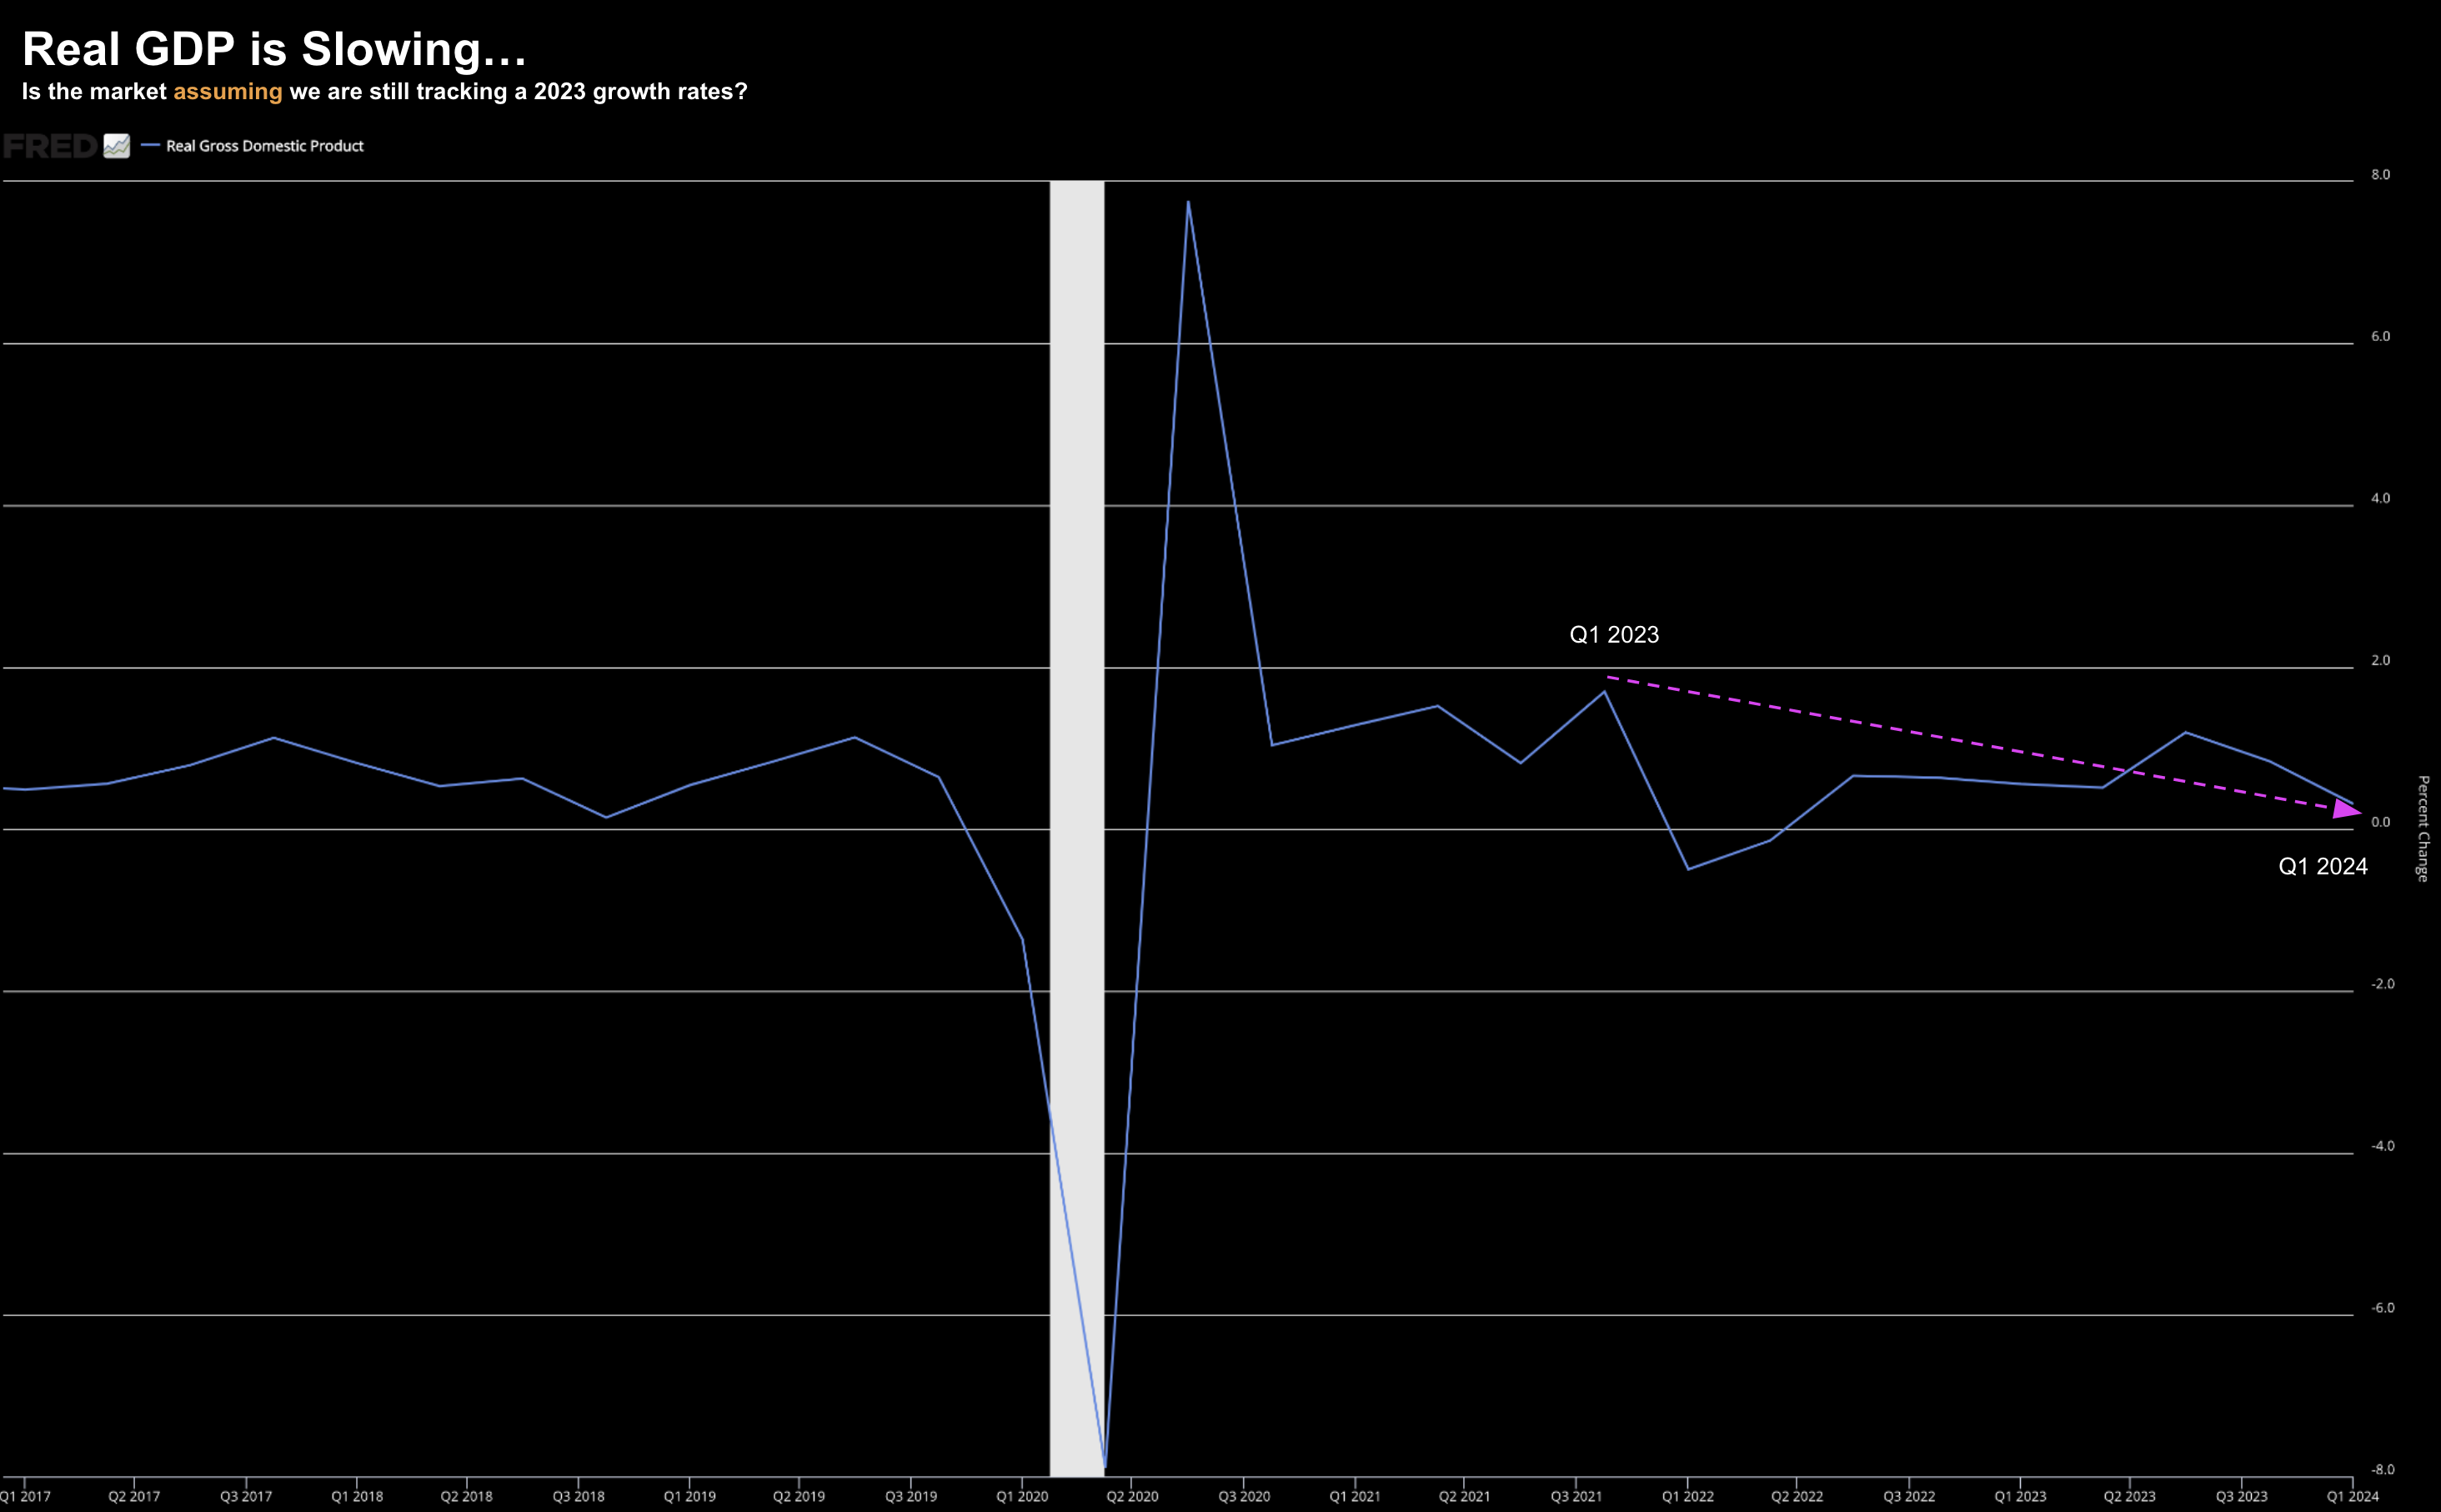
First quarter annualized real GDP came in at ~1.3%.
That’s down from the 3.4% annualized we saw the quarter prior…. and down from the 4.9% annualized in Q3 2023
As I commented recently, if it were not for ‘trillions’ in government spending, Q1 real GDP would have most likely been negative.
This is what I call a stall speed 1.0% growth economy – however it’s not a recession.
Not yet.
But here’s the question investor’s need to ask:
What’s the catalyst which will take us back to a 3.0% growth mode (i.e. what we saw over Q3 and Q4 of 2023)?
For example, is it the consumer?
They make up 70% of GDP with consumption – however they are mostly tapped out (as we have heard in the latest earnings reports)
Is it business investment?
Nope… they pulled back on investment in the last quarter… worried about demand and higher input costs.
Is it the “AI boom”?
Not yet.
Any potentially productivity gains we hope to see from AI are years away. In the near-term – what we will see is massive drain on cap-ex.
But it’s this declining GDP growth picture which should have investors asking questions.
For example, consider inflation.
If I’m right that GDP is set to slow – then it will follow that inflation will come down with it.
For example, the sharp 9% fall down to ~3.5% was mostly due to fixing supply chain snarls.
That’s done.
For the balance – we need to look more to the demand side of the equation.
Demand was in ‘good shape’ when the economy benefited from ‘trillions’ in stimulus and hand-outs from the government – resulting in more than $2 Trillion available in consumer savings.
That’s gone.
We only need to look at the language in the Fed’s beige book and more recently – various company earnings reports – where businesses are seeing pressure in terms of their pricing power.
Below is a snippet from the Fed’s beige book (March 6):
While the pace of most nonlabor input cost increases continued to slow, cost levels remained elevated. Technology, labor, and especially insurance cost increases were the most frequently cited inflationary concerns.
Consumers pushed back or traded down from higher-priced items, limiting firms’ pricing power and eroding margins.
The Atlanta Fed’s Business Inflation Expectations survey showed year-over-year unit cost growth decreased in January to 2.7 percent, on average, from 2.9 percent in December; firms’ year-ahead inflation expectations for unit cost growth decreased in January to 2.2 percent, on average, from 2.4 percent in December
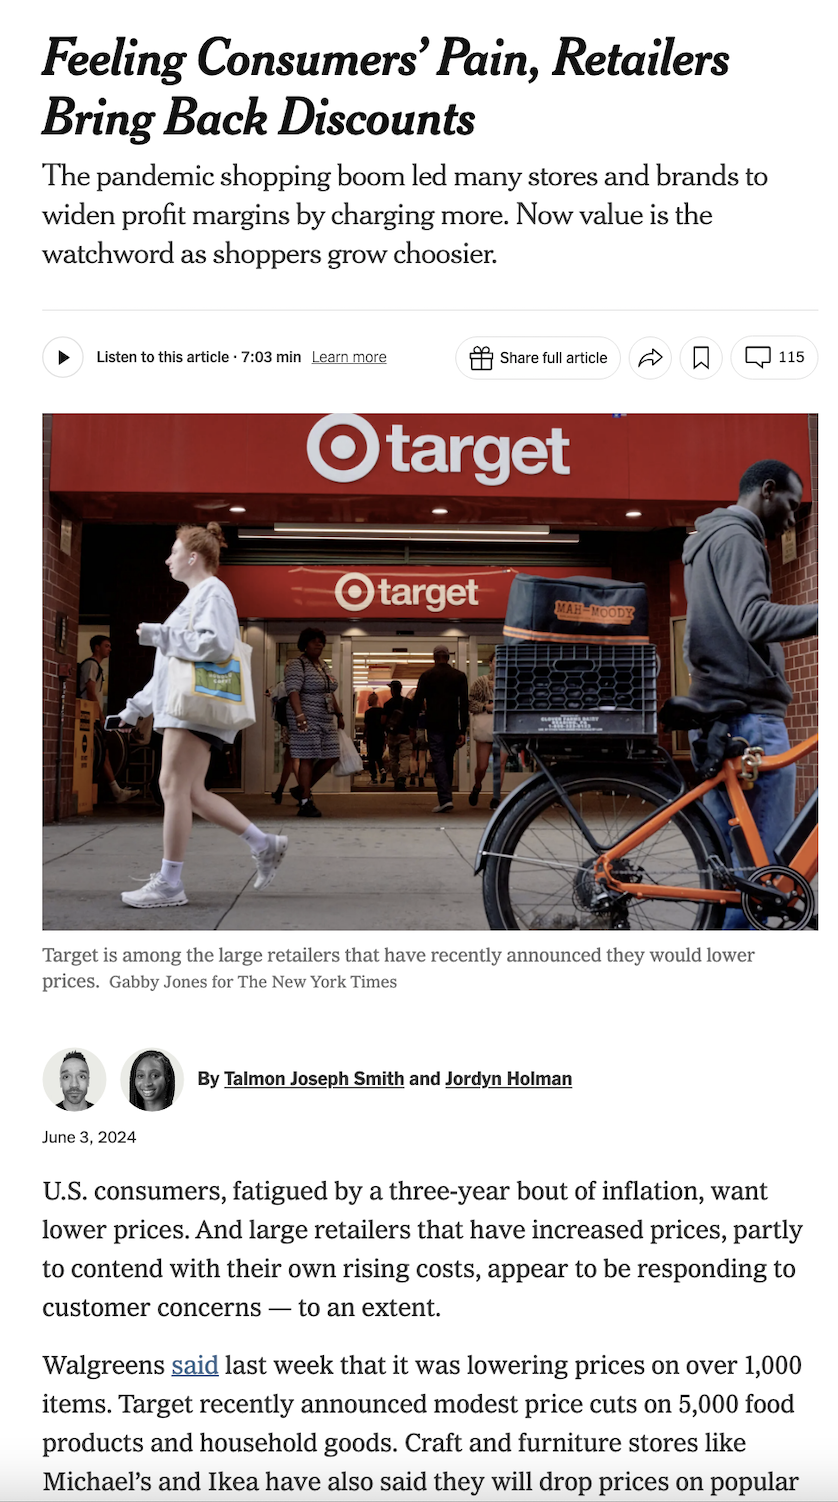
But you don’t need to read the Beige Book to understand this – listen to what we heard from leading retailers (from the New York times – June 3)
Walgreens, Target, IKEA and many others are now being forced to discount to attract shoppers.
And this comes back to consumers largely being tapped out.
Here’s CNN
The personal saving rate fell to 3.6% in February, the lowest level in more than a year, and in recent years it has hovered below levels seen in the decade.
If you put that all together – this is not only going to drag on GDP – it will impact company profits and earnings.
However, it will also have the effect of bringing down inflation.
Put simply, the money is no longer there to simply ‘pay any price’.
It was last year – it’s not now.
Remember the definition of inflation: “excess money chasing too few goods”
If Inflation Falls – So Will Bond Yields
If I’m right with the thesis I’ve outlined above (and I may not be) – then inflation will likely fall.
If that’s true – then bond yields will likely come down.
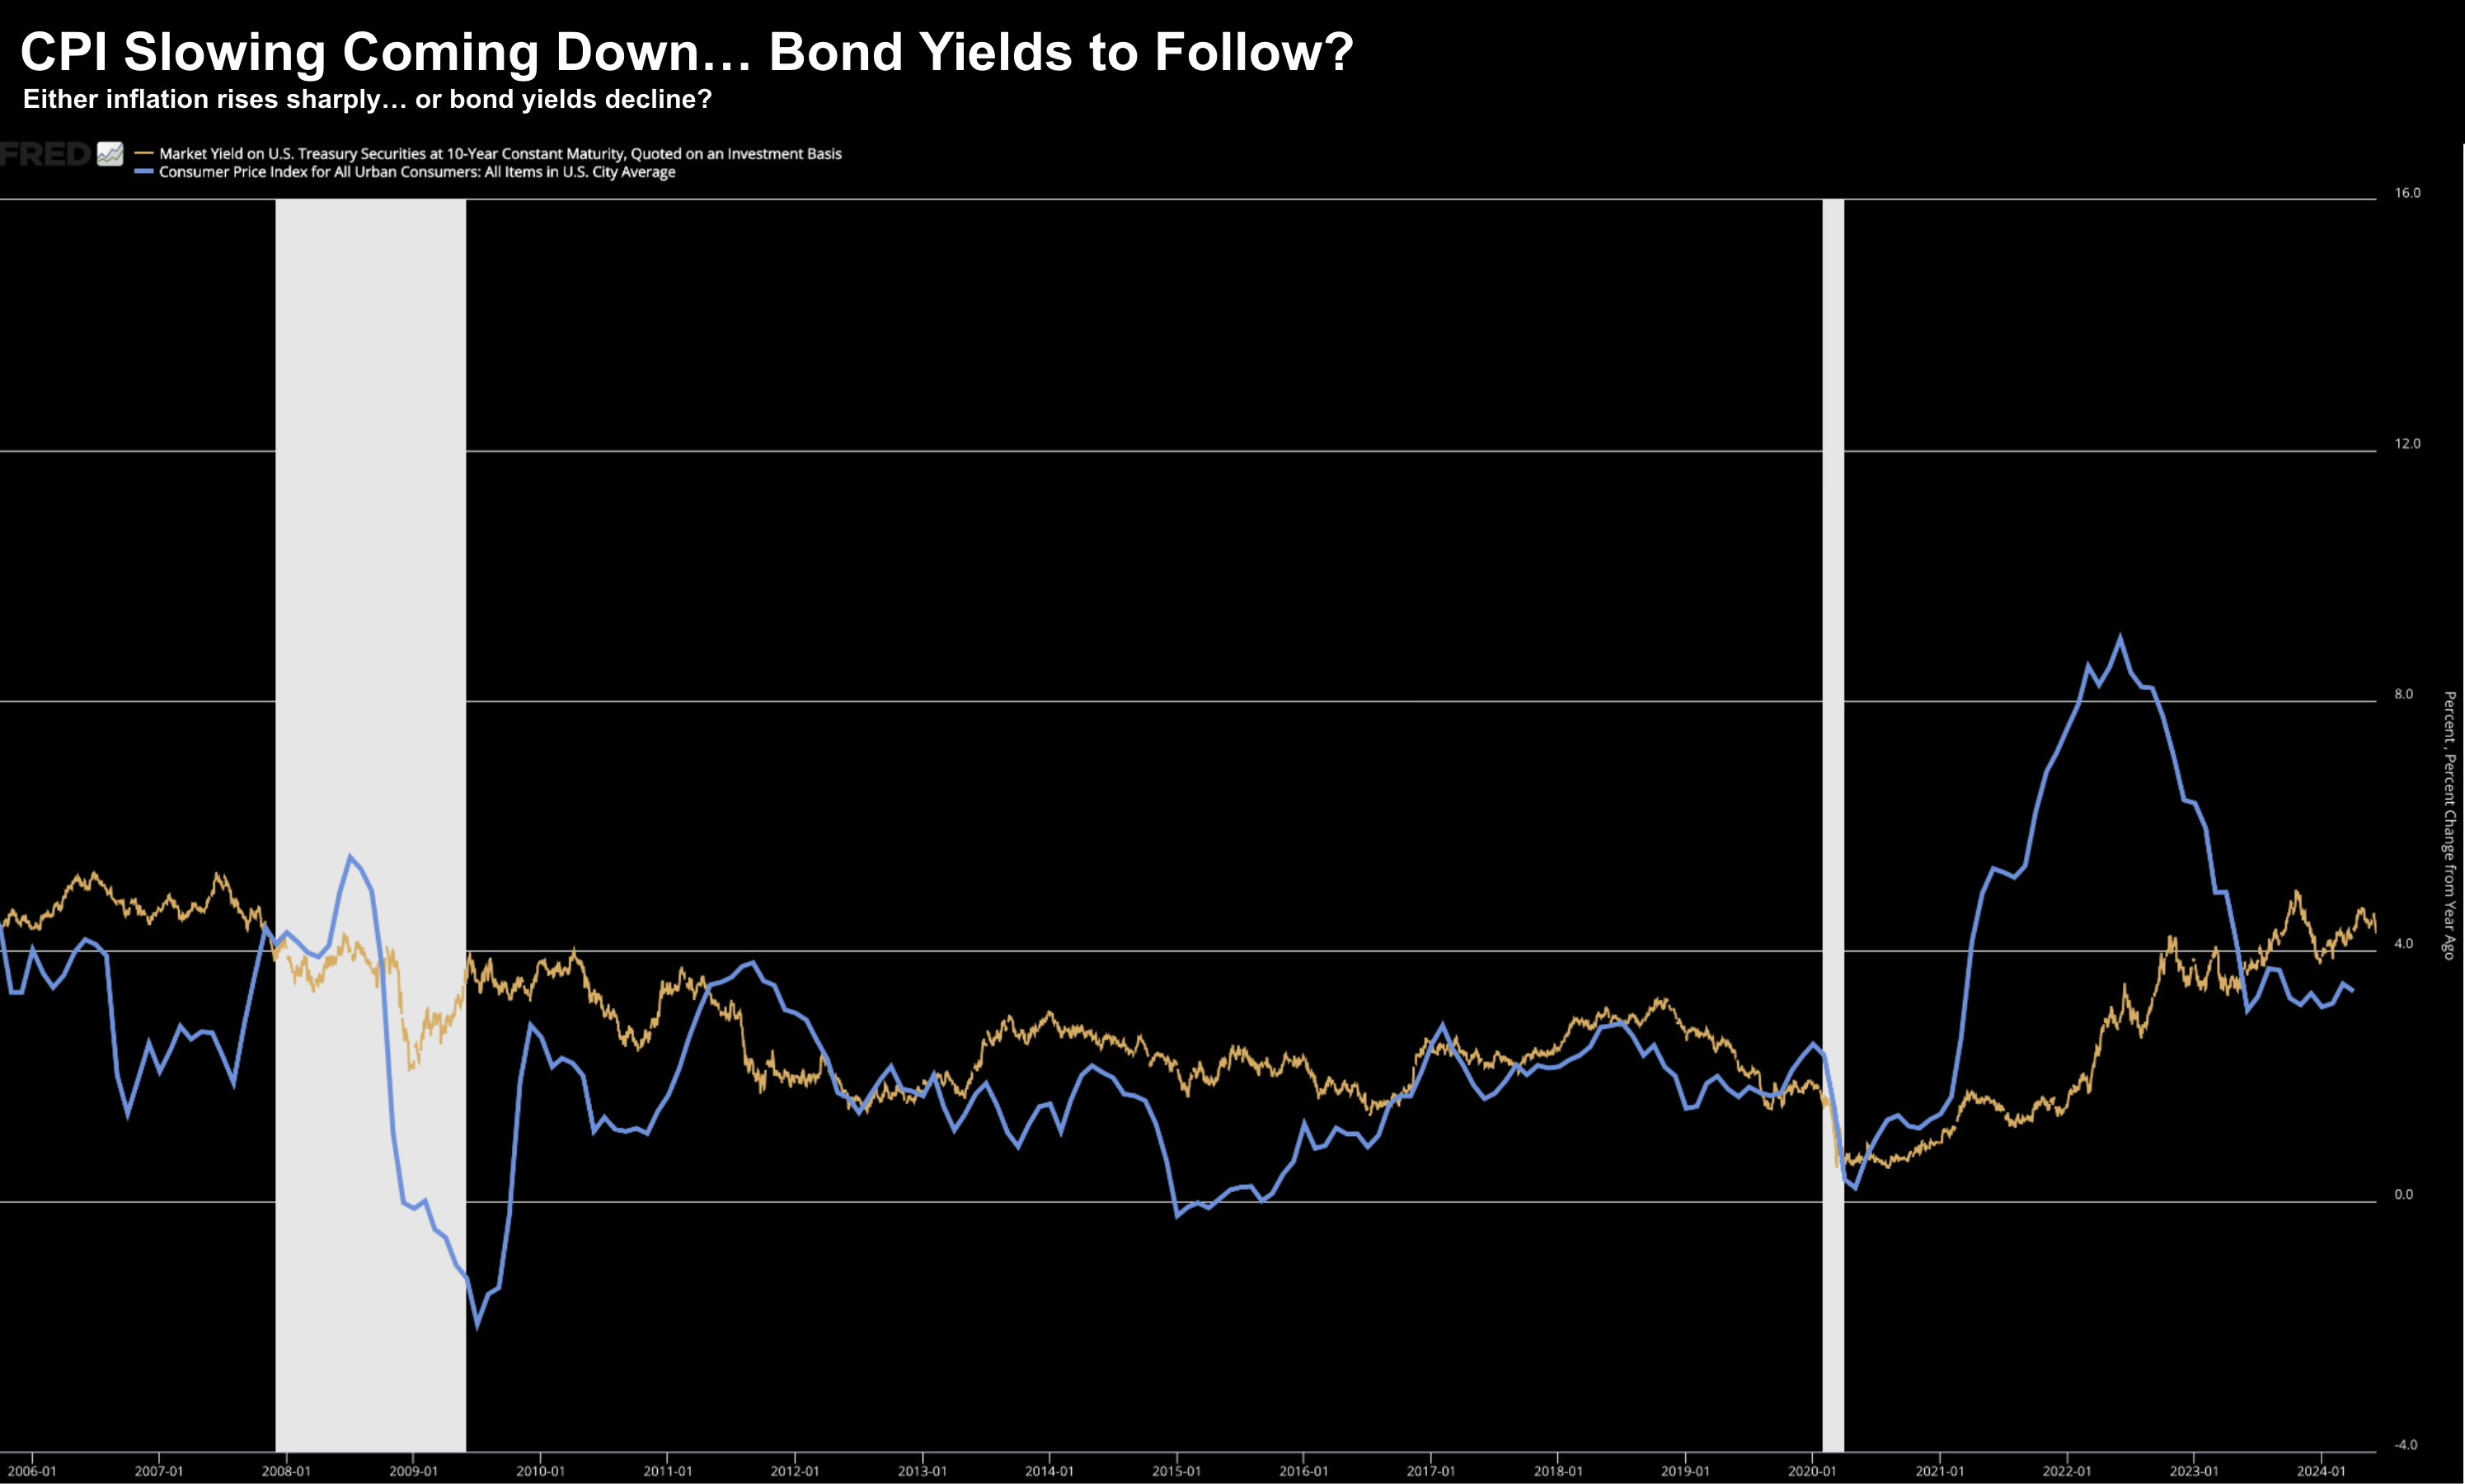
Repeating a chart I shared yesterday showing the correlation between CPI and the US 10-Year:
Here we can visualize the dramatic rise and fall of CPI the past two years.
The rise was due to a supply shortage (due to COVID) coupled with excess money (trillions from the government)
The fall has been due to (i) supply chains normalizing; (ii) a gradual withdrawal of excess money.
My expectation is this blue line will come back to 1-2% level we have seen over the past few decades.
To be clear, it won’t happen “tomorrow” as there is still ample liquidity in the system.
However, I think the path is lower.
If true, then it follows we see a decline in bond yields.
What I don’t know is the precise timing of when bond yields start to come down.
For example, I talked about this here:
“It’s Not When the Long and Variable Lags Hit… It’s When”
Put simply – I posited that due to the massive amounts of government intervention – the lags are longer this time.
For those less familiar – Milton Friedman – coined the term “long and variable lags” in a paper titled “Have Monetary Policies Failed?”
He concluded that it could take up to two years before the full effects are found on inflation.
During the 1970s, as the government and the Fed struggled to tame inflation, some of Friedman’s ideas were proven right.
However, today it’s (perhaps falsely) assumed these lags are now somewhat shorter than two years.
Clearly they were not.
But the business cycle has not been vanquished.
It still exists.
However, the cycle has been manipulated so much that predicting their timing has become that much more difficult.
Yesterday I called it a “frankenstein” economy.
That’s the thing with intervention:
Whilst I’m sure it has been done with good intent – there will be unseen consequences.
They’re yet to hit.
And from mine, those consequences are typically proportionate to the level of intervention.
Putting it All Together
I don’t pretend to be a great forecaster…
I get some things right and I get plenty wrong too.
And I’m good with that – as long as I learn from the errors made.
I’m reminded of a quote from economist John Maynard Keynes:
“When the facts change, I change my mind – what do you do, sir?”
We all get it wrong. And that’s fine.
First thing to do is admit you got it wrong and then do the work to understand why.
Chances are you will learn from it.
That’s where the gold is.
Don’t be one of those fools who choose to “die on the hill” trying to defend an incorrect thesis (or mistake they made) – especially if the weight of evidence suggests otherwise.
Before I close, we could see the US 10-year trading north of 4.0% for the balance of this year.
And I will have readers write to me and say “Adrian, you were wrong about bond yields falling, they’re still trading above 4.50% and it’s December”
Here’s the thing:
If the Fed doesn’t cut short-term rates; inflation still trades with a 3+ handle; and unemployment is below say 4.50% – sure – we could see that.
However, as we head into 2025, I find it difficult to see how long-term yields continue to trade north of this level.
And if I’m correct – bond prices stand to gain appreciably (i.e., yields fall)
ps: a big welcome to the 100+ new readers this week. I don’t know how you found me (as I don’t use any social media and nor do I advertise) – but I would love to know 🙂 Drop me a note. Hope you enjoy the blog… and apologies in advance for the many typos!

