- S&P 500 likely to fall a little further yet
- How to become an ‘antifragile’ investor
- Thoughts on the old Wall St. adage “don’t fight the tape”
Below is another one of my favourite Warren Buffett quotes:
“The stock market is a device for transferring money from the impatient to the patient”
Which one are you?
And while it sounds cliché, the power of patience is real.
We need patience for two things:
- Allowing our existing investments to work over time; and also
- If buying, waiting for prices to come to us (eliminating FOMO)
“Don’t Fight the Tape”
- ‘Don’t Fight the Fed’; and
- ‘Don’t Fight the Tape’
For me, there is weight to each of these.
‘Don’t Fight the Fed‘ tends to be more relevant for investors – those with a timeframe of several years (not days, weeks or months).
The latter however is more for traders.
But when I look at the price action over the past 6 months (i.e. post October 2023) – the mantra of “don’t fight the tape” has dominated the Fed and anything to do with fundamentals.
Yes, we can say the market rallied on the prospect of lower rates for a while.
However, despite 10-year bond yields pushing back above 4.60% last week, the S&P 500 was ~20% higher than it was when yields were the same level 6 months ago.
I called it a head-scratcher….. but that’s what momentum does.
“Don’t fight the tape” refers strictly to trends and momentum.
When any tradable asset enters a predictable trend – up or down – it’s necessary for a trader (or investor) to respect the price action.
This is why my blog bears the name it does.
For example, as I watched the market rip higher week after week this year, whilst I paired back my long exposure, I was not willing to short the market.
There was no way I was stepping in front of this fast moving freight train. The market was sending me a clear message – therefore I listened.
The so-called (poorly named) “Mag 7” and other momentum stocks surged.
And if you tried betting against them on a fundamental basis (e.g., “Netflix is too high at 40x earnings”) – you would have lost your shirt.
If you missed the trade – let it go – don’t try and catch it.
The thing is – momentum trades will often last longer than what you think is possible.
And therein lies the challenge…
All trends reverse at some point. Put another way – things will ultimately revert to the mean.
What’s more, trends will often pivot sharply and unpredictably.
We don’t try to guess when…
And for some – these pivots can be painful if you are caught on the wrong side of the tape.
S&P 500 Takes a Pause…
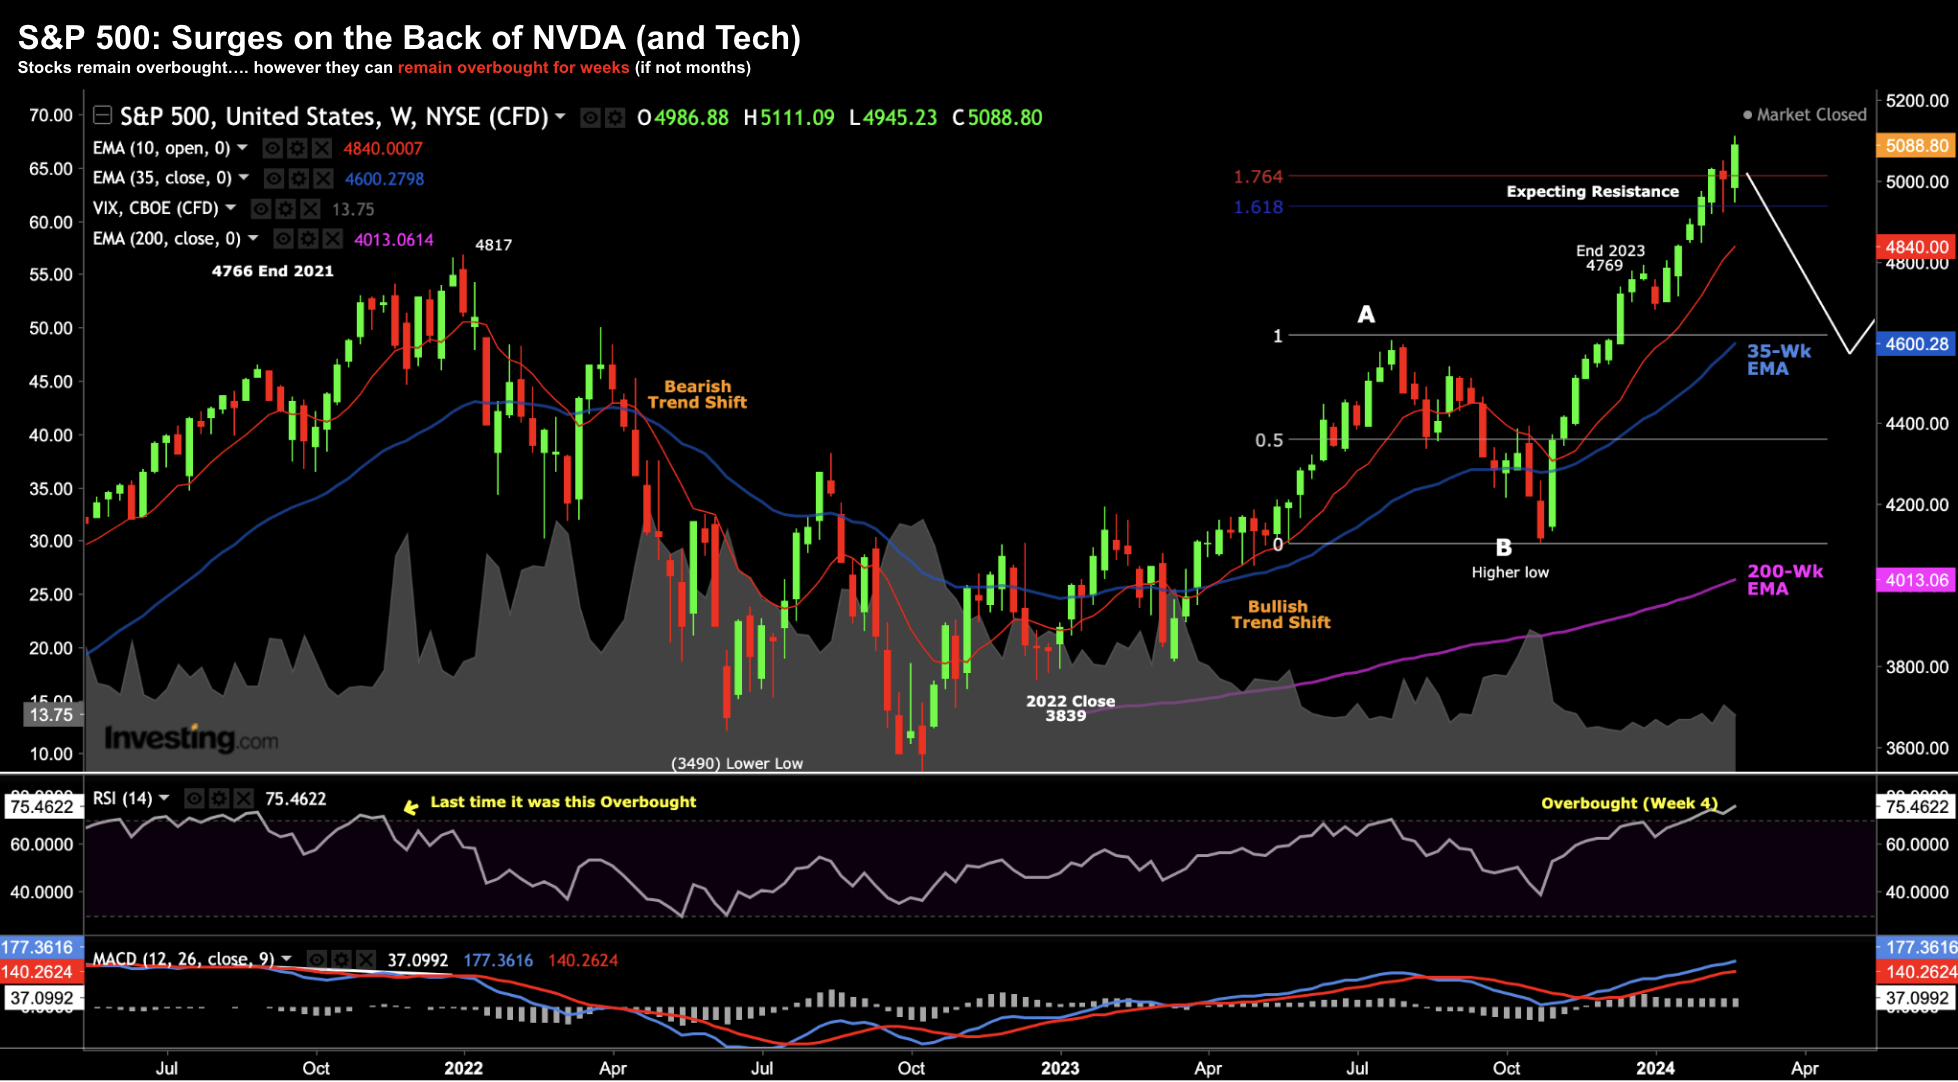
Before I update the chart for this week’s price action – let’s first scroll back to the week of Feb 23 this year.
The market was on a tear – trading around 5100 – led by momentum stock favourite Nvidia (NVDA)
Below is the weekly chart (and word of caution) I offered…
S&P 500 Feb 23 2024
I penned the white line – looking for a possible move back to ~4600 (the 35-week EMA at the time).
However, I also stressed the tape can remain overbought for weeks (if not months). At that stage, we were only 4 weeks where the RSI (middle window) was trading above 70.
As it turns out, overbought conditions persisted for another 6 weeks (a total of 10) with the market touching a high of 5264 (the week of March 25th); i.e., adding 3.4% from the week I offered caution.
Put another way, I felt the upside reward failed to outweigh the downside risks.
When that equation presents – it’s fragile.
The goal of this game (in trading and in life) is to identify “antifragile” opportunities – where the upside reward meaningfully outweighs the cost of taking the downside risk.
For example, it could be a taking new job; entering a partnership; going on a dinner date; attending a party; taking a cab vs driving; or a making a stock trade.
What’s the cost vs upside reward?
That’s the equation.
We aim for very low (or no) cost entry with the potential for greater upside reward. And if the downside risk is high – avoid it.
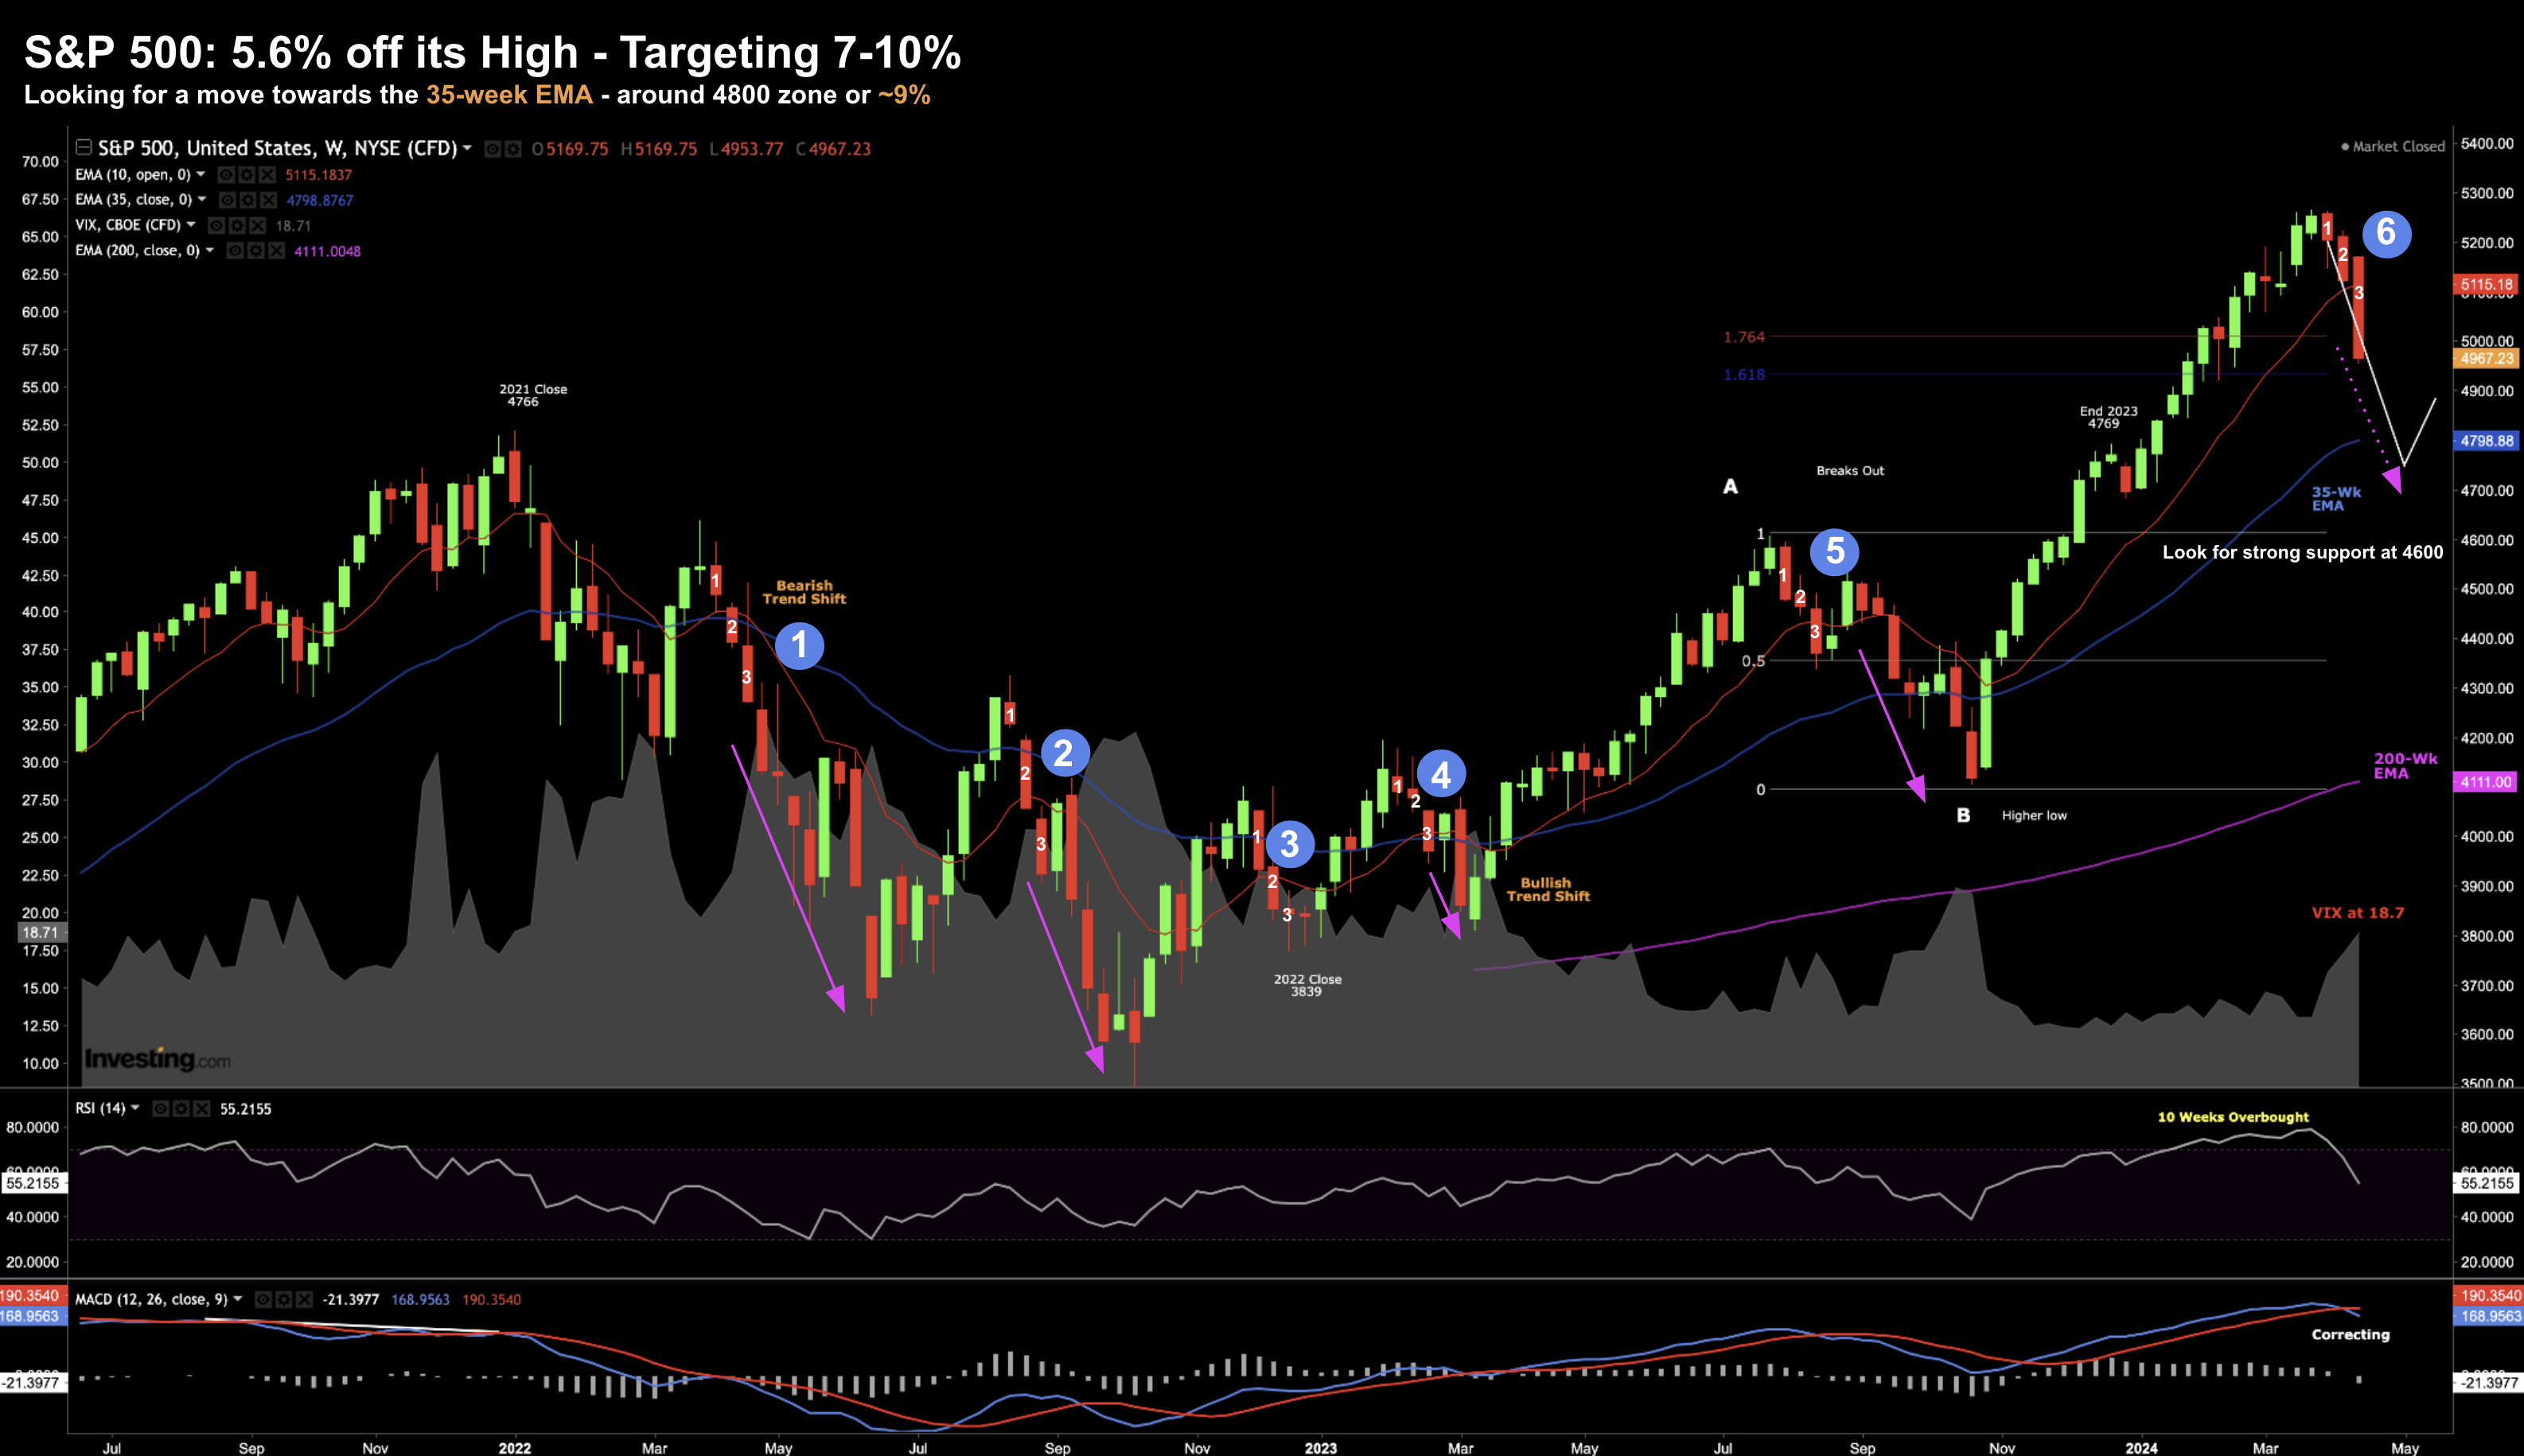
Let’s now update our chart – as the weekly trend warns:
Apr 20 2024
At the time of writing (Apr 20) – we’re 5.6% off the market all-time high.
Given we rallied 28.3% in 6 months from the October low – a ~5% move isn’t much.
What I hope to see is something closer to 7% to 10%; i.e., a move towards the 35-week EMA.
Recently I mentioned that it’s very typical to see the market pullback in the realm of 10-13% in any one year.
What’s not normal is what we saw from October.
The other annotation made on the chart is when we see three consecutive bearish candles (labelled with 6 blue dots).
In four of the previous five instances, the market proceeded to trade lower in the weeks ahead. With respect to instances “1”, “2” and “5” – it was meaningful.
My best guess is we see something similar; e.g. somewhere in the zone of 4600 to 4800 (pink dashed arrow).
And if we were to see 4600 – I believe that will act as strong support given it was strong resistance mid-last year.
For what it’s worth, if earnings are to grow 11-12% this year to $245 per share (which is possible pending the health of the consumer) – an entry point of 4600 represents a PE of 18.8x
That’s not unreasonable (nor is it a screaming bargain!) – and is in-line with the average PE of the past 10 years.
I will be adding long exposure in this zone.
What Goes Up Must Come Down
Before I close, I want to share what we’ve seen with the semiconductor (‘chips’) sector.
It led the market higher and is largely responsible for leading it down.
I offered my thoughts on the over-heated chips sector here “Are Semi’s Set to Cool Their Gen-AI Heels?”
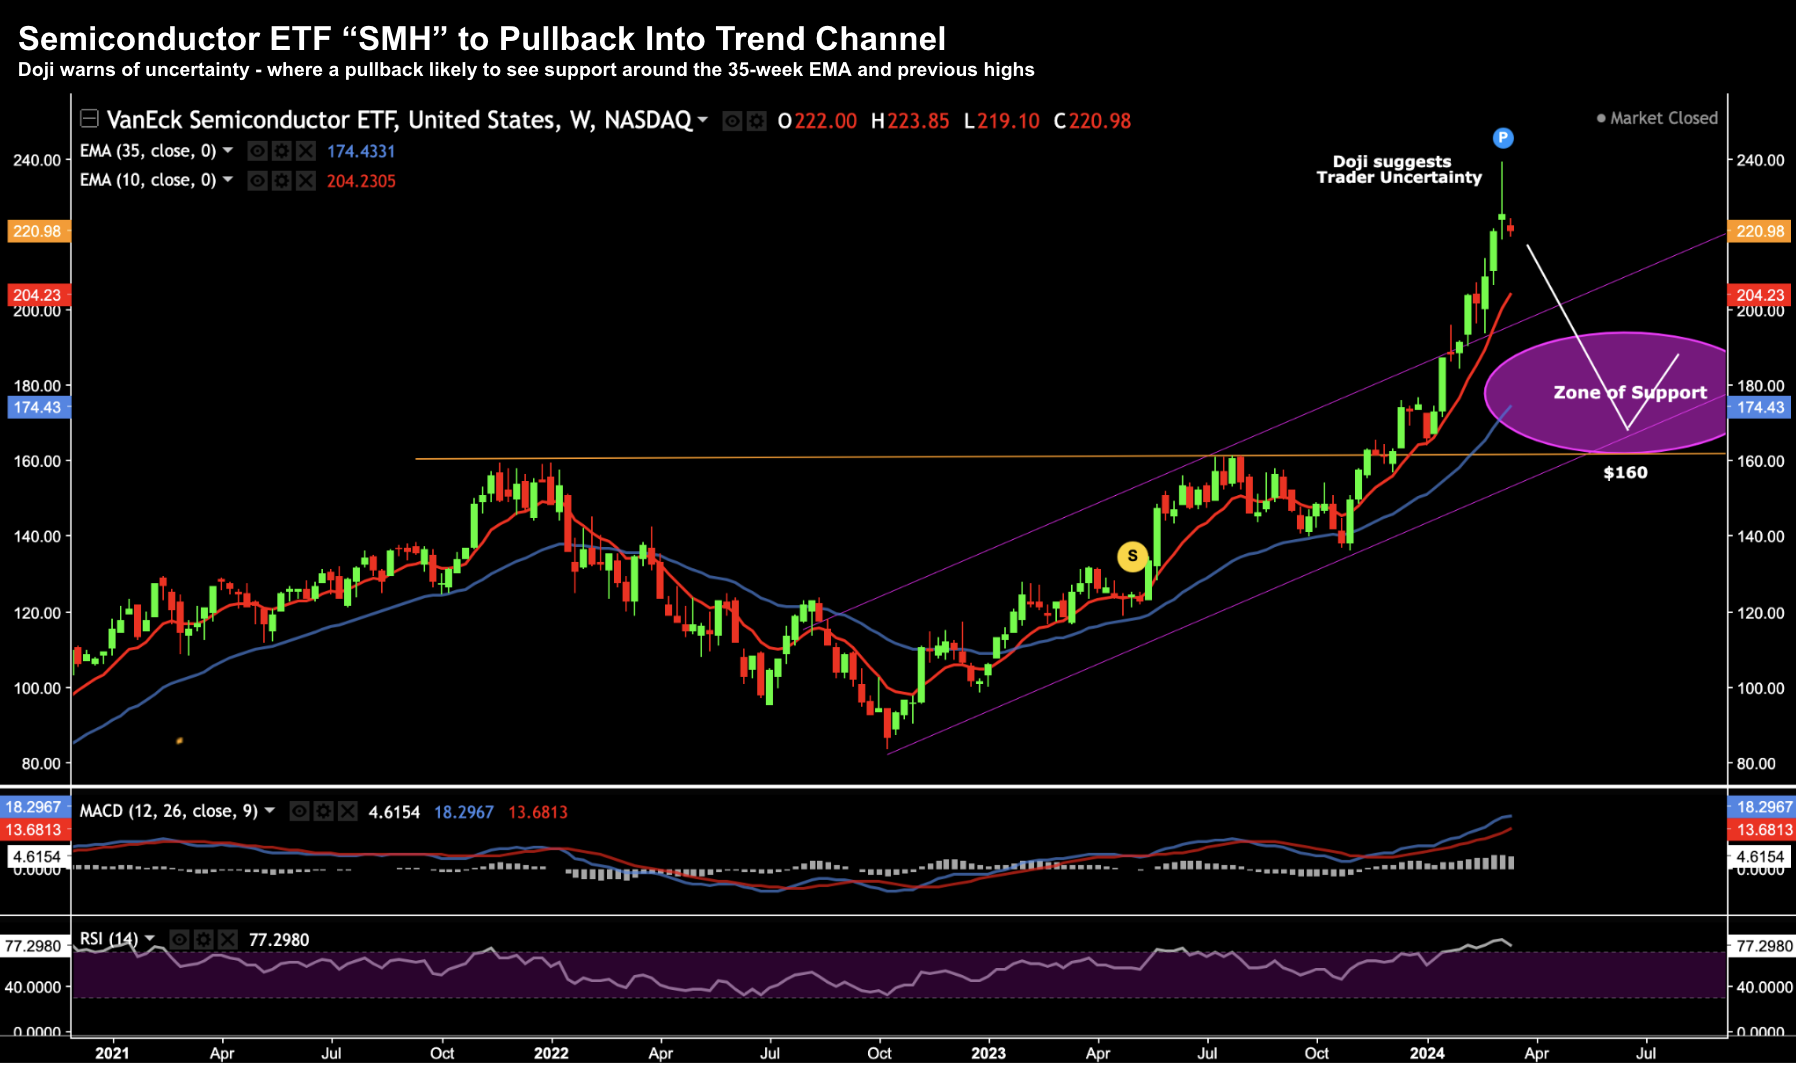
As part of this post – I put forward a couple of charts – one being the semiconductor ETF SMH.
Let’s take a look at the chart from March 11 (and warning given)
March 11 2024
Not unlike the S&P 500 Index – it was trading in overbought territory – and warned of downside.
I also called out the long-tail “doji” candle – which warns of investor uncertainty.
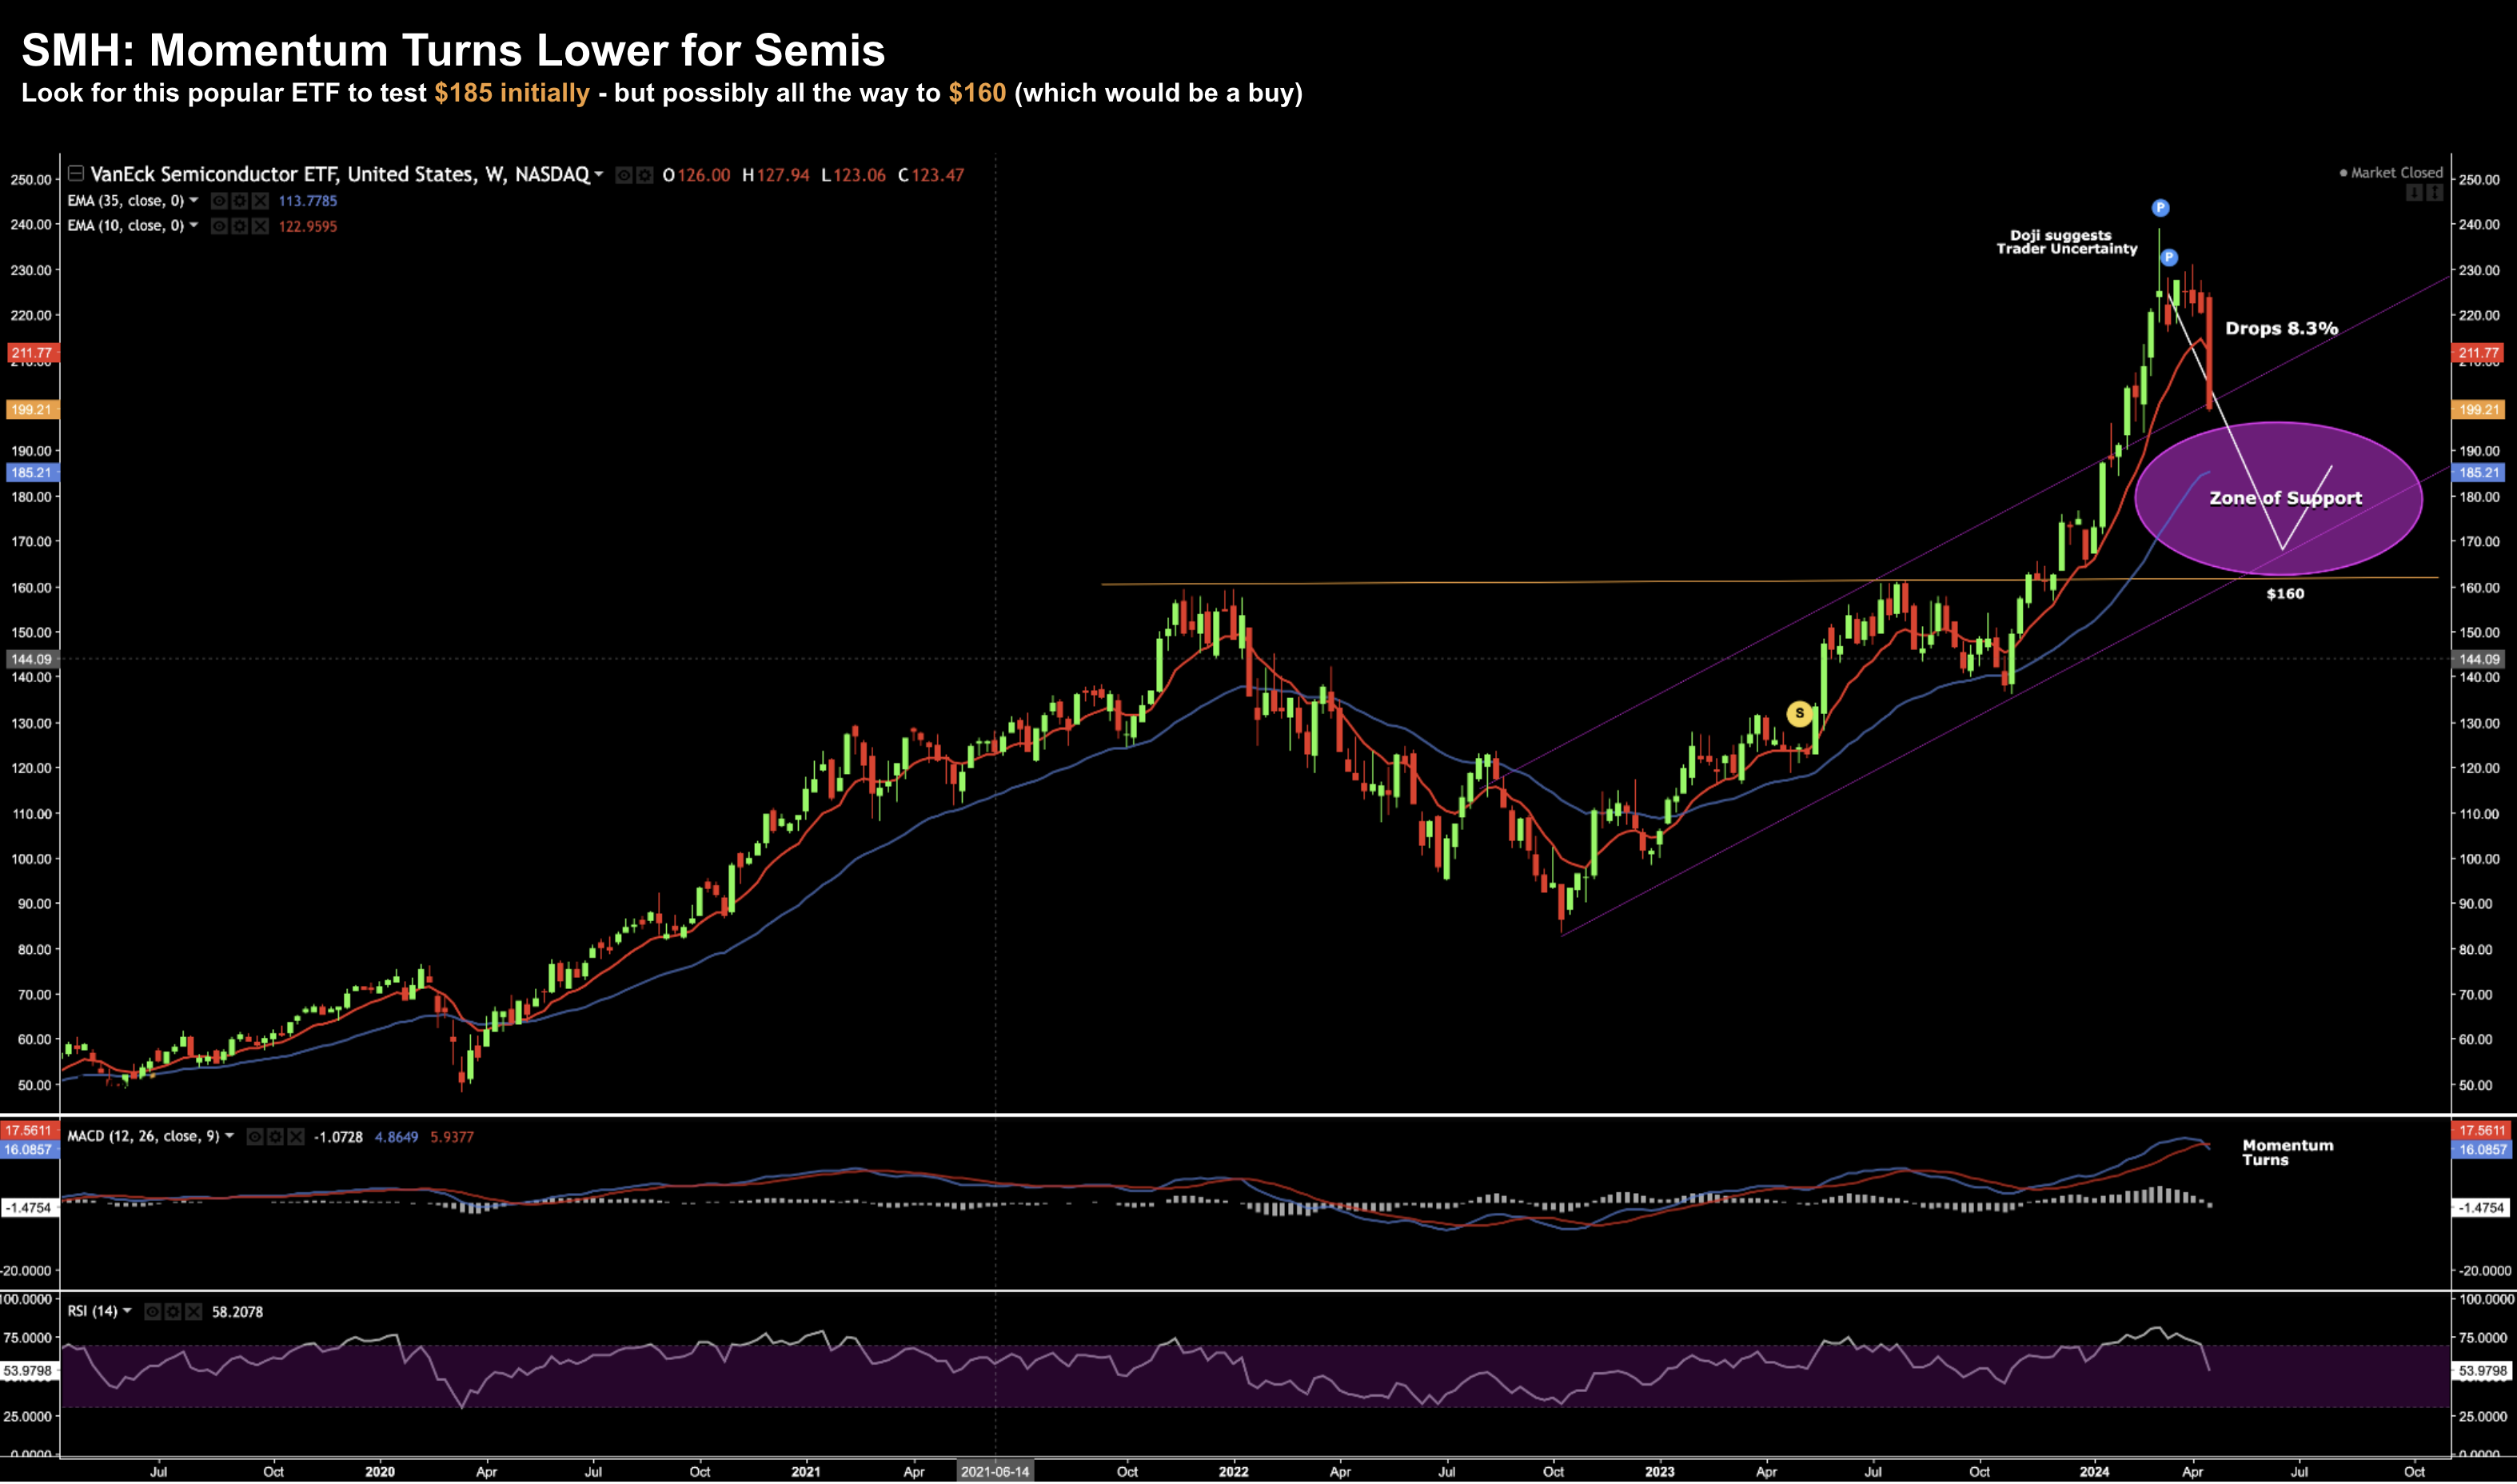
Let’s update the weekly chart for SMH:
Apr 20 2024
The sharp fall in stocks like NVDA, AMD and others is largely what led the market lower.
With respect to this SMH – there’s room for it to trade lower.
My best guess is the tape will test $185 initially – however could easily drop to $160 (previous level of resistance).
And from mine, that’s the area which offers a better chance of upside.
Putting it All Together
This game is about probabilities and risk.
It’s centered on putting yourself in a position of strength – not one of fragility.
When you’re not fragile – you welcome volatility.
You embrace the risks.
You’re always looking for opportunities where the upside reward will handily offset the cost of taking the risk.
That doesn’t mean those investments will work – they may not. And we expect some of our investments to fail.
There is always risk when deciding to speculate.
And that’s fine.
With that said, let me close with some wise words from Howard Marks’ latest memo on risk:
“Investors must accept that success is likely to stem from making a large number of investments, all of which you make because you expect them to succeed, but some portion of which you know won’t.
You have to put it all out there. You have to take a shot. Not every effort will be rewarded with high returns, but hopefully enough will do so to produce success over the long term.
That success will ultimately be a function of the ratio of winners to losers, and of the magnitude of the losses relative to the gains.
But refusal to take risk in this process is unlikely to get you where you want to go”.


